

Abstract
Evidence suggests oxidative and electrophilic stress as a major factor contributing to the neuronal cell death in neurodegenerative disorders, especially Parkinson’s disease. Consistent with this concept, administration of exogenous antioxidants has been shown to be protective against oxidative/electrophilic neurodegeneration. However, whether induction of endogenous antioxidants and phase 2 enzymes by the unique chemoprotectant, 3H-1,2-dithiole-3-thione (D3T) in neuronal cells also affords protection against oxidative and electrophilic neurocytotoxicity has not been carefully investigated. In this study, we showed that incubation of SH-SY5Y neuroblastoma cells or primary human neurons with micromolar concentrations (10–100 μM) of D3T for 24 h resulted in significant increases in the levels of reduced glutathione (GSH) and NAD(P)H:quinone oxidoreductase 1 (NQO1), two crucial cellular defenses against oxidative and electrophilic stress. D3T treatment also caused increases in mRNA expression of γ-glutamylcysteine ligase catalytic subunit and NQO1 in SH-SY5Y cells. In addition, D3T treatment of the neuronal cells also resulted in a marked elevation of GSH content in the mitochondrial compartment. To determine the protective effects of the D3T-induced cellular defenses on neurotoxicant-elicited cell injury, SH-SY5Y cells were pretreated with D3T for 24 h and then exposed to dopamine, 6-hydroxydopamine (6-OHDA), 4-hydroxy-2-nonenal (HNE), or H2O2, agents that are known to be involved in neuron degeneration. We observed that D3T-pretreatment of SH-SY5Y cells led to significant protection against the cytotoxicity elicited by the above neurotoxicants. Similar neurocytoprotective effects of D3T-pretreatment were also observed in primary human neurons exposed to 6-OHDA or HNE. Taken together, this study demonstrates that D3T potently induces neuronal cellular GSH and NQO1 as well as mitochondrial GSH, and that such upregulated endogenous defenses are accompanied by increased resistance to oxidative and electrophilic neurocytotoxicity.
Keywords: SH-SY5Y neuroblastoma cells; 3H-1,2-dithiole-3-thione; Glutathione; NAD(P)H:quinone oxidoreductase 1; Dopamine; 6-Hydroxydopamine; 4-Hydroxy-2-nonenal; H2O2; Cytotoxicity
Introduction
Parkinson’s disease (PD) is a neurodegenerative disorder, which involves the the loss of dopaminergic neurons of the substantia nigra. Although the etiology and pathogenesis of PD remain unclear, numerous recent studies suggest that increased formation of reactive oxygen species (ROS) and the consequent oxidative stress as well as mitochondrial dysfunction appear to be important events leading to dopaminergic neuronal cell death in PD (Beal, 2003). Dopaminergic neurons are particularly prone to oxidative and electrophilic stress due to oxidation of dopamine, resulting in the generation of ROS as well as the electrophilic quinone molecules (Spina and Cohen, 1989). ROS-induced alteration of macromolecules including polyunsaturated fatty acids in membrane lipids, proteins, and DNA has been observed in the substantia nigra of the parkinsonian patients and animal models (Alam et al., 1997a; Alam et al., 1997b; Selley, 1998).
To minimize oxidative/electrophilic damage to cellular components, cells have evolved a number of antioxidant defenses (Storey, 1996). For example, endogenous cellular antioxidant glutathione (GSH) and NAD(P)H:quinone oxidoreductase 1 (NQO1), one of the extensively investigated phase 2 enzymes, have recently been demonstrated to play important roles in protecting cells against oxidative stress and electrophilic quinone-induced damage (Spencer et al., 1998; Ross et al., 2000). GSH is the primary low-molecular-weight thiol antioxidant and synthesized from its constituent amino acids via the actions of two ATP-dependent enzymes, γ-glutamylcysteine ligase (GCL) and GSH synthetase, with GCL being the rate-limiting enzyme in the overall pathway (Anderson, 1998). GSH is also the co-substrate for several key cellular antioxidative and phase 2 enzymes. In this context, early depletion of cellular GSH and the accompanying oxidative stress in substantia nigra are important biochemical features of PD (Perry et al., 1982; Perry and Yong, 1986; Sofic et al., 1992; Spencer et al., 1995; Sechi et al., 1996).
The increasing recognition of the critical involvement of oxidative as well as electrophilic stress in PD has led to the development of antioxidative compounds for intervention of this neurodegenerative disorder (Ahlskog, 1990; Korytowski et al., 1995; Sechi et al., 1996). However, the limited bioavailability, inefficient permeability, and other untoward effects associated with the use of the individual exogenous antioxidative compounds raised questions on their effectiveness in protecting against PD (Ebadi et al., 1996; Ratnam et al., 2006). In this regard, another strategy to protect against the oxidative and electrophilic processes underlying PD may be through coordinated induction of endogenous antioxidants and phase 2 enzymes in neuronal cells by chemical inducers, such as 3H-1,2-dithiole-3-thione (D3T), the most potent member of dithiolethiones for induction of phase 2 enzymes. Such studies, however, are currently lacking in the literature.
Dithiolethiones are five-membered cyclic sulfur-containing compounds. A growing number of studies over the last several years have demonstrated that dithiolethiones, particularly D3T are potent inducers of endogenous antioxidants and phase 2 enzymes in hepatic and cardiovascular tissues/cells (Kwak et al., 2001; Peng and Li, 2002; Cao et al., 2003b). However, whether endogenous antioxidants and phase 2 enzymes could also be induced by D3T in neuronal cells and whether such increased cellular defenses could afford protection against oxidative/electrophilic neuronal cell injury have not been reported in the literature. In this study, using SH-SY5Y neuroblastoma cells and primary human neurons, we have investigated the induction of cellular antioxidants and phase 2 enzymes by D3T, and the protective effects of the D3T-upregulated cellular defenses on cytotoxicity elicited by dopamine, 6-hydroxydopamine (6-OHDA), 4-hydroxy-2-nonenal (HNE), or H2O2. Our results demonstrate that total cellular GSH and NQO1 as well as mitochondrial GSH can be potently induced by D3T in both cultured SH-SY5Y cells and primary human neurons, which is accompanied by increased resistance to the above neurotoxicant-induced cell injury.
Results
Effects of D3T treatment on GSH content and NQO1 activity in SH-SY5Y cells
GSH is the main non-protein antioxidant and plays a critical role in the detoxification of H2O2 and lipid hydroperoxide, and in protection against dopamine-induced oxidative/electrophilic stress (Kehrer, 1993; Spencer et al., 1998). As such, GSH has been suggested to play important roles in attenuating the oxidative pathophysiology underlying PD (Spencer et al., 1998). We first determined if D3T could cause elevation of GSH content. As shown in Fig. 1A, incubation of SH-SY5Y cells with 10–100 μM of D3T for 24 h resulted in dramatic increases in total cellular GSH content. Moreover, the increases in total cellular GSH content induced by D3T also exhibited a D3T concentration-dependent relationship; significant GSH induction was seen with D3T at concentrations as low as 10 μM (Fig. 1A).
Figure 1.
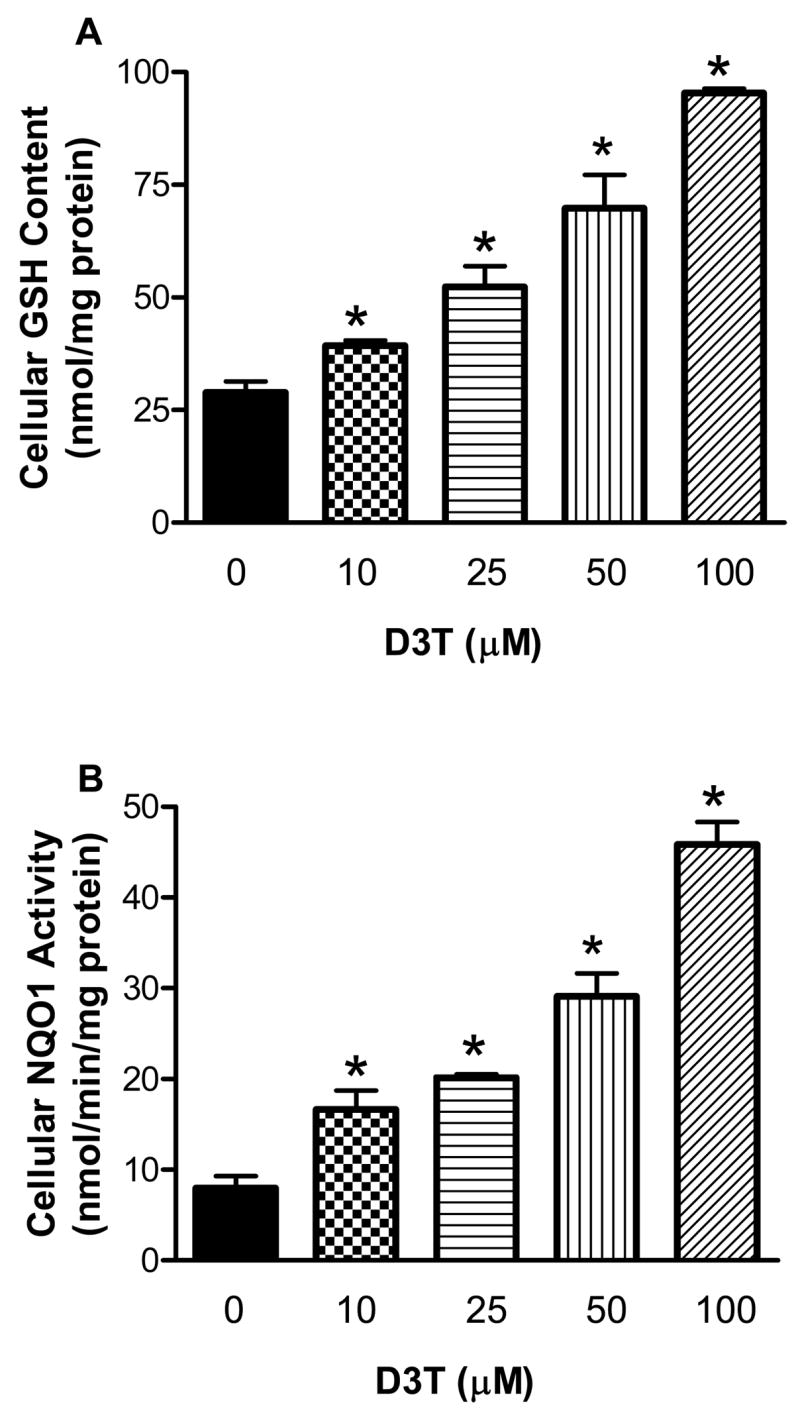
Concentration-dependent induction of GSH (A) and NQO1 (B) by D3T in SH-SY5Y cells. SHSY5Y cells were incubated with the indicated concentrations of D3T for 24 h, followed by measurement of cellular GSH content and NQO1 activity. Values represent mean ± S.E.M., n = 4. *, significantly different from the respective control group.
NQO1 is a phase 2 enzyme that participates in the detoxification of dopamine-derived quinone molecules and ROS (Siegel et al., 1997; Ross, 2004; Siegel et al., 2004; Zafar et al., 2006). As shown in Fig. 1B, incubation of SH-SY5Y cells with D3T (10–100 μM) also led to significant increases in cellular NQO1 activity. Similar to GSH, induction of NQO1 by D3T also exhibited a concentration-dependent manner. A more than 2-fold induction of cellular NQO1 was seen with 10 μM D3T. Notably, a remarkable 3 to 5.5-fold induction of NQO1 was observed with 50 and 100 μM D3T (Fig. 1B).
Since GSH is present in mitochondria, a critical intracellular target for ROS as well as electrophile-mediated neuronal cell injury (Merad-Boudia et al., 1998), we next examined if D3T could cause elevation of mitochondrial GSH content. As shown in Fig. 2, incubation of SH-SY5Y cells with 25–100 μM D3T for 24 h resulted in significant increases in mitochondrial GSH content. The induction of mitochondrial GSH by D3T also exhibited a D3T concentration- dependent fashion.
Figure 2.

Effects of D3T treatment on mitochondrial GSH level in SH-SY5Y cells. Cells were incubated with the indicated concentrations of D3T for 24 h. The mitochondria were then immediately isolated for measurement of GSH content. Values represent means ± S.E.M., n = 3. *, significantly different from control.
Effects of D3T treatment on superoxide dismutase (SOD), catalase, glutathione reductase (GR), GSH peroxidase (GPx) and GSH S-transferase (GST) activities in SH-SY5Y cells
In addition to GSH and NQO1, two highly inducible cellular defenses, we also determined the inducibility of other cellular antioxidants and phase 2 enzymes by D3T in SH-SY5Y cells. As shown in Table 1, incubation of SH-SY5Y cells with 10–100 μM D3T for 24 h did not result in any statistically significant changes in the levels of cellular SOD, catalase, GR, GPx and GST.
Effects of D3T on GCL catalytic subunit (GCLC) and NQO1 mRNA expression
Because both GSH and NQO1 were highly inducible by D3T (Fig. 1A and B), we next determined if D3T treatment of SH-SY5Y cells could result in increased levels of mRNA for GCLC and NQO1. In this study, a standard curve for both GCLC and NQO1 mRNA using 25, 50, 100 and 200 ng of total RNA was included in each assay so as to reliably determine changes in mRNA levels for both genes in SH-SY5Y cells following treatment with 100 μM D3T. We observed that a linear correlation existed between the optical density and the amounts of RNA (r2 > 0.99) for both genes. As shown in Figs. 3 and 4, the mRNA levels for GCLC and NQO1 genes began to increase 3 h after treatment with 100 μM D3T. An overall 2.5–3-fold increase in the mRNA levels for GCLC and 3.5–4.5-fold increase for NQO1 were observed between 12 and 24 h after D3T treatment. In contrast, the mRNA levels for the house-keeping gene, glyceraldehyde-3-phosphate dehydrogenase (GAPDH) remained unchanged throughout the indicated time points of D3T treatment.
Figure 3.

Standard curve for quantification of GCLC mRNA levels (A) and time-dependent induction of GCLC mRNA expression by D3T (B) in SH-SY5Y cells. In A, representative gel picture and line graph show the linear amplification of the PCR product derived from indicated amounts of total RNA. In B, top panels display representative gel pictures showing the mRNA levels of GCLC and GAPDH at the indicated times after treatment of SH-SY5Y cells with 100 μM D3T; bottom panel shows quantitative analysis of GCLC mRNA expression. Values in panel B represent means ± S.E.M., n = 3. * Significantly different from 0 h.
Figure 4.
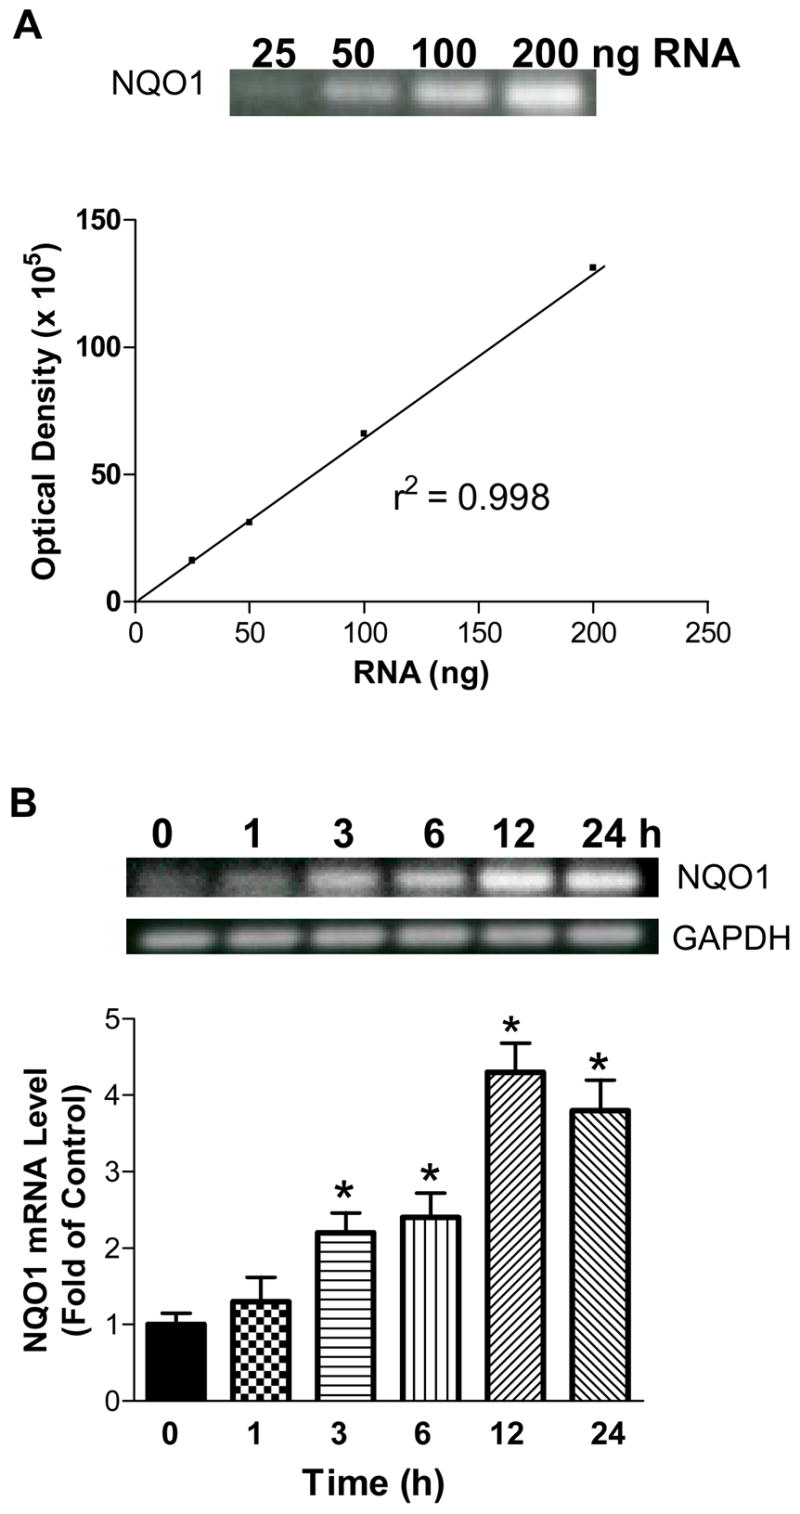
Standard curve for quantification of NQO1 mRNA levels (A) and time-dependent induction of NQO1 mRNA expression by D3T (B) in SH-SY5Y cells. In A, representative gel picture and line graph show the linear amplification of the PCR product derived from indicated amounts of total RNA. In B, top panels display representative gel pictures showing the mRNA levels of NQO1 and GAPDH at the indicated times after treatment of SH-SY5Y cells with 100 μM D3T; bottom panel shows quantitative analysis of NQO1 mRNA expression. Values in panel B represent means ± S.E.M., n = 3. * Significantly different from 0 h.
Protective effects of D3T-pretreatment on dopamine-induced cytotoxicity in SH-SY5Y cells
As stated above, both GSH and NQO1 play critical roles in the detoxification of dopamine-derived ROS as well as electrophilic quinone molecules (Berman and Hastings, 1999; Ross, 2004). To examine if the D3T-elevated cellular defenses could lead to cytoprotection against dopamine-induced neuronal injury, SH-SY5Y cells were pretreated with D3T and then exposed to dopamine. As shown in Fig. 5, incubation of SH-SY5Y cells with various concentrations of dopamine for 24 h led to significant decreases in cell viability, as detected by 3-[4,5-dimethylthiazol-2-yl]-2,5-diphenyltetrazolium (MTT) reduction assay. The decreases in cell viability were dependent on the concentrations of dopamine. Pretreatment of SH-SY5Y cells with 100 μM D3T for 24 h afforded a significant protection against dopamine-induced decreases in cell viability. Notably, the cytotoxicity elicited by 400 μM dopamine was still protected by D3T-pretreatment (Fig. 5).
Figure 5.

Protective effects of D3T-pretreatment on dopamine-mediated cytotoxicity in SH-SY5Y cells. SH-SY5Y cells were pretreated with 100 μM D3T in 24-well culture plates for 24 h, followed by exposure to the indicated concentrations of dopamine for another 24 h. Cell viability was detected using MTT reduction assay. Values represent mean ± S.E.M., n = 4. * Significantly different from the respective control group.
Protective effects of D3T-pretreatment on 6-OHDA-induced cytotoxicity in SH-SY5Y cells
6-OHDA is another selective catecholaminergic neurotoxin that can oxidize to form free radicals and reactive quinone molecules. Since 6-OHDA is widely used to investigate the pathogenesis and progression of experimental parkinsonism, we also examined the protective effects of D3T-pretreatment on cytotoxicity induced by 6-OHDA. To this end, SH-SY5Y cells were pretreated with 100 μM D3T for 24 h and then exposed to 25, 50, 75, and 100 μM 6-OHDA for another 24 h. As shown in Fig. 6, 6-OHDA at concentrations of 25 μM and above caused significant decreases in cell viability in a concentration-dependent fashion. Pre-treatment of SH-SY5Y cells with D3T resulted in a marked protection against 6-OHDA-induced cytotoxicity (Fig. 6).
Figure 6.

Protective effects of D3T-pretreatment on 6-OHDA-mediated cytotoxicity in SH-SY5Y cells. SH-SY5Y cells were pretreated with 100 μM D3T in 24-well culture plates for 24 h, followed by exposure to the indicated concentrations of 6-OHDA for another 24 h. Cell viability was detected using MTT reduction assay. Values represent mean ± S.E.M., n = 4. * Significantly different from the respective control group.
Protective effects of D3T-pretreatment on HNE-induced cytotoxicity in SH-SY5Y cells
Previous studies have demonstrated that GSH plays a critical role in detoxification of reactive aldehydes, including HNE, a highly electrophilic alpha, beta-unsaturated aldehyde that can exert biological effects relevant to the pathobiology of oxidative neuron degeneration (Volkel et al., 2006). Accordingly, we investigated the cytoprotective effects of D3T-pretreatment on HNE induced toxicity in SH-SY5Y cells. To this end, SH-SY5Y cells were pretreated with 100 μM D3T for 24 h and then exposed to various concentrations of HNE for another 24 h. As shown in Fig. 7, incubation of SH-SY5Y cells with HNE at micromolar concentrations resulted in decreases in cell viability in a concentration-dependent manner. Pretreatment of SH-SY5Y cells with D3T afforded a remarkable protection against cytotoxicity elicited by HNE at concentrations ranging from 5 to 40 μM (Fig. 7).
Figure 7.
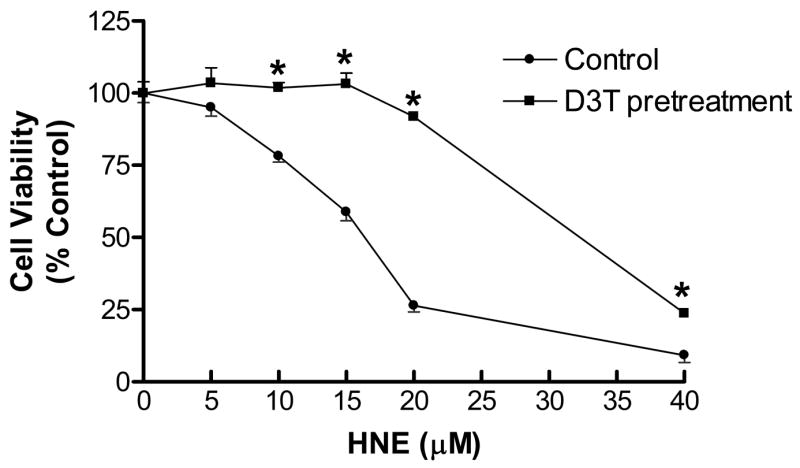
Protective effects of D3T-pretreatment on HNE-mediated cytotoxicity in SH-SY5Y cells. SH-SY5Y cells were pretreated with 100 μM D3T in 24-well culture plates for 24 h, followed by exposure to the indicated concentrations of HNE for another 24 h. Cell viability was detected using MTT reduction assay. Values represent mean ± S.E.M., n = 4. *Significantly different from the respective control group.
Protective effects of D3T-pretreatment on H2O2-induced cytotoxicity in SH-SY5Y cells
H2O2 is one of the most common forms of ROS involved in the pathophysiology of neurodegenerative disorders. As aforementioned, H2O2 is also generated from the auto-oxidation of dopamine. To examine if the D3T-elevated cellular defenses could lead to cytoprotection against ROS-mediated injury, SH-SY5Y cells were pre-treated with 100 μM D3T for 24 h and then exposed to 20–160 μM H2O2 for another 24 h. As shown in Fig. 8, H2O2 at concentrations of 40 μM and above caused significant decreases in cell viability in a concentration-dependent manner. Pretreatment of SH-SY5Y cells with D3T provided a marked protection against H2O2-induced cytotoxicity (Fig. 8). Notably, the cytotoxicity induced by 160 μM H2O2 was also significantly protected by D3T-pretreatment.
Figure 8.

Protective effects of D3T-pretreatment on H2O2-mediated cytotoxicity in SH-SY5Y cells. SH-SY5Y cells were pretreated with 100 μM D3T in 24-well culture plates for 24 h, followed by exposure to the indicated concentrations of H2O2 for another 24 h. Cell viability was detected using MTT reduction assay. Values represent mean ± S.E.M., n =4. *Significantly different from the respective control group.
Effects of D3T treatment on GSH content and NQO1 activity in primary human neurons
Because primary human neurons are considered to be more suitable for the study of the pathophysiology of neurodegenerative diseases including PD, we further examined if D3T could exert the same effects on primary human neurons as observed in the human SH-SY5Y neuroblastoma cells. As shown in Figs. 9A and B, incubation of the primary human neurons with 10–100 μM of D3T for 24 h also resulted in significant increases in cellular GSH content and NQO1 activity in a concentration-dependent fashion. Notably, a 20% induction of cellular GSH and a 40% induction of cellular NQO1 were observed after treatment of the primary human neurons with D3T at a concentration as little as 10 μM. The primary human neurons treated with 100 μM D3T also exhibited a significant increase in mitochondrial GSH content as compared to control (Fig. 10).
Figure 9.

Concentration-dependent induction of GSH and NQO1 by D3T in primary human neurons. Primary human neurons were incubated with the indicated concentrations of D3T for 24 h, followed by measurement of cellular GSH content and NQO1 activity. Values represent mean ± S.E.M., n = 4. *, significantly different from the respective control group.
Figure 10.
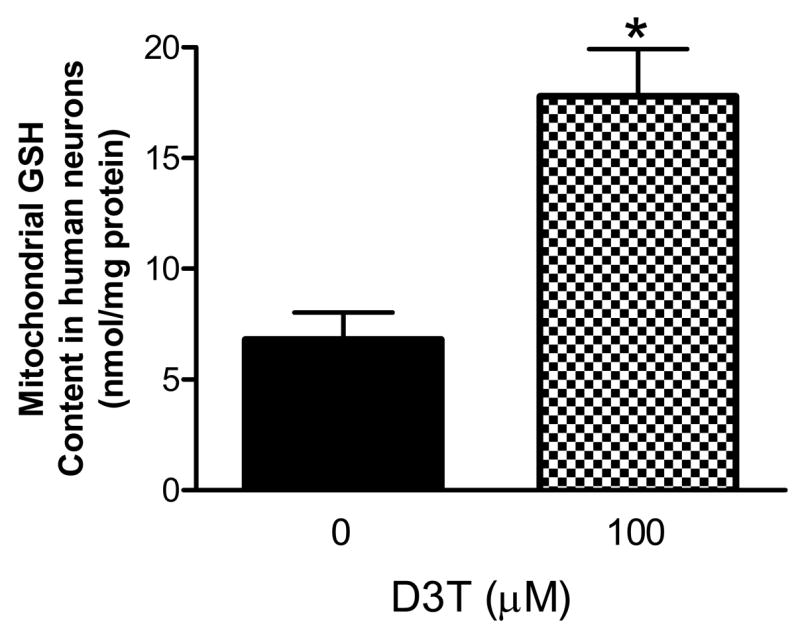
Effects of D3T treatment on mitochondrial GSH level in primary human neurons. Primary human neurons were incubated with the indicated concentrations of D3T for 24 h. The mitochondria were then immediately isolated for measurement of GSH content. Values represent means ± S.E.M., n = 4. *, significantly different from control.
Protective effects of D3T-pretreatment on 6-OHDA- or HNE-induced cytotoxicity in primary human neurons
The two well-known neurotoxiants, 6-OHDA and HNE were selected to further examine if the D3T-elevated cellular defenses in the primary human neurons could also lead to cytoprotection against the cytotoxicity elicited by these neurotoxic agents. To this end, the primary human neurons were pretreated with 100 μM D3T and then exposed to various concentrations of 6-OHDA or HNE. As shown in Fig. 11, pretreatment of the primary human neurons with D3T for 24 h afforded a significant protection against either 6-OHDA or HNE toxicity. It is important to note that the cytotoxicity elicited by 75 μM of 6-OHDA or 20 μM of HNE was still significantly protected by D3T-pretreatment (Fig. 11).
Figure 11.
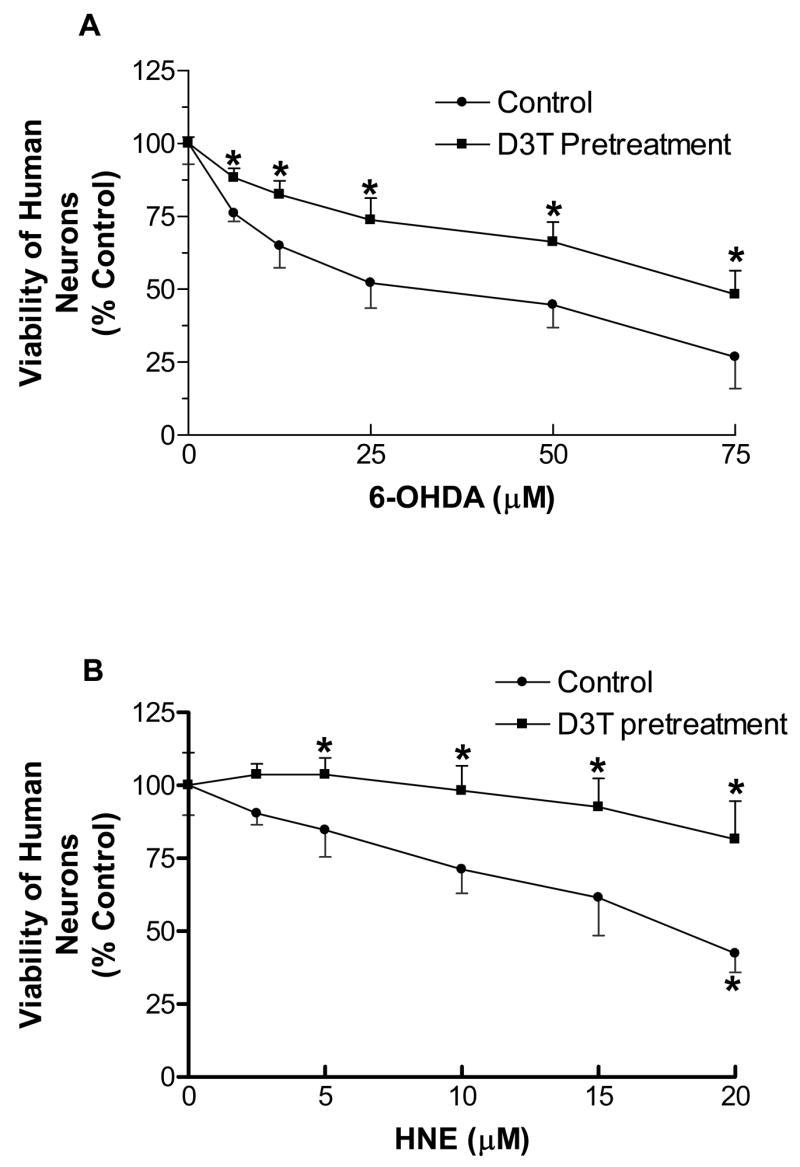
Protective effects of D3T-pretreatment on 6-OHDA (A)- or HNE (B)-mediated cytotoxicity in primary human neurons. Primary human neurons were pretreated with 100 μM D3T in 48-well culture plates for 24 h, followed by exposure to the indicated concentrations of 6-OHDA or HNE for another 24 h. Cell viability was detected using MTT reduction assay. Values represent mean ± S.E.M., n = 4. *Significantly different from the respective control group.
Discussion
PD has been related to oxygen free radical generation, which plays a pivotal role in neuronal cell death in substantia nigra. Substantia nigra is particularly susceptible to oxidative and electrophilic damage due to its high content of iron as well as relative deficiency in antioxidant defense system, especially GSH and GSH-related enzymes. In addition, dopamine itself can also induce oxidative/electrophilic stress via generation of ROS and electrophilic quinone molecules from the auto-oxidation process. Both oxidative stress and electrophilic quinone molecules have been implicated in destruction of dopaminergic neurons in the substantia nigra in PD (Munch et al., 1998). Studies over the past decade have demonstrated that a variety of cellular antioxidants and phase 2 enzymes, especially GSH and NQO1 can protect neuronal cells against oxidative and electrophilic insults (Perry and Yong, 1986; Siegel et al., 1997). In this context, the coordinated induction of endogenous GSH and NQO1 via the use of chemoprotective agents appears to be a promising strategy for protecting against the oxidative/electrophilic pathophysiological processes underlying PD.
Although it has been demonstrated that 1,2-dithiole-3-thiones, particularly D3T, are capable of inducing endogenous antioxidants and phase 2 enzymes in various cells and tissues (Kwak et al., 2001), careful studies on D3T-mediated induction of endogenous antioxidants and phase 2 enzymes in neuronal cells are lacking. The results of the present study demonstrated that incubation of human neuroblastoma SH-SY5Y cells with low micromolar concentrations of D3T resulted in significant induction of the cellular antioxidant GSH and phase 2 enzyme NQO1 in a concentration-dependent fashion (Fig. 1). However, the same D3T treatment of SH-SY5Y cells under the present experimental conditions failed to significantly induce other endogenous antioxidants and phase 2 enzymes, including SOD, catalase, GR, GPx, and GST (Table 1), indicating that in neuronal SH-SY5Y cells different antioxidants and phase 2 enzymes might be regulated via distinct signaling pathways. In this context, our previous studies have demonstrated that GSH and NQO1 are the two most inducible cellular defenses following treatment with various chemoprotectants and nutraceuticals, including D3T, resveratrol, and alpha-lipoic acid (Zhu et al., 2005; Cao et al., 2006; Jia et al., 2007).
Table 1.
Effects of D3T treatment on levels of SOD, catalase, GR, GPx, and GST in SH-SY5Y cells. SH-SY5Y cells were incubated with the indicated concentrations of D3T for 24 h, followed by measurement of SOD, catalase, GR, GPx and GST activities. Values represent mean ± S.E.M., n = 4. No significantly different from the respective control group.
| D3T (μM) | SOD (units/mg protein) | Catalase (μmol/min/mg protein) | GR (nmol/min/mg protein) | GPx (nmol/min/mg protein) | GST (nmol/min/mg protein) |
|---|---|---|---|---|---|
| 0 | 3.4 ± 0.1 | 8.2 ± 0.8 | 27.6 ± 0.7 | 19.3 ± 3.7 | 120.0 ± 8.4 |
| 10 | 4.1 ± 0.1 | 7.7 ± 0.5 | 30.7 ± 1.3 | 21.5 ± 4.1 | 124.6 ± 6.3 |
| 25 | 4.2 ± 0.1 | 7.0 ± 0.5 | 29.1 ± 1.8 | 24.8 ± 3.6 | 125.8 ± 5.5 |
| 50 | 4.1± 0.4 | 6.1 ± 0.4 | 30.2 ± 2.4 | 26 ± 3.6 | 126.6 ± 6.0 |
| 100 | 3.6 ± 0.4 | 5.8 ± 0.4 | 28.7 ± 2.5 | 23.1 ± 4.3 | 122.6 ± 4.3 |
To further investigate the molecular mechanisms involved in the induction of GSH and NQO1 by D3T, we measured the mRNA expression of GCLC, and NQO1 in SH-SY5Y cells following treatment with D3T. GCLC is a key subunit of GCL, the rate limiting enzyme in GSH biosynthesis (Anderson, 1998). Our results demonstrated that treatment of SH-SY5Y cells with D3T (100 μM) led to increases in the levels of GCLC and NQO1 mRNA (Figs. 2 and 3), suggesting that induction of GSH and NQO1 by D3T in SH-SY5Y cells appeared to occur via increased transcription of the respective genes. The exact signaling mechanism by which D3T mediates elevation of GSH and NQO1 in SH-SY5Y cells remains to be defined. Recently, the nuclear factor E2-related factor (Nrf2) has been reported to be a critical transcriptional activator for a variety of antioxidative and phase 2 genes, especially GCL and NQO1 in various types of tissues and cells (Zhu et al., 2005; Kobayashi and Yamamoto, 2006; Zhu et al., 2006). Whether such an Nrf2-dependent mechanism is also involved in D3T-induced elevation of GSH and NQO1 in neuronal cells warrants further investigation.
Another notable observation of this study was the marked induction of mitochondrial GSH content by D3T. It’s well established that in mammalian cells GSH is distributed in both cytoplasm and mitochondria. Due to lack of de nova GSH synthesis in mitochondria, it has been suggested that GSH is transported from the cytoplasm to the mitochondrial matrix via an ATP-dependent transporter located on the mitochondrial membrane (Fernandez-Checa et al., 1996). D3T treatment of SH-SY5Y cells caused a significant elevation of GSH content in mitochondria (Fig. 2), suggesting that the increased synthesis of GSH/GCL in cytoplasm also led to concurrent elevation of GSH in the mitochondrial compartment. The mitochondria are a critical intracellular target for ROS and electrophile-elicited neuronal cell injury (Beal, 2003) and damage to the mitochondria has been suggested to be an important factor in the pathogenesis of a range of neurological disorders, including PD. In this context, the observation of the potent induction of mitochondrial GSH content by D3T might be of crucial importance with regard to protection against neurocytotoxicity elicited by various neurotoxins, including those examined in the present study (Figs. 5–8).
The neurotoxicity of both dopamine and 6-OHDA has been attributed to the generation of ROS as well as the formation of electrophilic reactive metabolites, such as quinone molecules and semiquinone radicals (Smythies, 1999). NQO1, one of the extensively investigated phase 2 enzymes, has recently been demonstrated to play an important protective role in dopamine-induced oxidative stress (Ross, 2004). In this regard, NQO1 is found to catalyze the two-electron reduction of quinones and quinoid compounds to hydroquinones, using either NADH or NADPH as the electron donor (Ross, 2004). The two-electron reduction of redox-active quinones by NQO1 to hydroquinones bypasses the formation of semiquinone radicals, and thus limits the subsequent generation of ROS (Ross, 2004). Moreover, NQO1 is able to maintain the cellular levels of ubiquinol and vitamin E, two important biological antioxidants involved in the detoxification of ROS (Siegel et al., 1997; Ross, 2004). The unique role of NQO1 in detoxification of electrophilic quinone molecules and ROS suggests that this phase 2 enzyme may play an important part in protecting against dopaminergic neurodegeneration in PD patients. In this context, polymorphism of NQO1 has been suggested to be associated with an increased risk of developing PD (Fong et al., 2007). In addition to NQO1, GSH is also capable of reacting with quinone molecules as well as ROS to attenuate dopamine or 6-OHDA-induced cytotoxicity (Shimizu et al., 2002). Accordingly, the coordinated induction of the endogenous antioxidant GSH and phase 2 enzyme NQO1 by D3T appeared to be responsible, at least partially, for the increased resistance of D3T-pretreated SH-SY5Y cells to both dopamine and 6-OHDA-induced cytotoxicity (Figs. 5 and 6).
Our results also demonstrated that D3T-pretreatment led to significant cytoprotection against HNE toxicity in SH-SY5Y cells (Fig. 7). HNE is a major unsaturated aldehyde involved in the pathogenesis of PD (Selley, 1998). The presence of protein-bound HNE in vivo has been detected in the dopaminergic neurons in substantia nigra of PD patients (Yoritaka et al., 1996). It has been suggested that GSH plays an important role in the detoxification of reactive aldehydes, including HNE (Selley, 1998). In this regard, GSH is able to directly react with HNE to form a less reactive conjugate, and formation of such a less reactive GSH-conjugate is facilitated by GST (Selley, 1998). Manipulation of cellular GSH levels has been found to dramatically alter HNE toxicity in cardiovascular cells (Cao et al., 2003a; Cao et al., 2006). Thus, the remarkable induction of GSH by D3T in SH-SY5Y cells may account for the cytoprotective effects of D3T-pretreatment on HNE-induced cytotoxicity (Fig. 7).
In addition to providing cytoprotection against the above electrophlic neurotoxin-elicited cytotoxicity, D3T-pretreatment of SH-SY5Y cells also afforded significant protection against H2O2-induced toxicity (Fig. 8). Augmented formation of H2O2 occurs under various pathophysiological conditions, including neurodegeneration (Perry and Yong, 1986; Jenner, 1991; Jenner et al., 1992; Christen, 2000). H2O2 readily causes cytotoxicity in various types of cells including neurons via forming more potent oxidants, such as hydroxyl radicals, which cause oxidative modifications of cellular constitutes, leading to cell injury and death. While a number of antioxidants are involved in detoxification of H2O2, GSH is believed to be a major cellular nucleophile that reacts with H2O2, thereby preventing their attack on critical cellular targets (Kehrer, 1993; Grant et al., 1998). Thus, the potent induction of cellular GSH by D3T may largely contribute to the increased resistance of the D3T-pretreated SH-SY5Y cells to H2O2-mediated cytotoxicity (Fig. 8). In addition, induction of NQO1 may also indirectly contribute to D3T-mediated cytoprotection against H2O2 toxicity via maintaining cellular levels of ubiquinol and vitamin E. As stated above, ubiquinol and vitamin E are important cellular antioxidants in protecting against ROS-induced injury (Ross, 2004; Young et al., 2007).
Although human SH-SY5Y cells are a widely used in vitro model for the study of neurotoxicity and neuroprotection, these cells were originally derived from a human neuroblastoma and as such might respond differently from normal human neurons to neurotoxicant-elicited cytotoxicity as well as chemoprotectant-mediated neurocytoprotection. To further investigate the relevance of the above findings made with human SH-SY5Y neuroblastoma cells, we examined the effects of D3T on the primary human neurons. Our results clearly demonstrated for the first time that treatment of the primary human neurons with D3T also caused a significant increase in cellular NQO1 activity, and in the levels of total cellular as well as mitochondrial GSH, which was accompanied by increased resistance to cytotoxicity elicited by two well-known neurotoxicants, 6-OHDA and HNE (Figs. 9–11). These findings made with the primary human neurons indicate that both GSH and NQO1 in normal human neurons are well-responsive to D3T-mediated induction, and such induced cellular defenses are also protective against neurocytotoxicity. On the other hand, the above observations also suggest that human SH-SY5Y cells appear to be a valid in vitro model for the study of neurocytotoxicity and neurocytoprotection.
In summary, this study demonstrates for the first time that the endogenous antioxidant GSH and phase 2 enzyme NQO1 in cultured human SH-SY5Y neuroblastoma cells as well as primary human neurons can be induced by low micromolar concentrations of D3T, and that this chemically mediated upregulation of cellular defenses is accompanied by a markedly increased resistance to neuronal cell injury elicited by various neurotoxicants, including dopamine, 6-OHDA, HNE, or H2O2. The present study also for the first time demonstrates that D3T treatment of SH-SY5Y cells and primary human neurons results in increases of GSH levels in the mitochondrial compartment. In view of the crucial role of both cellular NQO1 and GSH, as well as mitochondrial GSH in detoxification of oxidative/electrophilic species generated by dopamine as well as other neurotoxins, coordinated induction of the above endogenous defenses by D3T might be a unique strategy for protecting against the oxidative and electrophlic pathophysiological processes underlying neurodegenerative disorders, particularly PD.
Materials and Methods
Chemicals and materials
D3T with a purity of 99.8% was generously provided by Dr. Mary Tanga at SRI International (Menlo Park, CA) and Dr. Linda Brady at National Institute of Mental Health (Bethesda, MD). GSH, oxidized glutathione (GSSG), yeast-derived glutathione reductase, 1-chloro-2,4-dinitrobenzene (CDNB), o-phthalaldehyde, 3-[4,5-dimethylthiazol-2-yl]-2,5-diphenyltetrazolium bromide (MTT), and bovine serum albumin (BSA) were from Sigma Chemical (St. Louis, MO). Dulbecco’s modified Eagle’s medium (DMEM), penicillin, streptomycin, fetal bovine serum (FBS), and Dulbecco’s phosphate buffered saline (PBS) were from Gibco-Invitrogen (Carlsbad, CA). Tissue culture flasks and 24-well tissue culture plates were from Corning (Corning, NY).
Cell culture
Human neuroblastoma SH-SY5Y cells (ATCC, Manassas, VA) were cultured in DMEM supplemented with 10% FBS, 100 U/ml penicillin, and 100 μg/ml streptomycin in 75 or 150 cm2 tissue culture flasks at 37°C in a humidified atmosphere of 5% CO2. The cells were fed every 3–4 days and subcultured once they reached 80–90% confluence. Primary human neurons were purchased from ScienCell Research Laboratories (San Diego, CA) and cultured according to the manufacturer’s protocol in a recommended neuronal medium (ScienCell).
Preparation of cell extract
The cells were collected and resuspended in ice-cold 50 mM potassium phosphate buffer, pH 7.4, containing 2 mM EDTA and 0.1% Triton X-100. The cells were sonicated, followed by centrifugation at 13,000 g for 10 min at 4°C to remove cell debris. The resulting supernatants were collected and the protein concentrations were measured using a Bio-Rad protein assay kit (Hercules, CA) with bovine serum albumin (BSA) as the standard.
Preparation of mitochondrial fraction
Mitochondria were isolated from the freshly harvested cells according to the method described previously (Li et al., 1999). Briefly, cells (1.5–2 × 10⁷ cells per sample) were washed once with PBS. The cell pellet was resuspended in 3 ml sucrose buffer (0.25 M sucrose, 10 mM Hepes, 1 mM EGTA and 0.5% BSA, pH 7.4), homogenized in a Dounce tissue grinder on ice. The homogenate was centrifuged at 1,500 g for 10 min at 4°C. The supernatant was collected and centrifuged at 10,000 g for 10 min at 4 °C. The resulting mitochondrial pellet was washed twice with sucrose buffer and then resuspended in ice-cold 50 mM potassium phosphate buffer, pH 7.4, containing 2 mM EDTA and 0.1% Triton X-100, followed by sonication to lyse the mitochondria. The protein concentrations of mitochondrial lysates were measured as above.
Assay for GSH content
Both total cellular and mitochondrial GSH was measured according to the o-phthalaldehyde-based fluorometric method, which is specific for determination of GSH at pH 8.0 (Hissin and Hilf, 1976; Cao et al., 2003b). Briefly, 10 μl of the sample was incubated with 12.5 μl of 25% metaphosphoric acid, and 37 μl of 0.1 M sodium phosphate buffer containing 5 mM EDTA, pH 8.0 at 4°C for 10 min. The samples were centrifuged at 13,000 g for 5 min at 4°C. The resulting supernatant (10 μl) was incubated with 0.1 ml of o-phthalaldehyde solution (0.1% in methanol) and 1.89 ml of the above phosphate buffer for 15 min at room temperature. Fluorescence intensity was then measured at an excitation wavelength of 350 nm and an emission wavelength of 420 nm. GSH content was calculated based on a GSH standard curve, and expressed as nmol of GSH per mg of either total cellular protein or mitochondrial protein.
Assay for NQO1 activity
Cellular NQO1 activity was measured according to the procedures described previously (Benson et al., 1980). Briefly, the reaction mix contained in 50 mM Tris–HCl, pH 7.5, 0.08% Triton X-100,0.25 mM NADPH, and 80 μM of 2,6-dichloroindophenol (DCIP) in the presence or absence of 60 μM dicumarol. To an assay cuvette, 0.695 ml of reaction mix was added. The reaction was started by adding 5 μl of sample and the reduction of DCIP was monitored at 600 nm, 25°C for 3 min. The dicumarol-inhibitable NQO1 activity was calculated using the extinction coefficient of 21.0 mM−1 cm−1 and expressed as nmol of DCIP reduced per min per mg of cellular protein.
Assay for SOD activity
Cellular SOD activity was measured according to the procedures described before (Zhu et al., 2005). In brief, the reaction mix contained in 50 mM potassium phosphate buffer, pH 7.8, 1.33 mM diethylenetriaminepentaacetic acid, 1.0 U/ml catalase, 70 μM nitroblue tetrazolium, 0.2 mM xanthine, 50 μM bathocuproinedisulfonic acid, and 0.13 mg/ml bovine serum albumin. 0.8 ml of the reaction mix was added to each cuvette, followed by addition of 100 μl of sample. The cuvettes were pre-warmed at 37°C for 3 min. The reaction was then started by adding 100 μl of xanthine oxidase (0.1–0.2 U/ml). The formation of formazan blue was measured at 560 nm, 37°C for 5 min. Cellular SOD activity was calculated using a concurrently run SOD standard curve, and expressed as units per mg of cellular protein.
Assay for catalase activity
The method described by Aebi (Aebi, 1984) was followed to measure the cellular catalase activity. In brief, to a quartz cuvette, 0.65 ml of 50 mM potassium phosphate buffer and 50 μl of sample were added. The reaction was started by adding 0.3 ml of 30 mM H2O2. The decomposition of H2O2 was monitored at 240 nm, 25°C for 2 min. The catalase activity was expressed as μmol of H2O2 consumed per min per mg of cellular protein.
Assay for GR activity
The method described before (Wheeler et al., 1990) was used to measure the activity of cellular GR. Briefly, to an assay cuvette containing 0.465 ml of 50 mM potassium phosphate buffer (pH 7.0) and 1 mM EDTA, 15 μl of sample and 60 μl of 20 mM GSSG were added. The cuvettes were pre-warmed at 37°C for 3 min. The reaction was started by adding 60 μl of 1.5 mM NADPH. The subsequent consumption of NADPH was monitored at 340 nm, 37°C for 5 min. GR activity was calculated using the extinction coefficient of 6.22 mM−1cm−1, and expressed as nmol of NADPH consumed per min per mg of total cellular protein.
Assay for GPx activity
Cellular GPx activity was measured according to the method of (Flohe and Gunzler, 1984). In brief, to an assay cuvette containing 0.345 ml of 50 mM potassium phosphate (pH 7.0), 1 mM EDTA and 2 mM sodium azide, 15 μl of sample, 60 μl of 10 mM GSH, 60 μl of glutathione reductase (2.4 U/ml) and 60 μl of 1.5 mM NADPH were added. The cuvette was pre-incubated at 37°C for 3 min. After addition of 60 μl of 2 mM H2O2, the rate of NADPH utilization was measured at 340 nm, 37°C for 5 min. GPx activity was calculated using the extinction coefficient of 6.22 mM−1cm−1, and expressed as nmol of NADPH consumed per min per mg of cellular protein.
Assay for GST activity
Cellular GST activity was measured according to the procedures described by Habig et al. (Habig et al., 1974). Briefly, the reaction mix contained 1 mM GSH, 1 mM 1-chloro-2,4-dinitrobenzene (CDNB) and 3 mg/ml of BSA in 0.1 M sodium phosphate buffer, pH 6.5. 0.59 ml of the above reaction mix was added to each cuvette. The reaction was started by adding 10 μl of sample, and the rate of formation of CDNB-GSH conjugate was measured at 340 nm, 25°C for 5 min. GST activity was calculated using the extinction coefficient of 9.6 mM−1cm−1, and expressed as nmol of CDNB-GSH conjugate formed per min per mg of cellular protein.
RT-PCR analysis of mRNA expression
Total RNA from SH-SY5Y cells was isolated using Trizol reagent (Invitrogen, Carlsbad, CA). cDNA synthesis and subsequent PCR reaction were performed using Superscript II One-Step system (Invitrogen) according to manufacturer’s instruction. The cycling conditions for RT-PCR were the following: 50°C for 30 min (reverse transcription), 94°C for 2 min (pre-denaturation), followed by 25 cycles of PCR amplification process including denaturing at 94°C for 15 s, annealing at 57°C for 30 s, and extension at 72°C for 45 s, and by 1 cycle of final extension at 72°C for 10 min. PCR products were separated by 1% agarose gel electrophoresis. Gels were stained with ethidium bromide and then photographed under ultraviolet light. The DNA bands were quantified by Gel-Pro Analyzer version 4.5 (MediaCybernetics, Silver Spring, MD). In the present study, a standard curve for GCLC and NQO1 mRNA using 25, 50, 100 and 200 ng of total RNA was included in each assay so as to reliably determine changes in mRNA levels (Cao et al., 2006; Zhu et al., 2007).
Assay for cell viability
Cell viability was determined by a slightly modified MTT reduction assay, as described before (Cao et al., 2003b). In brief, cells were plated into 24-well tissue culture plates. After incubation of the cells with the neurotoxicants in DMEM supplemented with 0.5% FBS at 37°C for 24 h, media were discarded, followed by addition to each well of 0.5 ml of fresh medium containing MTT (0.2 mg/ml). The plates were incubated at 37°C for another 2 h. Then, media were completely removed followed by addition to each well of 0.2 ml of mix of dimethyl sulfoxide, isopropanol and deionized water (1:4:5) to solubilize the formazan crystals. The amount of the dissolved formazan was then detected at 570 nm.
Statistical analysis
All data are expressed as means ± S.E.M. Differences between mean values of multiple groups were analyzed by one-way analysis of variance followed by Student-Newman-Keuls test. Differences between 2 groups were analyzed by Student t-test. Statistical significance was considered at p < 0.05.
Acknowledgments
This work was supported in part by NIH grant HL71190 (Y.L.).
Abbreviations
- BSA
bovine serum albumin
- CDNB
1-chloro-2,3-dinitrobenzene
- D3T
3H-1,2-dithiole-3-thione
- DCIP
2,6-dichloroindophenol
- FBS
fetal bovine serum
- GAPDH
glyceraldehyde-3-phosphate dehydrogenase
- GCLC
γ-glutamylcysteine ligase catalytic subunit
- GPx
glutathione peroxidase
- GR
glutathione reductase
- GSH
reduced glutathione
- GSSG
oxidized form of glutathione
- GST
glutathione S-transferase
- HNE
4-hydroxy-2-nonenal
- MTT
3-[4,5-dimethylthiazol-2-yl]-2,5-diphenyltetrazolium
- NQO1, NAD(P)H
quinone oxidoreductase 1
- 6-OHDA
6-hydroydopamine
- PD
Parkinson’s disease
- PBS
phosphate buffered saline
- ROS
reactive oxygen species
- SOD
superoxide dismutase
Footnotes
Publisher's Disclaimer: This is a PDF file of an unedited manuscript that has been accepted for publication. As a service to our customers we are providing this early version of the manuscript. The manuscript will undergo copyediting, typesetting, and review of the resulting proof before it is published in its final citable form. Please note that during the production process errors may be discovered which could affect the content, and all legal disclaimers that apply to the journal pertain.
References
- Aebi H. Catalase in vitro. Methods Enzymol. 1984;105:121–126. doi: 10.1016/s0076-6879(84)05016-3. [DOI] [PubMed] [Google Scholar]
- Ahlskog JE. Parkinson’s disease: new treatment strategies. Compr Ther. 1990;16:41–46. [PubMed] [Google Scholar]
- Alam ZI, Daniel SE, Lees AJ, Marsden DC, Jenner P, Halliwell B. A generalised increase in protein carbonyls in the brain in Parkinson’s but not incidental Lewy body disease. J Neurochem. 1997a;69:1326–1329. doi: 10.1046/j.1471-4159.1997.69031326.x. [DOI] [PubMed] [Google Scholar]
- Alam ZI, Jenner A, Daniel SE, Lees AJ, Cairns N, Marsden CD, Jenner P, Halliwell B. Oxidative DNA damage in the parkinsonian brain: an apparent selective increase in 8-hydroxyguanine levels in substantia nigra. J Neurochem. 1997b;69:1196–1203. doi: 10.1046/j.1471-4159.1997.69031196.x. [DOI] [PubMed] [Google Scholar]
- Anderson ME. Glutathione: an overview of biosynthesis and modulation. Chem Biol Interact. 1998;111–112:1–14. doi: 10.1016/s0009-2797(97)00146-4. [DOI] [PubMed] [Google Scholar]
- Beal MF. Mitochondria, oxidative damage, and inflammation in Parkinson’s disease. Ann N Y Acad Sci. 2003;991:120–131. doi: 10.1111/j.1749-6632.2003.tb07470.x. [DOI] [PubMed] [Google Scholar]
- Benson AM, Hunkeler MJ, Talalay P. Increase of NAD(P)H:quinone reductase by dietary antioxidants: possible role in protection against carcinogenesis and toxicity. Proc Natl Acad Sci U S A. 1980;77:5216–5220. doi: 10.1073/pnas.77.9.5216. [DOI] [PMC free article] [PubMed] [Google Scholar]
- Berman SB, Hastings TG. Dopamine oxidation alters mitochondrial respiration and induces permeability transition in brain mitochondria: implications for Parkinson’s disease. J Neurochem. 1999;73:1127–1137. doi: 10.1046/j.1471-4159.1999.0731127.x. [DOI] [PubMed] [Google Scholar]
- Cao Z, Hardej D, Trombetta LD, Li Y. The role of chemically induced glutathione and glutathione S-transferase in protecting against 4-hydroxy-2-nonenal-mediated cytotoxicity in vascular smooth muscle cells. Cardiovasc Toxicol. 2003a;3:165–177. doi: 10.1385/ct:3:2:165. [DOI] [PubMed] [Google Scholar]
- Cao Z, Hardej D, Trombetta LD, Trush MA, Li Y. Induction of cellular glutathione and glutathione S-transferase by 3H-1,2-dithiole-3-thione in rat aortic smooth muscle A10 cells: protection against acrolein-induced toxicity. Atherosclerosis. 2003b;166:291–301. doi: 10.1016/s0021-9150(02)00331-3. [DOI] [PubMed] [Google Scholar]
- Cao Z, Zhu H, Zhang L, Zhao X, Zweier JL, Li Y. Antioxidants and phase 2 enzymes in cardiomyocytes: Chemical inducibility and chemoprotection against oxidant and simulated ischemia-reperfusion injury. Exp Biol Med (Maywood) 2006;231:1353–1364. doi: 10.1177/153537020623100809. [DOI] [PubMed] [Google Scholar]
- Christen Y. Oxidative stress and Alzheimer disease. Am J Clin Nutr. 2000;71:621S–629S. doi: 10.1093/ajcn/71.2.621s. [DOI] [PubMed] [Google Scholar]
- Ebadi M, Srinivasan SK, Baxi MD. Oxidative stress and antioxidant therapy in Parkinson’s disease. Prog Neurobiol. 1996;48:1–19. doi: 10.1016/0301-0082(95)00029-1. [DOI] [PubMed] [Google Scholar]
- Fernandez-Checa JC, Yi JR, Garcia Ruiz C, Ookhtens M, Kaplowitz N. Plasma membrane and mitochondrial transport of hepatic reduced glutathione. Semin Liver Dis. 1996;16:147–158. doi: 10.1055/s-2007-1007228. [DOI] [PubMed] [Google Scholar]
- Flohe L, Gunzler WA. Assays of glutathione peroxidase. Methods Enzymol. 1984;105:114–121. doi: 10.1016/s0076-6879(84)05015-1. [DOI] [PubMed] [Google Scholar]
- Fong CS, Wu RM, Shieh JC, Chao YT, Fu YP, Kuao CL, Cheng CW. Pesticide exposure on southwestern Taiwanese with MnSOD and NQO1 polymorphisms is associated with increased risk of Parkinson’s disease. Clin Chim Acta. 2007;378:136–141. doi: 10.1016/j.cca.2006.11.006. [DOI] [PubMed] [Google Scholar]
- Grant CM, Perrone G, Dawes IW. Glutathione and catalase provide overlapping defenses for protection against hydrogen peroxide in the yeast Saccharomyces cerevisiae. Biochem Biophys Res Commun. 1998;253:893–898. doi: 10.1006/bbrc.1998.9864. [DOI] [PubMed] [Google Scholar]
- Habig WH, Pabst MJ, Jakoby WB. Glutathione S-transferases. The first enzymatic step in mercapturic acid formation. J Biol Chem. 1974;249:7130–7139. [PubMed] [Google Scholar]
- Hissin PJ, Hilf R. A fluorometric method for determination of oxidized and reduced glutathione in tissues. Anal Biochem. 1976;74:214–226. doi: 10.1016/0003-2697(76)90326-2. [DOI] [PubMed] [Google Scholar]
- Jenner P. Oxidative stress as a cause of Parkinson’s disease. Acta Neurol Scand Suppl. 1991;136:6–15. doi: 10.1111/j.1600-0404.1991.tb05013.x. [DOI] [PubMed] [Google Scholar]
- Jenner P, Dexter DT, Sian J, Schapira AH, Marsden CD. Oxidative stress as a cause of nigral cell death in Parkinson’s disease and incidental Lewy body disease. The Royal Kings and Queens Parkinson’s Disease Research Group. Ann Neurol. 1992;32(Suppl):S82–87. doi: 10.1002/ana.410320714. [DOI] [PubMed] [Google Scholar]
- Jia Z, Hallur S, Zhu H, Li Y, Misra HP. Potent upregulation of glutathione and NAD(P)H:quinone oxidoreductase 1 by alpha-lipoic acid in human neuroblastoma SH-SY5Y cells: Protection against neurotoxicant-elicited cytotoxicity. Neurochem Res. 2007 doi: 10.1007/s11064-007-9496-5. in press. [DOI] [PubMed] [Google Scholar]
- Kehrer JP. Free radicals as mediators of tissue injury and disease. Crit Rev Toxicol. 1993;23:21–48. doi: 10.3109/10408449309104073. [DOI] [PubMed] [Google Scholar]
- Kobayashi M, Yamamoto M. Nrf2-Keap1 regulation of cellular defense mechanisms against electrophiles and reactive oxygen species. Adv Enzyme Regul. 2006;46:113–140. doi: 10.1016/j.advenzreg.2006.01.007. [DOI] [PubMed] [Google Scholar]
- Korytowski W, Sarna T, Zar ba M. Antioxidant action of neuromelanin: the mechanism of inhibitory effect on lipid peroxidation. Arch Biochem Biophys. 1995;319:142–148. doi: 10.1006/abbi.1995.1276. [DOI] [PubMed] [Google Scholar]
- Kwak MK, Egner PA, Dolan PM, Ramos-Gomez M, Groopman JD, Itoh K, Yamamoto M, Kensler TW. Role of phase 2 enzyme induction in chemoprotection by dithiolethiones. Mutat Res. 2001;480–481:305–315. doi: 10.1016/s0027-5107(01)00190-7. [DOI] [PubMed] [Google Scholar]
- Li Y, Zhu H, Trush MA. Detection of mitochondria-derived reactive oxygen species production by the chemilumigenic probes lucigenin and luminol. Biochim Biophys Acta. 1999;1428:1–12. doi: 10.1016/s0304-4165(99)00040-9. [DOI] [PubMed] [Google Scholar]
- Merad-Boudia M, Nicole A, Santiard-Baron D, Saille C, Ceballos-Picot I. Mitochondrial impairment as an early event in the process of apoptosis induced by glutathione depletion in neuronal cells: relevance to Parkinson’s disease. Biochem Pharmacol. 1998;56:645–655. doi: 10.1016/s0006-2952(97)00647-3. [DOI] [PubMed] [Google Scholar]
- Munch G, Gerlach M, Sian J, Wong A, Riederer P. Advanced glycation end products in neurodegeneration: more than early markers of oxidative stress? Ann Neurol. 1998;44:S85–88. doi: 10.1002/ana.410440713. [DOI] [PubMed] [Google Scholar]
- Peng X, Li Y. Induction of cellular glutathione-linked enzymes and catalase by the unique chemoprotective agent, 3H-1,2-dithiole-3-thione in rat cardiomyocytes affords protection against oxidative cell injury. Pharmacol Res. 2002;45:491–497. doi: 10.1006/phrs.2002.0991. [DOI] [PubMed] [Google Scholar]
- Perry TL, Godin DV, Hansen S. Parkinson’s disease: a disorder due to nigral glutathione deficiency? Neurosci Lett. 1982;33:305–310. doi: 10.1016/0304-3940(82)90390-1. [DOI] [PubMed] [Google Scholar]
- Perry TL, Yong VW. Idiopathic Parkinson’s disease, progressive supranuclear palsy and glutathione metabolism in the substantia nigra of patients. Neurosci Lett. 1986;67:269–274. doi: 10.1016/0304-3940(86)90320-4. [DOI] [PubMed] [Google Scholar]
- Ratnam DV, Ankola DD, Bhardwaj V, Sahana DK, Kumar MN. Role of antioxidants in prophylaxis and therapy: A pharmaceutical perspective. J Control Release. 2006;113:189–207. doi: 10.1016/j.jconrel.2006.04.015. [DOI] [PubMed] [Google Scholar]
- Ross D. Quinone reductases multitasking in the metabolic world. Drug Metab Rev. 2004;36:639–654. doi: 10.1081/dmr-200033465. [DOI] [PubMed] [Google Scholar]
- Ross D, Kepa JK, Winski SL, Beall HD, Anwar A, Siegel D. NAD(P)H:quinone oxidoreductase 1 (NQO1): chemoprotection, bioactivation, gene regulation and genetic polymorphisms. Chem Biol Interact. 2000;129:77–97. doi: 10.1016/s0009-2797(00)00199-x. [DOI] [PubMed] [Google Scholar]
- Sechi G, Deledda MG, Bua G, Satta WM, Deiana GA, Pes GM, Rosati G. Reduced intravenous glutathione in the treatment of early Parkinson’s disease. Prog Neuropsychopharmacol Biol Psychiatry. 1996;20:1159–1170. doi: 10.1016/s0278-5846(96)00103-0. [DOI] [PubMed] [Google Scholar]
- Selley ML. (E)-4-hydroxy-2-nonenal may be involved in the pathogenesis of Parkinson’s disease. Free Radic Biol Med. 1998;25:169–174. doi: 10.1016/s0891-5849(98)00021-5. [DOI] [PubMed] [Google Scholar]
- Shimizu E, Hashimoto K, Komatsu N, Iyo M. Roles of endogenous glutathione levels on 6-hydroxydopamine-induced apoptotic neuronal cell death in human neuroblastoma SK-N-SH cells. Neuropharmacology. 2002;43:434–443. doi: 10.1016/s0028-3908(02)00108-9. [DOI] [PubMed] [Google Scholar]
- Siegel D, Bolton EM, Burr JA, Liebler DC, Ross D. The reduction of alpha-tocopherolquinone by human NAD(P)H: quinone oxidoreductase: the role of alpha-tocopherolhydroquinone as a cellular antioxidant. Mol Pharmacol. 1997;52:300–305. doi: 10.1124/mol.52.2.300. [DOI] [PubMed] [Google Scholar]
- Siegel D, Gustafson DL, Dehn DL, Han JY, Boonchoong P, Berliner LJ, Ross D. NAD(P)H:quinone oxidoreductase 1: role as a superoxide scavenger. Mol Pharmacol. 2004;65:1238–1247. doi: 10.1124/mol.65.5.1238. [DOI] [PubMed] [Google Scholar]
- Smythies J. The neurotoxicity of glutamate, dopamine, iron and reactive oxygen species: functional interrelationships in health and disease: a review-discussion. Neurotox Res. 1999;1:27–39. doi: 10.1007/BF03033337. [DOI] [PubMed] [Google Scholar]
- Sofic E, Lange KW, Jellinger K, Riederer P. Reduced and oxidized glutathione in the substantia nigra of patients with Parkinson’s disease. Neurosci Lett. 1992;142:128–130. doi: 10.1016/0304-3940(92)90355-b. [DOI] [PubMed] [Google Scholar]
- Spencer JP, Jenner P, Daniel SE, Lees AJ, Marsden DC, Halliwell B. Conjugates of catecholamines with cysteine and GSH in Parkinson’s disease: possible mechanisms of formation involving reactive oxygen species. J Neurochem. 1998;71:2112–2122. doi: 10.1046/j.1471-4159.1998.71052112.x. [DOI] [PubMed] [Google Scholar]
- Spencer JP, Jenner P, Halliwell B. Superoxide-dependent depletion of reduced glutathione by L-DOPA and dopamine. Relevance to Parkinson’s disease. Neuroreport. 1995;6:1480–1484. doi: 10.1097/00001756-199507310-00004. [DOI] [PubMed] [Google Scholar]
- Spina MB, Cohen G. Dopamine turnover and glutathione oxidation: implications for Parkinson disease. Proc Natl Acad Sci U S A. 1989;86:1398–1400. doi: 10.1073/pnas.86.4.1398. [DOI] [PMC free article] [PubMed] [Google Scholar]
- Storey KB. Oxidative stress: animal adaptations in nature. Braz J Med Biol Res. 1996;29:1715–1733. [PubMed] [Google Scholar]
- Volkel W, Sicilia T, Pahler A, Gsell W, Tatschner T, Jellinger K, Leblhuber F, Riederer P, Lutz WK, Gotz ME. Increased brain levels of 4-hydroxy-2-nonenal glutathione conjugates in severe Alzheimer’s disease. Neurochem Int. 2006;48:679–686. doi: 10.1016/j.neuint.2005.12.003. [DOI] [PubMed] [Google Scholar]
- Wheeler CR, Salzman JA, Elsayed NM, Omaye ST, Korte DW., Jr Automated assays for superoxide dismutase, catalase, glutathione peroxidase, and glutathione reductase activity. Anal Biochem. 1990;184:193–199. doi: 10.1016/0003-2697(90)90668-y. [DOI] [PubMed] [Google Scholar]
- Yoritaka A, Hattori N, Uchida K, Tanaka M, Stadtman ER, Mizuno Y. Immunohistochemical detection of 4-hydroxynonenal protein adducts in Parkinson disease. Proc Natl Acad Sci U S A. 1996;93:2696–2701. doi: 10.1073/pnas.93.7.2696. [DOI] [PMC free article] [PubMed] [Google Scholar]
- Young AJ, Johnson S, Steffens DC, Doraiswamy PM. Coenzyme Q10: a review of its promise as a neuroprotectant. CNS Spectr. 2007;12:62–68. doi: 10.1017/s1092852900020538. [DOI] [PubMed] [Google Scholar]
- Zafar KS, Inayat-Hussain SH, Siegel D, Bao A, Shieh B, Ross D. Overexpression of NQO1 protects human SK-N-MC neuroblastoma cells against dopamine-induced cell death. Toxicol Lett. 2006;166:261–267. doi: 10.1016/j.toxlet.2006.07.340. [DOI] [PubMed] [Google Scholar]
- Zhu H, Itoh K, Yamamoto M, Zweier JL, Li Y. Role of Nrf2 signaling in regulation of antioxidants and phase 2 enzymes in cardiac fibroblasts: protection against reactive oxygen and nitrogen species-induced cell injury. FEBS Lett. 2005;579:3029–3036. doi: 10.1016/j.febslet.2005.04.058. [DOI] [PubMed] [Google Scholar]
- Zhu H, Zhang L, Itoh K, Yamamoto M, Ross D, Trush MA, Zweier JL, Li Y. Nrf2 controls bone marrow stromal cell susceptibility to oxidative and electrophilic stress. Free Radic Biol Med. 2006;41:132–143. doi: 10.1016/j.freeradbiomed.2006.03.020. [DOI] [PubMed] [Google Scholar]
- Zhu H, Zhang L, Trush MA, Li Y. Upregulation of endogenous glutathione system by 3H-1,2-dithiole-3-thione in pancreatic RINm5F beta-cells as a novel strategy for protecting against oxidative beta-cell injury. Free Radic Res. 2007;41:242–250. doi: 10.1080/10715760601009586. [DOI] [PubMed] [Google Scholar]