

Summary
The entorhinal cortex (EC) provides the predominant excitatory drive to the hippocampal CA1 and subicular neurons in chronic epilepsy. Discerning the mechanisms underlying signal integration within EC neurons is essential for understanding network excitability alterations involving the hippocampus during epilepsy. Twenty-four hours following a single seizure episode when there were no behavioral or electrographic seizures, we found enhanced spontaneous activity still present in the rat EC in vivo and in vitro. The increased excitability was accompanied by a profound reduction in Ih in EC layer III neurons and a significant decline in HCN1 and HCN2 subunits that encode for h channels. Consequently, dendritic excitability was enhanced, resulting in increased neuronal firing despite hyperpolarized membrane potentials. The loss of Ih and the increased neuronal excitability persisted for 1 week following seizures. Our results suggest that dendritic Ih plays an important role in determining the excitability of EC layer III neurons and their associated neural networks.
Introduction
Temporal lobe epilepsy (TLE) is one of the most common adult human epileptic disorders (Engel, 1996). There is strong evidence to indicate that the entorhinal cortex (EC) plays a role in the induction and maintenance of TLE (for example, see Spencer and Spencer [1994]). The EC layer III pyramidal neurons, in particular, have been implicated in epileptogenesis (Avoli et al., 2002; Barbarosie et al., 2000; Du et al., 1993, 1995; Wu and Leung, 2003). The EC layer III consists of a high density of pyramidal neurons (Dickson et al., 1997; Gloveli et al., 1997; van der Linden and Lopes da Silva, 1998), the axons of which form the temporoammonic (TA) pathway and synapse onto the distal dendrites of pyramidal neurons in the CA1 and subiculum (Witter et al., 2000). In addition to the schaffer collateral (SC) pathway, the TA pathway also has a major influence on the excitability of CA1 pyramidal neurons under both physiological and pathological conditions (Avoli et al., 2002; Barbarosie et al., 2000; Colbert and Levy, 1992; Doller and Weight, 1982; Dvorak-Carbone and Schuman, 1999; Empson and Heinemann, 1995; Leung et al., 1995; Remondes and Schuman, 2002; Wu and Leung, 2003; Yeckel and Berger, 1995). With the onset of epilepsy, CA3 neurons are lost, thus disrupting the SC pathway to the CA1 pyramids (Ben-Ari and Cossart, 2000). Under these conditions, the TA pathway has been suggested to provide the major excitatory drive to the principal cells of the CA1 region (Avoli et al., 2002; Barbarosie et al., 2000; Wu and Leung, 2003).
Despite the importance of the TA pathway, relatively little is known about the integration and propagation of synaptic signals within EC layer III neurons under physiological or pathophysiological conditions. Previous work has shown that the somatic membrane properties of these neurons are similar to those of regular firing neocortical pyramidal neurons (Dickson et al., 1997; Gloveli et al., 1997; van der Linden and Lopes da Silva, 1998), but the dendrites remain unexplored. Most synaptic inputs are onto dendrites, which possess a variety of voltage-gated ion channels that can modulate the integration, propagation, and plasticity of synaptic signals and ultimately the firing rate of neurons (Magee, 2000). It is essential to understand the alterations in the intrinsic membrane properties of these neurons that might occur following seizures as this could influence the integration of synaptic signals, the firing rates of neurons, and, consequently, the input to the hippocampus via the TA pathway.
A commonly used animal preparation for studying temporal lobe epilepsy is the so-called kainate model (Dudek et al., 2002; White, 2002). In this model, a single episode of continuous seizures is induced by the administration of kainic acid and terminated using sodium pentobarbital (SP). Following a 2–4 week period after the termination of the kainic acid-induced seizures, the animals develop a type of chronic temporal lobe epilepsy that mimics the prominent clinical and pathological features of the human disorder (Dudek et al., 2002; White, 2002). One of the advantages of utilizing this particular model is that, like the human disorder, during the 2–4 week period (known as the “latent” period), the animals experience no behavioral seizures and they appear normal (Dudek et al., 2002; White, 2002). Although numerous studies have identified the morphological, biochemical, and network modifications present during chronic epilepsy, few studies have addressed the changes in neuronal intrinsic membrane properties that might occur during the latent period. It is crucial to understand the on-going variations at the cellular, molecular, and network levels during this period because these changes are likely to lead to the network reorganizations associated with chronic temporal lobe epilepsy (Ben-Ari, 2001; Dudek et al., 2002). Understanding these changes might also be important in identifying therapeutic targets for the prevention of chronic epilepsy (Arzimanoglou et al., 2002; Herman, 2002). Given that EC layer III pyramidal neurons give rise to the TA pathway and are thought to provide the major excitatory drive to CA1 neurons during chronic epilepsy (Avoli et al., 2002; Barbarosie et al., 2000; Wu and Leung, 2003), we investigated possible variations in intrinsic membrane properties and excitability of EC layer III pyramidal neurons 24 hr and 1 week (time points early in the latent period) following a single episode of seizures.
Our results demonstrate that the excitability of EC layer III pyramidal neurons is enhanced 24 hr after seizures both in vivo and in vitro. The enhanced excitability is principally due to a reduction in dendritic Ih as determined by a number of different techniques. This decrease in dendritic Ih persisted for at least 1 week following the seizures. Our results suggest that Ih plasticity in the EC may be important for the initial steps leading to the development of chronic epilepsy in these animals, and Ih may thus be a novel therapeutic target for the prevention of the disorder.
Results
Behavioral seizure activity was induced in male adult rats by the administration of a single dose of kainic acid and scored according to the Racine scale (Racine, 1972). Within 2 hr of the kainic acid administration, class V seizures were observed. Racine class V seizures correspond to electrographic status epilepticus (SE), or continuous seizures (data not shown; A.E.A. and X.L., unpublished data). One hour after onset of class V seizures (referred to as “SE” hereafter), the anticonvulsant sodium pentobarbital (SP) was administered to terminate the seizures. All experiments were done at two time points: 24 hr and 1 week after the termination of seizures. These two time points represent the early and middle epics during the latent period. Control groups included rats treated with either vehicle (saline) only or SP only 24 hr or 1 week prior.
This particular seizure model was utilized because it has been shown that under these conditions there is minimal EC layer III neuronal cell loss (Du et al., 1995; Wu and Leung, 2003). Specifically, these studies demonstrated that EC layer III cell loss induced by kainic acid administration was prevented if the SE was terminated by either SP or valium. We also performed Nissl staining of EC sections from animals treated with kainic acid and SP either 24 hr or 1 week prior and the appropriate controls (animals treated with SP only either 24 hr or 1 week previously) and confirmed that there is no obvious neuronal cell loss in the EC up to 1 week following SE induction (Supplemental Figure S1 [http://www.neuron.org/cgi/content/full/44/3/495/DC1/]).
Enhanced Spontaneous Activity of the EC In Vivo and In Vitro
No behavioral seizures were noted in any of the study groups at the 24 hr or 1 week time point. To test whether there was enhanced excitability of the EC in vivo, we performed electroencephalographic (EEG) recordings. Depth electrodes were implanted stereotaxically within the EC, and the EEG recordings from this region demonstrated interictal spikes but no electrographic seizures in the 24 hr SE group (n = 4; Figure 1A). The interictal spike frequency in the 24 hr SE group ranged from 3 to 18 spikes/min (n = 3). There was no epileptiform activity in animals treated with SP only 24 hr prior (n = 4; Figure 1A).
Figure 1. In Vivo and In Vitro Spontaneous Activity in Control and SE Neurons.

(A) Depth electroencephalographic (EEG) recordings from the left (L) and right (R) EC in rats induced with SE 24 hr prior and those treated with SP only 24 hr prior (control). Recordings from SE animals showed that there were recurrent interictal spike discharges in the EC (examples indicated by arrows, lower two traces). No spike discharges were recorded in control animals (upper two traces). The scale shown in (Aii) also applies to (Ai). (Bi) An example of a typical EC layer III pyramidal neuron. (Bii) An example recording of the spontaneous activity recorded from a control neuron. The hippocampal-entorhinal slices were obtained from 24 hr SP-only treated rats. The cell was held at its resting membrane potential (RMP; −69 mV). (Biii) Example trace of spontaneous activity recorded from a 24 hr SE neuron. Note that the RMP of the SE neuron is substantially more hyperpolarized than the control (−75 mV). Despite this, several short bursts of spikes (<2 s long) were observed together with a longer burst (>10 s). The longer burst is shown in an expanded time scale. Within the longer burst, several short bursts of interictal-like discharges are usually present. Each one of the interictal-like events typically has several EPSPs that have summated and resulted in the firing of a couple of action potentials. Both traces shown in (Bii) and (Biii) have been obtained continuously over a period of 10 min at a sampling frequency of 10 kHz. The scale shown in the top trace of (Biii) also applies to (Bii).
To investigate whether spontaneous activity was present in EC layer III pyramidal neurons specifically, we obtained somatic whole-cell current clamp recordings from these neurons in hippocampal-entorhinal slices. EC layer III pyramidal neurons were identified visually using differential interference optics. The typical morphology of one such neuron is shown in Figure 1B. Continuous sampling in bins of 10 min showed very little spontaneous activity in neurons obtained from SP-only treated rats (n = 3; Figure 1Bii). In contrast, both short (<10 s) and long (>30 s) bursts of interictal-like events reminiscent of epileptiform activity were observed in neurons obtained from rats induced with SE 24 hr prior (24 hr SE neurons; n = 5, Figure 1Biii). The long bursts of interictal-like events occurred rhythmically at least once every 10–15 min. Similar activity was also observed in 83% (5 out of 6) neurons obtained from rats induced with SE 1 week prior (1 week SE neurons; data not shown). These results are consistent with EEG recordings from EC showing interictal spike activity and suggest the presence of synchronous network activity of both short and long duration.
Enhanced Dendritic Excitability of SE Neurons Despite Hyperpolarized Membrane Potentials
To suppress spontaneous activity, all further recordings were obtained in the presence of 10 μM bicuculline, 50 μM d-AP5, and 1 μM CGP 55845 to block GABAA receptors, NMDA receptors, and GABAB receptors, respectively. Under these conditions, no significant differences in resting membrane potential (RMP) values, numbers of action potentials, and input resistance (RN) were observed between vehicle-treated and SP-only treated rats (see Figures 2 and 3). In addition, neither action potential amplitude nor action potential width (see below) significantly varied between neurons obtained from vehicle-treated rats or SP-treated rats, indicating that the effect of sodium pentobarbital on membrane properties was minimal 24 hr after administration. Therefore, where there were no significant differences between vehicle-only treated rats and SP rats, the term “control” in the text will be used to refer to both these groups.
Figure 2. Intrinsic Membrane Properties of Control and SE Neurons.

(A–D) Examples of input-output curves obtained from control and SE neurons under whole-cell current clamp conditions. The dendritic recordings were obtained 100 μm along the apical dendrite from the cell body. In all cases, a series of hyperpolarizing pulses (from −100 pA to −500 pA) and depolarizing pulses (as shown in the schematic in [C]) were applied with the cells held at their respective normal RMP. Current injections of 100–150 pA were sufficient to trigger multiple action potentials at the soma of the 24 hr and 1 week control and SE neurons, respectively. In contrast, a current pulse of 400 pA was required to trigger multiple action potentials in either 24 hr or 1 week control dendrites. A current pulse of the same magnitude evoked significantly more spikes in both 24 hr and 1 week SE dendrites. The time scale shown in (Ai) applies to (Aii), (Aiii), (Aiv), (Bi), (Bii), (Biii), and (Biv), respectively. (C and D) Average RMP values obtained from whole-cell current clamp recordings from the soma and dendrites (100–150 μm from the cell body), respectively, of SE, SP, and control (vehicle) neurons. (E and F) Input-output curves obtained from the soma and dendrites (100–150 μm from the cell body) of SE, SP, and control neurons. The action potential number (AP No.) was plotted against the depolarizing current injection used. The input-output curves for both 24 hr and 1 week SE neurons shown in (F) were determined to be significantly different from the input-output curves obtained from the 24 hr and 1 week vehicle and SP neurons.
Figure 3. Input Resistances Obtained from Control and SE Neurons in the Absence and Presence of the Ih Blocker ZD7288.

(A and B) Examples of traces obtained with 400 ms 100 pA and 200 pA hyperpolarizing pulses from 24 hr control and SE dendrites, respectively, in the absence (black) and presence (red) of 20 μM ZD7288. Both neurons were held at fixed potentials of −70 mV irrespective of their RMP. The recordings were obtained about 120 μm along the apical dendrite from the soma. (C and D) Input resistance (RN) measurements from the soma and dendrites of vehicle, SP, and SE, respectively. These measurements were obtained in the absence of ZD7288. (E and F) The resulting percent changes in RN after bath application of ZD7288 in vehicle, SP, and SE soma and dendrites, respectively.
Whole-cell current clamp recordings revealed that the somatic and dendritic RMP of SE neurons at both the 24 hr and 1 week time points were significantly more hyperpolarized than controls (Figure 2). Depolarizing current injections showed that the neurons from both SE and control rats were regular spiking (see Figure 2 for examples). Despite the hyperpolarized RMP, significantly greater numbers of action potentials were recorded in 24 hr and 1 week SE dendrites compared to controls (Figures 2B, 2D, and 2F). At the normal somatic RMP, there were no differences in the numbers of action potentials evoked between the SE neurons and controls within the 24 hr group or the 1 week group (Figures 2A, 2C, and 2E). If, however, the neurons were all held at a fixed potential of −70 mV, then significantly more action potentials were evoked by depolarizing current injections at the soma of the 24 hr and 1 week SE neurons compared to the 24 hr and 1 week SP neurons, respectively (Supplemental Figure S2 [http://www.neuron.org/cgi/content/full/44/3/495/DC1/]).
Variations in the numbers of evoked action potentials can arise from a shift in the threshold for action potential initiation. There were no differences, however, in action potential threshold measured at the soma between the different groups of neurons (see Supplemental Table S1 [http://www.neuron.org/cgi/content/full/44/3/495/DC1/]). As the action potential initiation site in dendrites is unknown, the threshold for dendritic action potentials could not be determined. There were also no differences between action potential amplitude or width between control and SE groups (see Supplemental Table S1), indicating that K+ or Na+ channel properties responsible for action potential shapes were minimally affected by SE induction. In neurons from all groups, action potentials recorded in the dendrites were significantly (p < 0.05) shorter and wider than those at the soma, and this might indicate differences in dendritic versus somatic Na+ or K+ channel densities as has been reported for other neuronal subtypes (Magee, 2000). In 23% of 24 hr control neurons (7 of 30 neurons tested) and 40% of 1 week SP neurons (2 out of 5 neurons tested), bursting was induced by dendritic depolarizing current injections. Bursting was rarely observed in either the 24 hr or 1 week SE dendrites (1 out of 31 neurons tested).
Differences in RN of SE neurons compared to controls may also contribute to the increased number of action potentials observed in SE dendrites. Indeed, we observed that hyperpolarizing pulses from the respective normal RMP resulted in a smaller “sag” and a larger deflection in the voltage in SE dendrites compared to controls (Figure 2). These results indicated that the SE neuron RN differed from that of control neurons. To test whether there were differences in RN between SE and control neurons, hyperpolarizing current pulses were applied from a fixed potential of −70 mV. Indeed, the RN of the soma and dendrites of the 24 hr and 1 week SE neurons were substantially (p < 0.01) greater than that of their respective control neurons (Figures 3A-3D). Interestingly, the somatic, but not dendritic, RN of both 1 week SP and 1 week SE neurons was decreased significantly (p < 0.01) compared to the 24 hr SP and SE neurons, respectively. The somatic RN of the 1 week vehicle group was comparable to the 24 hr vehicle group (Figure 3C). These data also indicate that the differences in RN are likely to account for the observed variations in input-output curves.
Hyperpolarizing pulses in the dendrites of control neurons revealed a considerable “sag” and lower RN in comparison to the soma (see Figure 3). The presence of the sag and the lower input resistance in dendrites is indicative of an increased amount of the dendritic hyperpolarization-activated cation current (Ih) (Pape, 1996; Robinson and Siegelbaum, 2003). These data are consistent with the hypothesis that Ih is greater in dendrites compared to soma of EC layer III pyramidal neurons as shown previously for CA1 and neocortical layer V neurons (Berger et al., 2001; Magee, 1999; Williams and Stuart, 2000).
A Reduction in Ih Increases Dendritic Excitability
The greater RN of SE neurons coupled with the hyperpolarized RMP suggests that there is a reduction in Ih in these neurons. To test the hypothesis that a reduction in Ih contributes to the enhanced dendritic excitability of SE neurons, the effects of the irreversible blocker of Ih, ZD7288 (20 μM), were explored. Application of ZD7288 abolished the sag in the dendrites and dramatically increased the dendritic RN of both 24 hr and 1 week control neurons (by 200%–400%, Figures 3E and 3F). The somatic RN of control neurons was also significantly increased (by 100%–150%) following addition of ZD7288 but to a lesser extent than at the dendrites. In SE neurons, the RN was enhanced following application of ZD7288 at both the soma and dendrites, but this augmentation was significantly smaller than in control and SP neurons (Figures 3E and 3F). The average somatic and dendritic RN of the 24 hr and 1 week SE neurons following application of ZD7288 was comparable to the 24 hr and 1 week control groups (somatic 24 hr SP RN = 178.8 ± 18 MΩ, n = 16; somatic 24 hr Veh RN = 185.7 ± 11 MΩ, n = 29; somatic 24 hr SE RN = 188.0 ± 20 MΩ, n = 15; somatic 1 week SP RN = 153.1 ± 19 MΩ, n = 6; somatic 1 week SE RN = 120.4 ± 15 MΩ, n = 5; dendritic 24 hr SP RN = 141.6 ± 19 MΩ, n = 6; dendritic 24 hr Veh RN = 149.8 ± 13 MΩ, n = 11; dendritic 24 hr SE RN = 185.3 ± 18 MΩ, n = 8; dendritic 1 week SP RN = 127.6 ± 26 MΩ, n = 3; dendritic 1 week SE RN = 203.8 ± 17 MΩ, n = 4).
In addition to affecting RN, ZD7288 also caused a significant hyperpolarization of the RMP at the soma (change in RMP of −12.5 ± 1.6 mV [n = 15], −10.4 ± 1.2 mV [n = 15], and −8.67 ± 0.7 mV [n = 6] in 24 hr vehicle, 24 hr SP, and 1 week SP neurons, respectively) and dendrites (change in RMP of −13.6 ± 1.4 mV [n = 13], −14.0 ± 2.2 mV [n = 7], and −11.3 ± 2.5 mV [n = 4] in 24 hr vehicle, 24 hr SP, and 1 week SP neurons, respectively; Figures 4A, 4E, and 4H). In contrast, the somatic RMP of both 24 hr and 1 week SE neurons did not change significantly (change in RMP of −3.08 ± 1.0 mV [n = 13] and −1.20 ± 0.9 mV [n = 5], respectively; Figure 4H). The dendritic RMP of the 24 hr and 1 week SE neurons did hyperpolarize appreciably (by −7.73 ± 1.0 mV [n = 15] and −6.75 ± 1.2 mV [n = 4], respectively), but the extent of the hyperpolarization was significantly smaller than in the respective control neurons (Figure 4E).
Figure 4. Effects of ZD7288 on Input-Output Curves and RMPs of Control and SE Neurons.

(A and B) Example traces from 24 hr control and SE dendrites in the absence of ZD7288, in the presence of ZD7288 (20 μM) at the new hyperpolarized RMP (HRMP), and in the presence of ZD7288 when the cell is depolarized back to its original RMP (ORMP). In all cases, hyperpolarizing pulses of 50 pA and 100 pA were applied. In control dendrites, depolarizing pulses between 50 pA and 200 pA were applied, whereas in SE dendrites, depolarizing pulses between 50 and 150 pA were applied. (C, D, F, and G) Input-output curves obtained from control and SE soma and dendrites in the absence of ZD7288 at the RMP (black) and after bath application of ZD7288 at the HRMP (light green) and the ORMP (dark green). As there were no significant differences between neurons from SP treated rats and vehicle treated rats, the data were pooled together and are represented as “control.” The input-output curves from the 1 week SP neurons or 1 week SE neurons are plotted separately. NB As there was little change in RMP at the soma of SE neurons following application of ZD7288, the input-ouput curve shown at the HRMP is the same as that at the ORMP. (E and H) Bar graphs illustrating the average differences in voltage (Vm) between the normal RMP in the absence of ZD7288 and the new HRMP in the presence of ZD 7288.
In the presence of ZD7288, a significantly greater number of action potentials could be evoked in the dendrites of both 24 hr and 1 week control neurons despite the hyperpolarized RMP (Figures 4A and 4C). The input-output curves at the soma of 24 hr and 1 week control neurons at the normal RMP in the absence of ZD7288 and at the hyperpolarized RMP in the presence of ZD7288 were not different (Figure 4F). Depolarization of the RMP in the presence of ZD7288 to the original RMP resulted in a significantly greater number of action potentials being evoked at the soma (Figure 4F). Thus, the significant increase in the number of action potentials evoked at the dendrites of control neurons at hyperpolarized RMP is likely to be due to the greater increase in dendritic versus somatic RN observed (Figures 3 and 4). Application of ZD7288 did not alter the number of action potentials recorded in either 24 hr or 1 week SE neuron soma or dendrites (Figures 4D and 4G). These data support the hypothesis that the Ih density is appreciably reduced in SE neurons and that this contributes to the significantly smaller depolarizing current injections evoking greater numbers of action potentials in SE dendrites (Figure 2). Moreover, these data reinforce the suggestion that a larger amount of Ih is present in dendrites than soma of control neurons.
Ih and HCN Proteins Are Significantly Reduced in SE Neurons
To test more directly the hypothesis that Ih is reduced in SE neurons, we obtained cell-attached recordings of Ih from entorhinal layer III neurons. To isolate Ih, the internal pipette solution contained blockers of K+, Na+, and Ca2+ channels. For these measurements, pipettes with a uniform outer tip diameter of 1 μm and a resistance of 8–9 MΩ when filled with the internal pipette solution were utilized. Hyperpolarizing steps from a membrane potential of −40 mV revealed noninactivating, inward currents and a tail current upon returning to the holding potential (Figure 5A). The magnitudes of these currents were very small (tail currents < 2 pA, n = 4, data not shown) at the soma of control neurons, and therefore, all recordings were obtained in dendrites at a distance of 100–150 μm from the soma. In addition, as the dendritic properties of the 1 week SP control and 1 week SE neurons were very similar to the dendritic properties of the 24 hr control and the 24 hr SE neurons, respectively (Figures 2-4), cell-attached recordings were only obtained using the 24 hr groups. At the RMP (determined to be −62.5 ± 1.5 mV [n = 8] upon rupturing the patches), both the inward currents were about one-tenth the magnitude of the currents at potentials of −150 mV. In dendrites of control neurons, the half-maximal activation voltage (V1/2) was determined to be −95 mV (Figure 5B), similar to that of Ih in CA1 pyramidal neurons (Magee, 1998). These results also support the notion that the density of Ih is greater in dendrites compared to the soma.
Figure 5. Ih Density and HCN Protein Levels in EC following SE.

(A) Examples of the steady-state inward and tail currents obtained when a hyperpolarizing step from −40 mV to −150 mV was applied to 24 hr control (black) and 24 hr SE (red trace) dendrites (100–150 μm from the soma). (B) The activation curve of Ih in 24 hr control (Vehicle and SP) dendrites was obtained from hyperpolarizing steps from a holding potential of −40 mV. The values were measured as the average of the last 40 ms of the steady-state inward current and expressed as the ratio of the maximum steady-state current obtained when stepping to −150 mV. The numbers in brackets represent the number of observations for each point. The V1/2 was estimated to be −95.0 mV. (C and D) A comparison of the steady-state inward and peak tail currents, respectively, from 24 hr SP, 24 hr Vehicle, and 24 hr SE dendrites when the voltage protocol shown in (A) was applied. (E and F) Graphs to illustrate the HCN1 and HCN2 protein levels in EC tissue following either 24 hr or 1 week kainate treatment (SE), 24 hr or 1 week sodium pentobarbital (SP) only treatment (SP), and 24 hr or 1 week vehicle (saline) treatment (control). Above each graph are examples of Western blots obtained using tissue samples from 24 hr SE, 24 hr SP only, or 24 hr vehicle treated rats. Each n on the graph represents a single animal. Immunoreactivity was quantified using densitometry. Significance was determined using ANOVA with post hoc Tukey's multiple comparison test.
Interestingly, the magnitudes of inward, noninactivating currents and, thereby, the tail currents were significantly reduced in SE neurons in comparison to controls (Figures 5A, 5C, and 5D). The magnitudes of the steady-state and tail currents in SE neurons were, however, too small at potentials positive to −140 mV to make accurate measurements. For this reason, the magnitudes of steady-state and tail currents in SE neurons and control neurons were measured by stepping from a holding potential of −40 mV to the hyperpolarized potential of −150 mV and compared (Figures 5C and 5D). The small steady-state and tail currents also prevented us from constructing an accurate activation curve for Ih in SE neurons. Once data were obtained from the cell-attached mode, the patch was ruptured and the RMP determined to be −72.4 ± 2.1 (n = 4), consistent with our findings under whole-cell conditions (Figure 2). The differences in tail and steady-state currents between SE and control neurons are comparable to the differences in RN observed under whole-cell conditions (Figure 3C) and indicate that the postsynaptic density of Ih differs in EC layer III neurons following SE.
The reduction in Ih observed in our cell-attached experiments suggested a decrease in the number of h channels and, thus, a decline in the subunits underlying h channels. Four genes that encode for h channels, HCN1–4, have now been cloned (Santoro et al., 2000), and alterations in HCN1 and HCN2 protein levels have been reported in other models of epilepsy (Bender et al., 2003; Brewster et al., 2002). Immunohistochemical studies also indicate that HCN1 and HCN2 subunits are likely to be predominantly expressed in the EC (Notomi and Shigemoto, 2004). To test the possibility that these subunits are downregulated following SE, Western blot analysis was performed using antibodies specific to HCN1 and HCN2. The results were normalized by blotting with an antibody against actin and quantified using densitometry. Both HCN1 and HCN2 protein levels were significantly reduced in EC tissue obtained from rats induced with SE 24 hr prior in comparison to controls (Figures 5E and 5F). In contrast, the HCN1 and HCN2 protein levels were not significantly different in EC tissue obtained from rats induced with SE 1 week prior and controls (Figures 5E and 5F). It thus appears that the HCN protein levels, at least, recover by the 1 week time point. The electrophysiological recordings suggest that Ih is still downregulated at the 1 week time point. Therefore, although the HCN protein levels have recovered in the total EC homogenates, either the subunits have not formed functional channels or have increased in other cell types within the EC (whole EC tissue was used for Western blot analysis). Thus, there may still be a selective decrease in HCN protein in EC layer III pyramidal neurons, but this may be below the level of detection of the Western blot method.
Total actin protein levels in the EC were comparable between control and SE groups (Supplemental Figure S3 [http://www.neuron.org/cgi/content/full/44/3/495/DC1/]), indicating that the reduction in HCN protein levels observed at the 24 hr time point does not represent a nonspecific decrease in all proteins. The reduction in HCN protein levels is also not likely to be due to tissue injury, as little cell loss was observed in the EC 24 hr and 1 week following SE based on Nissl staining (Supplemental Figure S1). Thus, the decrease in Ih observed from recordings in EC layer III pyramidal neurons is likely to be due to a specific reduction in the number of h channels available.
In addition, we asked the question whether the changes in HCN protein levels observed at the 24 hr time point were already evident at an early time point (1 hr) following the onset of SE (i.e., before the administration of SP). In a separate set of experiments, Western blot analysis was also performed using tissue from rats that had experienced kainate (10 mg/kg i.p.) -induced continuous seizures (SE) for 1 hr and vehicle controls. Again, HCN protein levels were normalized to actin levels and quantified using densitometry. No differences in HCN protein levels in the EC were found between rats that had experienced SE for 1 hr and controls (control HCN1 = 102% ± 9.6%; SE 1 hr only HCN1 = 100% ± 8.7%; control HCN2 = 109% ± 11%; SE 1 hr only HCN2 = 112% ± 12%; n = 6 for each group). It is thus concluded that the HCN protein levels decrease over the first 24 hr following the onset of SE and thus might be one of the changes that contribute to the early phase of epileptogenesis.
Increased Dendritic EPSP Summation Enhances EPSP-Spike Coupling in SE Neurons
Our results thus far show a significant reduction in the postsynaptic density of Ih in EC layer III neurons 24 hr and 1 week following SE. Prior studies have indicated that dendritic Ih greatly affects both temporal and spatial summation of EPSPs (Magee, 1998, 1999; Wang et al., 2003). We therefore hypothesized that the decrease in Ih would enhance the summation of incoming EPSPs and thereby increase the firing rates of these neurons. To address this issue, we first investigated whether there were differences in temporal summation of EPSPs between SE and control neurons. To eliminate complications due to possible presynaptic effects of Ih (Beaumont and Zucker, 2000; Chevaleyre and Castillo, 2002; Klar et al., 2003; Mellor et al., 2002), EPSPs were simulated by current injection of a defined α function (and are referred to as αEPSPs; see Experimental Procedures). A fixed time constant of 0.5 ms and current injection of 800 pA (see Experimental Procedures) were used to generated αEPSPs at both the soma and dendrites. Under these conditions, there were no differences in the rise time or amplitude of αEPSPs between SE neurons and controls. The decay time constants (τ) of single αEPSPs generated at the soma of the 24 hr SE neurons were also not significantly different from those of control neurons (24 hr SP τ = 24.0 ± 3.1 ms, n = 10; 24 hr vehicle τ = 24.7 ± 3.1 ms, n = 16; 24 SE τ = 26.6 ± 3.0 ms, n = 15). In contrast, the single somatic αEPSPs in 1 week SE neurons decayed significantly (p < 0.05) more slowly than those evoked in 1 week SP neurons (1 week SE τ = 44.8 ± 5.6 ms, n = 3; 1 week SP τ = 24.5 ± 1.3 ms, n = 4). The decay time constants of αEPSPs generated in both 24 hr and 1 week SE dendrites (100–150 μm from the soma; 24 SE τ = 22.2 ± 1.5 ms, n = 6; 1 week SE τ = 34.6 ± 8.3 ms, n = 5) were also significantly (p < 0.05) greater than for αEPSPs evoked in control dendrites (24 hr SP τ =15.4 ± 2.2 ms, n = 6; 24 hr vehicle τ = 12.3 ± 0.9 ms, n = 8; 1 week SP τ = 15.2 ± 2.3 ms, n = 5). Application of the Ih blocker ZD7288 significantly increased the amplitude and decay time constants of αEPSPs in control neurons (Figure 6) similar to that observed in CA1 pyramidal neurons (Magee, 1999). In contrast, the effects of ZD7288 on the amplitude and decay time constants of αEPSPs in SE neurons were significantly smaller than controls (Figure 6). These results suggest that the reduction in the postsynaptic density of Ih in SE neurons has affected the kinetics of synaptic potentials and thereby may affect the propagation of signals and the firing rate of these neurons.
Figure 6. Effects of ZD7288 on Single αEPSPs in Control and SE Neurons.

(A–D) Examples of single αEPSPs in the absence (black) and presence (red) of ZD7288 from the soma and dendrites of EC layer III pyramidal neurons. The dendritic recordings were obtained at distances of 150 μm from the soma. All recordings were obtained at a fixed potential of −70 mV. (E–H) Average percentage difference in peak amplitudes and decay time constants (τ) of single αEPSPs before and after application of ZD7288 in the soma and dendrites of vehicle, SP, and SE neurons. The decay time constants were measured by fitting a double exponential function (see Experimental Procedures) from the peak of the αEPSP to baseline. The numbers of observations for each treatment are in parenthesis. * indicate significance levels of p < 0.05.
Indeed, the summation of a train of αEPSPs generated at 50 Hz was significantly greater in the SE dendrites than control dendrites (Figure 7F). The summation of a train of αEPSPs generated at the soma of the 1 week SE neurons was also significantly enhanced compared to 1 week SP neurons (Figure 7E). On the other hand, αEPSPs at the soma of the 24 hr SE and control neurons summated to a similar extent (Figure 7E). In the presence of ZD7288, the summation of a train of αEPSPs in control neurons was significantly increased (Figures 7A-7E). The effect of ZD7288 was greater in the dendrites than the soma (Figures 7C and 7F). Unlike control neurons, bath application of ZD7288 onto SE neurons had little effect on the summation ratio of a train of αEPSPs (Figures 7B, 7D, 7E, and 7F). The enhanced summation of αEPSPs in both 24 hr and 1 week SE neurons is likely to be a consequence of the slower decay time of single αEPSPs.
Figure 7. Effects of ZD7288 on Summation in Control and SE Neurons.

(A–D) Example traces of trains of five αEPSPs evoked at a frequency of 50 Hz in the absence (black) and presence (red) of ZD7288 in the soma and dendrites of 24 hr control and 24 hr SE neurons. All recordings were obtained at a potential of −70 mV. (E and F) αEPSP summation ratios before and after application of ZD7288 in the soma and dendrites, respectively. For purposes of clarity, the control data is the data from the 24 hr SP and 24 hr Veh groups pooled together. There were no differences between 24 hr SP, 24 hr vehicle, and 1 week SP data in the absence of ZD7288. The summation of αEPSPs (p < 0.05) at the soma of 1 week SE neurons was significantly increased compared to 1 week SP neurons in the absence of ZD7288, as indicated by the asterisk. Similarly, there was substantially (p < 0.05) enhanced summation of αEPSPs in both the 24 hr and 1 week SE dendrites compared to 24 hr control and 1 week SP dendrites, respectively (indicated by asterisks in [F]). Application of ZD7288 resulted in significantly (p < 0.01) more summation of αEPSPs at both the soma and dendrites of 24 hr control and 1 week SP dendrites as indicated by asterisks.
The increased summation of dendritic αEPSPs in both 24 hr and 1 week SE neurons suggests that, at a given membrane potential, incoming synaptic potentials in dendrites are more likely to give rise to action potentials. To test this hypothesis, trains of EPSPs were evoked at 50 Hz by extracellular stimulation near the distal dendrites of control and SE neurons while varying the somatic holding potential between −80 mV and −60 mV. The stimulation intensity was controlled such that the somatic single EPSPs were between 2 and 4 mV in amplitude at −70 mV. In 24 hr and 1 week control neurons, the average baseline potential at which EPSPs summated to elicit an action potential with the fifth EPSP was close to −60 mV (average 24 hr control potential = −60.4 ± 1.8 mV, n = 13; average 1 week SP potential = −53.8 ± 3.1 mV, n = 4; Figure 8). This is significantly more positive to the average somatic RMP of both 24 hr control and 1 week SP neurons (24 hr control RMP = −65.4 ± 0.6 mV, n = 92; 1 week SP RMP = −65.9 ± 0.7 mV, n = 18; Figure 8B). In contrast, a train of five EPSPs evoked at 50 Hz summated to initiate action potentials at baseline potentials of −70 mV in 80% of 24 hr SE neurons and 100% of 1 week SE neurons (Figure 8B). In fact, EPSPs in 40% (2 out of 5 neurons) of 24 hr SE neurons and 80% (4 out of 5) of 1 week SE neurons summated sufficiently such that an action potential resulted with the fifth EPSP at a potential of −80 mV (Figure 8C). This was reflected in the significantly greater summation ratio of EPSPs in SE neurons compared to controls (Figure 8C). The average potential at which action potentials could be evoked with a train of five EPSPs was near −75 mV in both 24 hr and 1 week SE neurons (average 24 hr SE potential = −73.6 ± 2.1 mV, n = 9; average 1 week SE potential = −77.0 ± 3.0 mV, n = 5; Figure 8B). Interestingly, the somatic RMP of both the 24 hr and 1 week SE neurons also falls in this range (24 hr SE RMP = −73.5 ± 0.5 mV, n = 40; 1 week SE RMP = −74.7 ± 0.5 mV, n = 14; Figures 2D and 8B). Hence, there is a greater probability of SE neurons firing in response to trains of EPSPs and this is likely to facilitate the epileptiform-like activity observed in these neurons (Figure 1C).
Figure 8. EPSP-Spike Coupling in SE and Control Neurons.
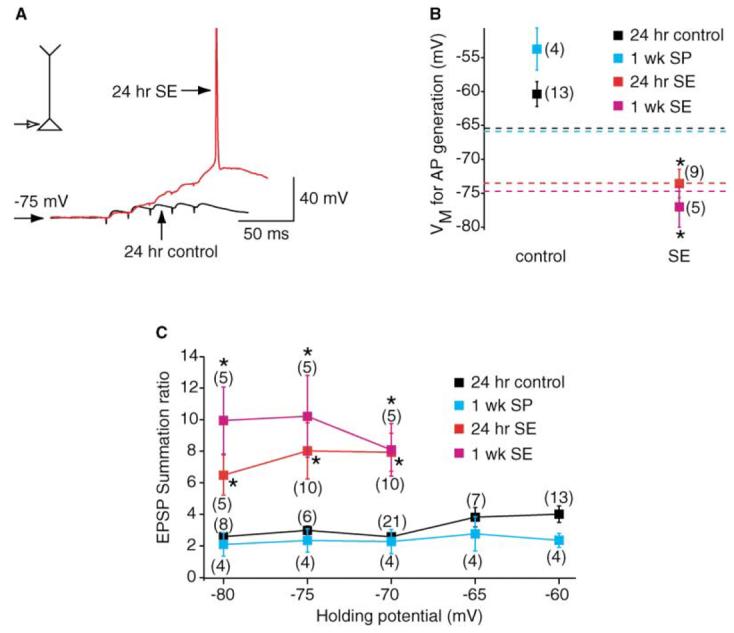
(A) Examples of recordings of a train of five EPSPs at a frequency of 50 Hz from 24 hr SE (red) and 24 hr control (black) neurons. The two traces have been superimposed. All recordings were made at the soma at a potential of −75 mV. The EPSPs were evoked by extracellular stimulation of the distal dendrites of the neurons. Note that at this potential, the EPSPs in SE neurons summated sufficiently to generate an action potential at the end of the train. (B) Holding potentials (Vm) at which an action potential (AP) was generated with the fifth EPSP in a train of five EPSPs evoked at 50 Hz. The numbers of observations are indicated in brackets. (C) EPSP summation ratio at holding potentials between −80 mV and −60 mV. The numbers of observations for each point are shown in brackets. As there were no significant differences between the 24 hr SP and 24 hr vehicle groups, the data were pooled together and are represented as “control” in (B) and (C).
Discussion
The important findings of this study are that there was a profound reduction in Ih in EC layer III pyramidal neurons within 24 hr of an episode of seizures and that this is likely to be responsible, at least in part, for the enhanced excitability of these neurons and their associated networks in this important region of the brain. This reduction in functional Ih persisted for up to 1 week in these neurons. Our results provide a potential insight into the mechanisms leading to the onset of chronic epilepsy. In addition, our results suggest that Ih may be a useful target for the therapeutic intervention of temporal lobe epilepsy.
A Reduction in Ih Is Likely to Account for the Enhanced Excitability in SE Neurons
Both the 24 hr and 1 week SE neurons had significantly hyperpolarized RMP together with significantly increased RN compared to their respective controls (Figures 2 and 3), indicating a reduction in Ih (Pape, 1996; Robinson and Siegelbaum, 2003). Interestingly, the RN for the 1 week SE and SP neurons was reduced compared to the 24 hr SE and SP neurons. Because SE rats were also treated with SP, this effect might be attributed to long-term changes induced by SP administration. Single action potential amplitude, width, or threshold (Supplemental Table S1 [http://www.neuron.org/cgi/content/full/44/3/495/DC1/]) was minimally affected, indicating that channels involved in the generation of action potentials were not modified. An additional interesting observation was that significantly more action potentials could be induced by current depolarizations in SE dendrites compared to controls, despite the significantly more hyperpolarized RMP of these neurons (Figure 2). This effect did not occur at the soma, although if the neurons were all held at the same membrane potential, then more somatic action potentials could be generated by depolarization of SE neurons as a consequence of the significantly increased RN. Action potential bursting sometimes occurred in control dendrites but rarely in the SE dendrites that were sampled. Bursting has been associated with Ca2+ tail currents or loss of K+ currents in other cell types (Golding et al., 1999; Jung et al., 2001; Magee and Carruth, 1999), and the lack of bursting in SE neurons may reflect modifications in the properties of these channels. Thus, though we cannot exclude alterations in other channel properties, our results strongly suggested that Ih was the current that was predominantly responsible for the differences in the intrinsic membrane properties of SE neurons. The significantly smaller effects of the Ih blocker ZD7288 on SE neurons corroborated our hypothesis that Ih was dramatically reduced in these neurons (Figures 3 and 4). This hypothesis was confirmed when Ih was measured directly using cell-attached voltage clamp recordings from the dendrites of control and SE neurons and was found to be significantly lower in SE neurons (Figure 5). Furthermore, at the 24 hr time point, Western blot analysis showed reduced densities of HCN1 and HCN2 (Figure 5), the two major h channel subunits that are expressed in the EC (Notomi and Shigemoto, 2004). At the 1 week time point, however, the HCN protein levels were similar in SE and control neurons, suggesting that although HCN protein levels may have recovered in total EC tissue samples, functional channels have not been increased in EC layer III neurons.
Can the global reduction in Ih in EC layer III pyramidal neurons have a greater effect on dendritic excitability and thereby increase the overall excitability of the neurons? The dendritic membrane properties of EC layer III pyramidal neurons have thus far remained unexplored. Our cell-attached recordings showed that, as in neocortical (Berger et al., 2001; Williams and Stuart, 2000) and CA1 pyramidal neurons (Magee, 1998), there was a significantly greater amount of Ih in control dendrites compared to soma. Consistent with previous studies involving CA1 pyramidal neurons (Poolos et al., 2002), pharmacologically decreasing Ih led to enhanced dendritic excitability of the control EC layer III pyramidal neurons (Figure 4). Although Ih contributes significantly to the somatic RN and RMP, the input-output curve at the soma following block of Ih at the hyperpolarized RMP is very similar to that before Ih was reduced (Figure 4F). Therefore, in agreement with previous findings from CA1 neurons (Van Welie et al., 2004), reducing somatic Ih has a homeostatic effect. In contrast, reducing dendritic Ih in control neurons by application of the Ih blocker ZD7288 elicited significantly more spikes by a given depolarization despite the RMP being substantially hyperpolarized (Figure 4C). This is somewhat counterintuitive because the more hyperpolarized the RMP, the further from threshold for action potential initiation. A likely explanation is that the increase in somatic RN (approximately 90%), although significant, is substantially smaller than the change in dendritic RN (between 200% and 400%). Similarly, in both 24 hr and 1 week SE neurons, although the RMP was substantially more hyperpolarized than that of control neurons, significantly more spikes can be evoked by a given depolarization. This is likely to be due to the RN of SE dendrites being approximately twice that of control neurons. Therefore, in dendrites the increase in RN due to less Ih appears to overcome the variation in the RMP.
The function of h channels can be thought of as an electrical shunt. The higher density of h channels in dendrites results in a lower RN than at the soma and thus would limit EPSP amplitudes. In addition, deactivation of Ih with depolarization produces a significant hyperpolarizing drive that will not only reduce EPSP amplitudes but will also decrease the temporal summation of dendritic excitatory events (Magee, 1999; Figure 7), thereby dampening excitability. The increased density of Ih in dendrites also decreases the local membrane time constant and speeds the decay time constant of local EPSPs, further reducing temporal summation of EPSPs (Magee, 1999). Consistent with this, EPSPs in both 24 hr and 1 week SE dendrites decayed more slowly, thus enhancing the summation of a train of EPSPs. The greater temporal and spatial summation of EPSPs (Magee, 1999; Wang et al., 2003) increases the likelihood of action potentials being initiated in the axon following a series of excitatory events. In agreement with this, evoked EPSPs in both 24 hr and 1 week SE neurons summated sufficiently to reach threshold for action potential initiation at membrane potentials that overlap with the somatic RMP (Figure 8B). This is also consistent with the observation that increased spontaneous activity together with bursts of interictal-like events are more prominent in SE neurons (Figure 1). Our data support the notion that a downregulation in Ih contributes substantially to the hyperexcitability of EC layer III pyramidal neurons following SE. Dendritic Ih thus plays a crucial role in controlling neuronal excitability.
Ih and Epileptogenesis
Our results demonstrate a pronounced turnover (within 24 hr) of HCN protein levels following changes in activity of EC neurons caused by SE. This change in HCN protein levels may occur at the transcriptional level, as gene expression is often altered following SE (for example, see Becker et al., 2003). An additional contribution to the reduction in Ih that occurs 24 hr following SE may be a long-term activity-dependent alteration due to enhanced on-going synaptic activity (see Figure 1). Increased synaptic activity over a short period of time (minutes) has been shown to upregulate Ih in CA1 pyramidal neurons (Van Welie et al., 2004; D. Fricker and D. Johnston, 2001, Soc. Neurosci., abstract). It is unknown, however, whether increased synaptic activity over long periods (hours) can cause the switch between upregulation to downregulation of Ih.
It is important to note that the experiments in this study reflect Ih and HCN levels in the EC 24 hr and 1 week following SE, time points that occur within the “latent” period and when the animal is not experiencing obvious behavioral seizures. The levels of Ih within individual neuronal subtypes may also depend on the stage of epileptogenesis and associated network activity and this may lead to differential effects of Ih on membrane excitability. In hippocampal neurons, for example, an upregulation of Ih has been reported together with a discordant variation in HCN levels in rodents already experiencing behavioral seizures (Bender et al., 2003; Brewster et al., 2002; Chen et al., 2001). In EC layer II and V neurons, on the other hand, there are no changes in the intrinsic membrane properties following SE, though there is an alteration in the synaptic balance (Fountain et al., 1998; Kobayashi et al., 2003). There is increasing evidence that synaptic activity can alter levels of Ih (Van Welie et al., 2004; D. Fricker and D. Johnston, D., 2001, Soc. Neurosci., abstract) and thus it is conceivable that HCN proteins and Ih may be modulated during the process of epileptogenesis. Indeed, although a substantial reduction in HCN protein level was determined at the 24 hr time point using Western blot analysis, this was not present at the 1 week time point. It is possible that, due to variations in network activity, there are on-going changes at the transcriptional and translational levels, thereby altering the ion channel densities and properties in the postsynaptic membrane. Although HCN protein levels may recover over a number of weeks, additional mechanisms such as posttranslantional modifications may alter channel function. Therefore, functional Ih may still be reduced in neurons and further influence the integration and propagation of synaptic signals. Whether the change in Ih in EC layer III pyramidal neurons observed in our study is sustained beyond 1 week following seizures and is ultimately responsible for the development of chronic temporal lobe epilepsy remains to be determined. The variation in HCN protein levels and Ih may also differ between cellular regions depending on network activity. Our results, however, indicate that Ih may play an important role in regulating the excitability of neurons and stabilizing networks, and this hypothesis is supported by the recent finding that mice deficient in HCN2 have chronic absence epilepsy due to increased excitability of thalamocortical neurons (Ludwig et al., 2003). Ih may thus be important for long-term regulation of neuronal excitability under both physiological and pathological conditions.
Experimental Procedures
Kainate-Induced Status Epilepticus
Class V seizures (Racine, 1972) were induced in 5- to 6-week-old male Sprague Dawley rats by the administration of kainic acid (10 mg/kg i.p.) and terminated 1 hr after onset with the use of SP (30 mg/kg s.c.). Control groups were rats that had been treated with kainate vehicle (saline) or SP only (30 mg/kg s.c.). Animals were sacrificed 24 hr or 1 week later for electrophysiological studies or Western blot analysis. Electroencephalography was obtained 24 hr following termination of SE or treatment with SP. All procedures concerning animals were approved by the Animal Research Committee for Baylor College of Medicine.
Surgical Procedure and Electroencephalography
Male Sprague Dawley rats (5- to 6-week-old) were anesthetized using a ketamine/xylaxine mixture (obtained from Baylor College of Medicine) and positioned in a stereotaxic frame. Depth electrodes were surgically implanted into the EC area using the following stereotaxic coordinates: 1.0–1.2 mm posterior to lambda, 4.2 mm lateral to lambda, and 4.0–6.0 mm below the cortical surface. Four to seven days later, SE was induced in rats using the protocol described above. Control groups included rats treated with SP (30 mg/kg s.c.) only. EEG recordings were obtained 24 hr later using Nihon-Kodan and Stellate digital EEG machines. Two 4 hr EEG recordings were made from the left and right EC electrodes referenced to a frontal surface electrode. Tracings were visually inspected for electrographic seizure activity and interictal spikes as previously defined (Anderson et al., 1997). Interictal spike frequency was determined during 60 s epochs of wakefulness.
Electrophysiological Studies
Rats were anesthetized and perfused intracardially with ice-cold modified ACSF containing (in mM) 110 choline chloride, 2.5 KCl, 1.25 NaH2PO4, 25 NaHCO3, 0.5 CaCl2, 7 MgCl2, 10 dextrose, and 1.3 ascorbic acid; bubbled continuously with 95%O2/5% CO2 to maintain pH at 7.2. The brain was then removed, and 400 μm thick hippocampal-entorhinal slices were prepared using a vibratome (Leica VT 1000S). The slices were incubated in a holding chamber at 36°C for 10–15 min followed by 1 hr at room temperature. The holding chamber contained external recording solution of the following composition: 125 NaCl, 2.5 KCl, 1.25 NaH2PO4, 25 NaHCO3, 2 CaCl2, 2 MgCl2, 10 dextrose; bubbled continuously with 95% O2/5% CO2 to maintain pH at 7.2. Neurobiotin (0.4% w/v; Vector Laboratories Ltd.) was also included in the intracellular pipette solution. Slices were fixed in 4% paraformaldehyde and stained with either DAB (Vector Laboratories Ltd.) or streptavidin Alexa Fluor 294 conjugate (Molecular Probes Ltd.) 24 hr later as described previously (Cossart et al., 2001).
Whole-cell and cell-attached recordings were obtained from both the soma and dendrites of EC layer III pyramidal neurons. For recording purposes, slices were placed in a chamber containing external recording solution maintained at 34–36°C. The external solution was supplemented with 0.05 mM APV, 0.01 mM bicuculline, and 0.001 mM CGP 55845. The internal recording pipette solution for whole-cell current clamp recordings contained (in mM) 120 KMeSO4, 20 KCl, 10 HEPES, 2 MgCl2, 0.2 EGTA, 4 Na2-ATP, 0.3 Tris-GTP, 14 Tris-phosphocreatine; pH was adjusted to 7.3 with KOH. For cell-attached recordings, the internal pipette solution contained (mM) 120 KCl, 20 TEA Cl, 5 4-AP, 1 BaCl2, 10 HEPES, 1 MgCl2, 2 CaCl2, 0.001 tetrodotoxin, 0.1 NiCl2; pH adjusted to 7.3. Pipettes containing either of these internal solutions had resistances of 8–9 MΩ. Whole-cell recordings were obtained using a bridge-mode amplifier (Dagan IX2-700), filtered at 10 kHz and sampled at 13.33 kHz. Series resistances were usually of the order 10–15 MΩ. Cell-attached recordings were obtained using Axon Multiclamp 700A (Axon Instruments), filtered 2 kHz and sampled at 3.5 kHz. All raw data were acquired using custom-written Igor Pro software (Wavemetrics).
Tungsten electrodes (A-M Systems, Everett, Washington) placed in EC layer I were used to elicit synaptic potentials. αEPSPs were generated by current injection of the order
where A is the amplitude of the current injected and τ is the rise time constant. EPSPs were evoked by extracellular stimulation using a bipolar tungsten electrode placed in layer I, approximately 100 μm from the distal dendrites. All drugs were bath applied. The effects of ZD7288 (20 μM) occurred within 15 min, and recordings were usually made within 30 min of application.
Data Analysis
All measurements were made using custom-written Igor software. The RN was calculated from 400 ms hyperpolarizing pulses of 100 pA applied from a holding potential of −70 mV. The αEPSP decay time constants were obtained by fitting the double exponential function
where τ1 and τ2 represent time constants of the initial and falling phase of the αEPSPs. Since Ih is activated during the falling phase of the αEPSP, only τ2 was used. The summation ratio of EPSPs was calculated as the ratio of the peak of the fifth EPSP to that of the first EPSP. When an action potential was initiated with the fifth EPSP, the summation ratio was the ratio of the potential immediately before the threshold of the action potential (determined as the point before the first derivative of the trace was no longer equal to zero) to the potential at the peak of the initial EPSP. For cell-attached recordings, the peak of the tail current following the 1.5 s hyperpolarizing step was used as an indication of the amount of Ih. Group data are expressed as mean ± SEM. Statistical significance was determined using either paired or unpaired Student's t tests as appropriate. Statistical significance of p < 0.05 is indicated as * in all figures.
Materials
All chemicals were obtained from Sigma (St. Louis, MO), apart from ZD7288, CGP55848, bicuculline, and APV, which were purchased from Tocris. Stock solutions of bicuculline and CGP55848 were made in DMSO and stored at −20°C until use. These were then dissolved in the external solution such that the final DMSO concentration was less than 0.1%. Aqueous stock solutions of ZD7288 and APV were also kept at −20°C until use.
Western Blot Studies
At the 24 hr and 1 week time points following SE, experimental and control animals were sacrificed and the EC subdissected in ice-cold saline and immediately frozen on dry ice. Tissue samples were homogenized and normalized using a Bradford assay and membranes prepared as previously described (Varga et al., 2000). The membranes from the experimental and control groups were used for Western blotting with antibodies against HCN1 and HCN2 (Chemicon, Temecula, CA) at a dilution of 1:500. Anti-rabbit secondary (Cell Signaling, Beverly, MA) was used at a dilution of 1:40,000. Blots were stripped and reprobed with an antibody to actin (1:10,000; Sigma, St. Louis, MO). Bands corresponding to the full-length HCN (117 kDa) and HCN2 (97 kDa) subunits were densitized using NIH software and normalized to actin immunoreactivity. ANOVA with post hoc analysis was used to statistically assess the changes in HCN immunoreactivity between the experimental and control groups.
Immunohistochemistry
Twenty-four hours or 1 week following SE, rats were sacrificed and whole brains removed. The freshly dissected brains were fixed in 10% formalin. Parafin-embedded sections were cut and Nissl staining performed as described by (Anderson et al., 1999).
Supplementary Material
Acknowledgments
We thank Dr. A. Jeromin for help with obtaining the image of the EC layer III pyramidal neuron shown in Figure 1. We also appreciate Dr. Dawna Armstrong's (Department of Pathology, Texas Children's Hospital) expertise on the pathology. We also thank Drs. R. Chitwood, A. Jeromin, M.F. Nolan, N. Poolos, and A. Rosenkranz for comments on this manuscript; Drs. R. Gray and X. Chen for help with Igor software; Mr. E. Lee for technical assistance; and Mrs. Bobbie Antalffy for assistance with the Nissl staining. This work was supported by NIH grants (to D.J. and A.E.A.). M.M.S. is a recipient of the Wellcome Prize Traveling Research Fellowship.
References
- Anderson AE, Hrachovy RA, Swann JW. Increased susceptibility to tetanus toxin-induced seizures in immature rats. Epilepsy Res. 1997;26:433–442. doi: 10.1016/s0920-1211(96)01010-8. [DOI] [PubMed] [Google Scholar]
- Anderson AE, Hrachovy RA, Antalffy BA, Armstrong DL, Swann JW. A chronic focal epilepsy with mossy fiber sprouting follows recurrent seizures induced by intrahippocampal tetanus toxin injection in infant rats. Neuroscience. 1999;92:73–82. doi: 10.1016/s0306-4522(98)00746-5. [DOI] [PubMed] [Google Scholar]
- Arzimanoglou A, Hirsch E, Nehlig A, Castelnau P, Gressens P, Pereira de Vasconcelos A. Epilepsy and neuroprotection: an illustrated review. Epileptic Disord. 2002;4:173–182. [PubMed] [Google Scholar]
- Avoli M, D'Antuono M, Louvel J, Kohling R, Biagini G, Pumain R, D'Arcangelo G, Tancredi V. Network and pharmacological mechanisms leading to epileptiform synchronization in the limbic system in vitro. Prog. Neurobiol. 2002;68:167–207. doi: 10.1016/s0301-0082(02)00077-1. [DOI] [PubMed] [Google Scholar]
- Barbarosie M, Louvel J, Kurcewicz I, Avoli M. CA3-Released entorhinal seizures disclose dentate gyrus epileptogenicity and unmask a temporoammonic pathway. J. Neurophysiol. 2000;83:1115–1124. doi: 10.1152/jn.2000.83.3.1115. [DOI] [PubMed] [Google Scholar]
- Beaumont V, Zucker RS. Enhancement of synaptic transmission by cyclic AMP modulation of presynaptic Ih channels. Nat. Neurosci. 2000;3:133–141. doi: 10.1038/72072. [DOI] [PubMed] [Google Scholar]
- Becker AJ, Chen J, Zien A, Sochivko D, Normann S, Schramm J, Elger CE, Wiestler OD, Blumcke I. Correlated stage- and subfield-associated hippocampal gene expression patterns in experimental and human temporal lobe epilepsy. Eur. J. Neurosci. 2003;18:2792–2802. doi: 10.1111/j.1460-9568.2003.02993.x. [DOI] [PubMed] [Google Scholar]
- Ben-Ari Y. Cell death and synaptic reorganizations produced by seizures. Epilepsia Suppl. 2001;42:5–7. doi: 10.1046/j.1528-1157.2001.042suppl.3005.x. [DOI] [PubMed] [Google Scholar]
- Ben-Ari Y, Cossart R. Kainate, a double agent that generates seizures: two decades of progress. Trends Neurosci. 2000;23:580–587. doi: 10.1016/s0166-2236(00)01659-3. [DOI] [PubMed] [Google Scholar]
- Bender RA, Soleymani SV, Brewster AL, Nguyen ST, Beck H, Mathern GW, Baram TZ. Enhanced expression of a specific hyperpolarization-activated cyclic nucleotide-gated cation channel (HCN) in surviving dentate gyrus granule cells of human and experimental epileptic hippocampus. J. Neurosci. 2003;23:6826–6836. doi: 10.1523/JNEUROSCI.23-17-06826.2003. [DOI] [PMC free article] [PubMed] [Google Scholar]
- Berger T, Larkum ME, Luscher HR. High I(h) channel density in the distal apical dendrite of layer V pyramidal cells increases bidirectional attenuation of EPSPs. J. Neurophysiol. 2001;85:855–868. doi: 10.1152/jn.2001.85.2.855. [DOI] [PubMed] [Google Scholar]
- Brewster A, Bender RA, Chen Y, Dube C, Eghbal-Ahmadi M, Baram TZ. Developmental febrile seizures modulate hippocampal gene expression of hyperpolarization-activated channels in an isoform- and cell-specific manner. J. Neurosci. 2002;22:4591–4599. doi: 10.1523/JNEUROSCI.22-11-04591.2002. [DOI] [PMC free article] [PubMed] [Google Scholar]
- Chen K, Aradi I, Thon N, Eghbal-Ahmadi M, Baram TZ, Soltesz I. Persistently modified h-channels after complex febrile seizures convert the seizure-induced enhancement of inhibition to hyperexcitability. Nat. Med. 2001;7:331–337. doi: 10.1038/85480. [DOI] [PMC free article] [PubMed] [Google Scholar]
- Chevaleyre V, Castillo PE. Assessing the role of Ih channels in synaptic transmission and mossy fiber LTP. Proc. Natl. Acad. Sci. USA. 2002;99:9538–9543. doi: 10.1073/pnas.142213199. [DOI] [PMC free article] [PubMed] [Google Scholar]
- Colbert CM, Levy WB. Electrophysiological and pharmacological characterization of perforant path synapses in CA1: mediation by glutamate receptors. J. Neurophysiol. 1992;68:1–8. doi: 10.1152/jn.1992.68.1.1. [DOI] [PubMed] [Google Scholar]
- Cossart R, Dinocourt C, Hirsch JC, Merchan-Perez A, De Felipe J, Ben-Ari Y, Esclapez M, Bernard C. Dendritic but not somatic GABAergic inhibition is decreased in experimental epilepsy. Nat. Neurosci. 2001;4:52–62. doi: 10.1038/82900. [DOI] [PubMed] [Google Scholar]
- Dickson CT, Mena AR, Alonso A. Electroresponsiveness of medial entorhinal cortex layer III neurons in vitro. Neuroscience. 1997;81:937–950. doi: 10.1016/s0306-4522(97)00263-7. [DOI] [PubMed] [Google Scholar]
- Doller HJ, Weight FF. Perforant pathway activation of hippocampal CA1 stratum pyramidale neurons: electrophysiological evidence for a direct pathway. Brain Res. 1982;237:1–13. doi: 10.1016/0006-8993(82)90553-4. [DOI] [PubMed] [Google Scholar]
- Du F, Whetsell WO, Jr., Abou-Khalil B, Blumenkopf B, Lothman EW, Schwarcz R. Preferential neuronal loss in layer III of the entorhinal cortex in patients with temporal lobe epilepsy. Epilepsy Res. 1993;16:223–233. doi: 10.1016/0920-1211(93)90083-j. [DOI] [PubMed] [Google Scholar]
- Du F, Eid T, Lothman EW, Kohler C, Schwarcz R. Preferential neuronal loss in layer III of the medial entorhinal cortex in rat models of temporal lobe epilepsy. J. Neurosci. 1995;15:6301–6313. doi: 10.1523/JNEUROSCI.15-10-06301.1995. [DOI] [PMC free article] [PubMed] [Google Scholar]
- Dudek FE, Hellier JL, Williams PA, Ferraro DJ, Staley KJ. The course of cellular alterations associated with the development of spontaneous seizures after status epilepticus. Prog. Brain Res. 2002;135:53–65. doi: 10.1016/S0079-6123(02)35007-6. [DOI] [PubMed] [Google Scholar]
- Dvorak-Carbone H, Schuman EM. Long-term depression of temporoammonic-CA1 hippocampal synaptic transmission. J. Neurophysiol. 1999;81:1036–1044. doi: 10.1152/jn.1999.81.3.1036. [DOI] [PubMed] [Google Scholar]
- Empson RM, Heinemann U. The perforant path projection to hippocampal area CA1 in the rat hippocampal-entorhinal cortex combined slice. J. Physiol. 1995;484:707–720. doi: 10.1113/jphysiol.1995.sp020697. [DOI] [PMC free article] [PubMed] [Google Scholar]
- Engel JJ. Introduction to temporal lobe epilepsy. Epilepsy Res. 1996;26:141–150. doi: 10.1016/s0920-1211(96)00043-5. [DOI] [PubMed] [Google Scholar]
- Fountain NB, Bear J, Bertram EH, 3rd, Lothman EW. Responses of deep entorhinal cortex are epileptiform in an electrogenic rat model of chronic temporal lobe epilepsy. J. Neurophysiol. 1998;80:230–240. doi: 10.1152/jn.1998.80.1.230. [DOI] [PubMed] [Google Scholar]
- Gloveli T, Schmitz D, Empson RM, Dugladze T, Heinemann U. Morphological and electrophysiological characterization of layer III cells of the medial entorhinal cortex of the rat. Neuroscience. 1997;77:629–648. doi: 10.1016/s0306-4522(96)00494-0. [DOI] [PubMed] [Google Scholar]
- Golding NL, Jung HY, Mickus T, Spruston N. Dendritic calcium spike initiation and repolarization are controlled by distinct potassium channel subtypes in CA1 pyramidal neurons. J. Neurosci. 1999;19:8789–8798. doi: 10.1523/JNEUROSCI.19-20-08789.1999. [DOI] [PMC free article] [PubMed] [Google Scholar]
- Herman ST. Epilepsy after brain insult: targeting epileptogenesis. Neurology. 2002;59:S21–S26. doi: 10.1212/wnl.59.9_suppl_5.s21. [DOI] [PubMed] [Google Scholar]
- Jung HY, Staff NP, Spruston N. Action potential bursting in subicular pyramidal neurons is driven by a calcium tail current. J. Neurosci. 2001;21:3312–3321. doi: 10.1523/JNEUROSCI.21-10-03312.2001. [DOI] [PMC free article] [PubMed] [Google Scholar]
- Klar M, Surges R, Feuerstein TJ. Ih channels as modulators of presynaptic terminal function: ZD7288 increases NMDA-evoked [3H]-noradrenaline release in rat neocortex slices. Naunyn Schmiedebergs Arch. Pharmacol. 2003;367:422–425. doi: 10.1007/s00210-003-0707-6. [DOI] [PubMed] [Google Scholar]
- Kobayashi M, Wen X, Buckmaster PS. Reduced inhibition and increased output of layer II neurons in the medial entorhinal cortex in a model of temporal lobe epilepsy. J. Neurosci. 2003;23:8471–8479. doi: 10.1523/JNEUROSCI.23-24-08471.2003. [DOI] [PMC free article] [PubMed] [Google Scholar]
- Leung LS, Roth L, Canning KJ. Entorhinal inputs to hippocampal CA1 and dentate gyrus in the rat: a current-source-density study. J. Neurophysiol. 1995;73:2392–2403. doi: 10.1152/jn.1995.73.6.2392. [DOI] [PubMed] [Google Scholar]
- Ludwig A, Budde T, Stieber J, Moosmang S, Wahl C, Holthoff K, Langebartels A, Wotjak C, Munsch T, Zong X, et al. Absence epilepsy and sinus dysrhythmia in mice lacking the pacemaker channel HCN2. EMBO J. 2003;22:216–224. doi: 10.1093/emboj/cdg032. [DOI] [PMC free article] [PubMed] [Google Scholar]
- Magee JC. Dendritic hyperpolarization-activated currents modify the integrative properties of hippocampal CA1 pyramidal neurons. J. Neurosci. 1998;18:7613–7624. doi: 10.1523/JNEUROSCI.18-19-07613.1998. [DOI] [PMC free article] [PubMed] [Google Scholar]
- Magee JC. Dendritic lh normalizes temporal summation in hippocampal CA1 neurons. Nat. Neurosci. 1999;2:508–514. doi: 10.1038/9158. [DOI] [PubMed] [Google Scholar]
- Magee JC. Voltage-gated ion channels in dendrites. In: Stuart GS, Hausser N, editors. Dendrites. Oxford: Oxford University Press; 2000. [Google Scholar]
- Magee JC, Carruth M. Dendritic voltage-gated ion channels regulate the action potential firing mode of hippocampal CA1 pyramidal neurons. J. Neurophysiol. 1999;82:1895–1901. doi: 10.1152/jn.1999.82.4.1895. [DOI] [PubMed] [Google Scholar]
- Mellor J, Nicoll RA, Schmitz D. Mediation of hippocampal mossy fiber long-term potentiation by presynaptic Ih channels. Science. 2002;295:143–147. doi: 10.1126/science.1064285. [DOI] [PubMed] [Google Scholar]
- Notomi T, Shigemoto R. Immunohistochemical localization of Ih channel subunits, HCN1–4, in the rat brain. J. Comp. Neurol. 2004;471:241–276. doi: 10.1002/cne.11039. [DOI] [PubMed] [Google Scholar]
- Pape HC. Queer current and pacemaker: the hyperpolarization-activated cation current in neurons. Annu. Rev. Physiol. 1996;58:299–327. doi: 10.1146/annurev.ph.58.030196.001503. [DOI] [PubMed] [Google Scholar]
- Poolos NP, Migliore M, Johnston D. Pharmacological upregulation of h-channels reduces the excitability of pyramidal neuron dendrites. Nat. Neurosci. 2002;5:767–774. doi: 10.1038/nn891. [DOI] [PubMed] [Google Scholar]
- Racine RJ. Modification of seizure activity by electrical stimulation. I. After-discharge threshold. Electroencephalogr. Clin. Neurophysiol. 1972;32:269–279. doi: 10.1016/0013-4694(72)90176-9. [DOI] [PubMed] [Google Scholar]
- Remondes M, Schuman EM. Direct cortical input modulates plasticity and spiking in CA1 pyramidal neurons. Nature. 2002;416:736–740. doi: 10.1038/416736a. [DOI] [PubMed] [Google Scholar]
- Robinson RB, Siegelbaum SA. Hyperpolarization-activated cation currents: from molecules to physiological function. Annu. Rev. Physiol. 2003;65:453–480. doi: 10.1146/annurev.physiol.65.092101.142734. [DOI] [PubMed] [Google Scholar]
- Santoro B, Chen S, Luthi A, Pavlidis P, Shumyatsky GP, Tibbs GR, Siegelbaum SA. Molecular and functional heterogeneity of hyperpolarization-activated pacemaker channels in the mouse CNS. J. Neurosci. 2000;20:5264–5275. doi: 10.1523/JNEUROSCI.20-14-05264.2000. [DOI] [PMC free article] [PubMed] [Google Scholar]
- van der Linden S, Lopes da Silva FH. Comparison of the electrophysiology and morphology of layers III and II neurons of the rat medial entorhinal cortex in vitro. Eur. J. Neurosci. 1998;10:1479–1489. doi: 10.1046/j.1460-9568.1998.00162.x. [DOI] [PubMed] [Google Scholar]
- Van Welie I, Van Hooft JA, Wadman WJ. Homeostatic scaling of neuronal excitability by synaptic modulation of somatic hyperpolarization-activated Ih channels. Proc. Natl. Acad. Sci. USA. 2004;101:5123–5128. doi: 10.1073/pnas.0307711101. [DOI] [PMC free article] [PubMed] [Google Scholar]
- Varga AW, Anderson AE, Adams JP, Vogel H, Sweatt JD. Input-specific immunolocalization of differentially phosphorylated Kv4.2 in the mouse brain. Learn. Mem. 2000;7:321–332. doi: 10.1101/lm.35300. [DOI] [PMC free article] [PubMed] [Google Scholar]
- Wang Z, Xu NL, Wu CP, Duan S, Poo MM. Bidirectional changes in spatial dendritic integration accompanying long-term synaptic modifications. Neuron. 2003;37:463–472. doi: 10.1016/s0896-6273(02)01189-3. [DOI] [PubMed] [Google Scholar]
- White HS. Animal models of epileptogenesis. Neurology. 2002;59:S7–S14. doi: 10.1212/wnl.59.9_suppl_5.s7. [DOI] [PubMed] [Google Scholar]
- Williams SR, Stuart GJ. Site independence of EPSP time course is mediated by dendritic I(h) in neocortical pyramidal neurons. J. Neurophysiol. 2000;83:3177–3182. doi: 10.1152/jn.2000.83.5.3177. [DOI] [PubMed] [Google Scholar]
- Witter MP, Wouterlood FG, Naber PA, Van Haeften T. Anatomical organization of the parahippocampal-hippocampal network. Ann. N Y Acad. Sci. 2000;911:1–24. doi: 10.1111/j.1749-6632.2000.tb06716.x. [DOI] [PubMed] [Google Scholar]
- Wu K, Leung LS. Increased dendritic excitability in hippocampal ca1 in vivo in the kainic acid model of temporal lobe epilepsy: a study using current source density analysis. Neuroscience. 2003;116:599–616. doi: 10.1016/s0306-4522(02)00567-5. [DOI] [PubMed] [Google Scholar]
- Yeckel MF, Berger TW. Monosynaptic excitation of hippocampal CA1 pyramidal cells by afferents from the entorhinal cortex. Hippocampus. 1995;5:108–114. doi: 10.1002/hipo.450050204. [DOI] [PubMed] [Google Scholar]
Associated Data
This section collects any data citations, data availability statements, or supplementary materials included in this article.