

Abstract
Quantitative analysis of most positron emission tomography (PET) data requires arterial blood sampling and dynamic scanning when the radioligand is administered as a bolus injection. Less invasive studies can be accomplished if the radioligand is administered as a bolus plus constant infusion (B/I). The purpose of the current study was to evaluate a B/I paradigm for quantifying high affinity nicotinic acetylcholine receptors (nAChRs) with PET and 2-[18F]F-A85380 (2FA). Seven volunteers underwent a study in which 2FA was administered as a bolus injection and another study in which the 2FA was administered by B/I (Kbolus = 500 min). We evaluated the feasibility of using scans of a 2 h duration starting 6 h after the start of the 2FA administration and data from venous blood. Radioactivity in the brain and in arterial and venous plasma reached steady state by 6 h. Volumes of distribution (VT) calculated from the ratio of radioactivity in the brain areas of interest to the radioactivity corresponding to unbound, unmetabolized 2FA in venous plasma at steady state in the B/I studies were very similar to those calculated from time activity curves of unbound, unmetabolized 2FA in arterial plasma and regional brain radioactivity from 8-h dynamic scans after bolus administration of 2FA. The results of repeated PET studies with 2FA showed a high reproducibility of VT measurements. We conclude that B/I methodology will be useful for clinical and research studies of brain nAChRs.
Introduction
The α4β2* subtype of high affinity nicotinic acetylcholine receptors (nAChRs) are the most abundant nAChRs in the mammalian brain (Lindstrom et al., 1995). These receptors are involved in many neuropathological states including tobacco dependence, as well as in modulating neurotransmission under physiological conditions (Mihailescu and Drucker-Colin, 2000). Therefore, the ability to quantify nAChRs in vivo may be useful for elucidating their role in these processes. The first PET radioligand that allows visualization and quantification of nAChRs in humans is 2-[18F]F-A-85380 (2FA). PET studies in humans and non human primates acquired following a bolus administration of 2FA have been particularly successful in imaging and quantifying nAChRs in vivo (Chefer et al., 2003; Gallezot et al., 2005; Herzog et al., 2006; Kendziorra et al., 2006; Kimes et al., 2003; Kimes et al., 2006; Meyer et al., 2006a; Meyer et al., 2006b; Mitkovski et al., 2005; Picard et al., 2006). Reliably quantifying these receptors in human brain requires arterial blood sampling, and long scan times are necessary to quantify them in brain regions that contain high densities (e.g., thalamus). Avoiding arterial blood sampling would be feasible if there were a suitable reference region for analysis. However, even the use of the corpus callosum, which has a very low density of nicotinic receptors, is problematic in smokers either because specific binding in this region or spillover from other brain regions is not trivial in smokers (Brody et al., 2006).
Theoretically, accurate quantification of nicotinic receptors in human brain with 2FA requires arterial blood sampling for the entire scanning period. One way to avoid the need for arterial blood and/or a reference region is to use a bolus plus constant infusion (B/I) method of radioligand administration and venous blood instead of arterial blood.
The use of B/I methodology has been validated for in vivo studies of various neuroreceptors with a number of PET and SPECT radioligands (e.g., cyclofoxy (Carson et al., 1993), raclopride (Ito et al., 1998), iomazenil (Abi-Dargham et al., 1994), altanserin (Pinborg et al., 2003)) Quantifying nAChRs with PET and 2FA by the B/I method has been validated in rats (Vaupel et al., 2007). Although this methodology has been used for PET studies with 2FA in humans, (Brody et al., 2006), it remains to be validated for this purpose.
In theory, there are several advantages to using B/I administration of 2FA instead of a single bolus injection for quantifying brain nAChRs in humans. Major benefits of the B/I method are a shorter scanning period because acquiring data from the beginning of the radioligand administration period is unnecessary, and the ability to replace continuous arterial blood sampling with the collection of a few venous blood samples obtained 6–8 hours after the start of 2FA administration. Additional advantages of B/I administration are: 1) a greater concentration of unmetabolized radioligand in the blood and brain during the last hours of scanning compared to bolus administration for doses that produce equivalent radiation exposure to the volunteer; 2) data analysis is independent of the compartmental organization of brain regions; 3) modeling is unnecessary, as a simple ratio of concentration in the tissue to that in venous plasma at equilibrium yields total volume of distribution (VT). Finally, this method offers a simple and very sensitive tool for studying dynamic changes in receptor occupancy (Brody et al., 2006).
The advantages of B/I method are realized most if the appropriate ratio of the dose administered as a bolus injection to that administered as continuous infusion is used. Conversely, the use of an inappropriate dose ratio and data collection only over a predetermined time interval could lead to serious errors in VT measurements.
Kbolus, a frequently used parameter, characterizes the ratio of the bolus dose to the infusion dose. Kbolus is defined as the time required to infuse an amount of radioligand equal to that administered as a bolus. The dependence of the time (T*) to approach the steady-state concentration of radioligand in the blood or brain area on the value of Kbolus is described by a U-shaped function. The coordinates of the minimum values for T* could differ for different brain regions and could be distinct from that of blood. In general, the coordinates for these minima for the blood and brain regions depend on the rate of elimination of the radioligand from the blood. In addition, the coordinates of the minima for each brain region depend on the clearance of radioactivity from the specific region as well. Therefore, a goal in developing B/I protocols is to determine a single Kbolus that could be useful for the entire set of brain regions to be analyzed and for most, if not all, individuals being tested.
The goal of the current study was to evaluate B/I administration of 2FA for nAChR quantification with PET in human volunteers. The bolus to infusion dose ratio (Kbolus) was chosen to approach steady state conditions between the plasma and tissue compartments as quickly as possible for diverse VT values. As a potential future application of a B/I protocol for 2FA is the investigation of brain nicotinic receptors in nonsmokers and in smokers, participants from both groups were included in this study. We expected that smokers would exhibit higher VT values than nonsmokers and could possibly show different 2FA pharmacokinetics as well. Therefore, we evaluated the applicability of this calculated Kbolus by determining its utility in multiple brain regions regardless of their VT and in human volunteers who had potential variations in pharmacokinetics or maximum VT. We performed two PET studies, one with bolus administration of 2FA and the other with B/I administration of 2FA, in seven volunteers, four of whom were smokers and compared VT values obtained by these methods. We determined the time required for the radioligand to reach a steady state in arterial blood and brain after B/I administration of 2FA. Finally, we obtained a preliminary estimate of test/retest variability of the B/I method of 2FA administration in three volunteers.
Methods
The Institutional Review Board of National Institute on Drug Abuse (NIDA) Intramural Research Program approved the design of this study. Administration of the radioligand to the human volunteers was performed under an Investigational New Drug (IND) application to the Food and Drug Administration (FDA)
Participants
Healthy volunteers (n = 8, 2 female, 4 African American, 19–45 yr; 4 smokers) participated in two or three scanning procedures at least 4 weeks apart. Volunteers were recruited through newspaper and television advertisements as well as by word of mouth. Participants were excluded for IQ < 80 (Shipley Institute of Living Scale) (Zachary, 1986), current [SCL-90 (Derogatis et al., 1973)], or past psychopathology [Diagnostic Interview Schedule for DSM-IV (DIS-IV) (Robins et al., 1995)], and/or evidence of acute or chronic medical problems (as assessed by medical history, physical examination, and routine blood screen). Potential participants were also excluded for significant drug use history (30 times ever and/or more than 10 times within the last 10 years of any single illicit substance except marijuana)), more than moderate drinking (e.g., > fourteen alcohol containing drinks/week), more than moderate caffeine consumption (e.g., > 500 mg of caffeine/day and/or > two marijuana cigarettes/month. Smokers were abstinent from smoking at least 36 h before each scan (~15 half lives for nicotine). Participants arrived the day before the scan and spent the night on a supervised ward. Smoking abstinence was established by participant self-report and confirmed by CO monitoring upon arrival to the unit and again 2–3 h before the PET scan. CO levels ranged from 0 to 3 ppm on the morning of the scan. Upon arrival, participants gave a urine sample, which was tested for illicit drugs, and underwent a breathalyzer test to confirm that they were not intoxicated. Blood samples were obtained for routine serum chemistry and hematology tests and to rule out current pregnancy (females). Results of blood tests, vital signs and a 12-lead ECG on the morning of the scan confirmed the current health status. All participants gave written informed consent after receiving an explanation of the study and its procedures.
Procedures
Radiochemistry
2FA injection was prepared by a semi-automated modification of a previously described method (Horti et al., 1998), and formulated as a sterile, apyrogenic solution in saline. The radiochemical purity of 2FA was >95%.
PET Scans
2FA was administered as a bolus to seven volunteers. At least four weeks later, the same seven volunteers underwent a B/I study. Two of these volunteers underwent a second B/I study. One additional volunteer, who did not undergo a bolus study, underwent two B/I studies. PET images were acquired with a Siemens ECAT Exact HR+ scanner in 3D mode yielding 63 contiguous transaxial slices, with a 15.5-cm field of view, and a 4.6-mm transaxial reconstructed resolution at the center of the field of view. Scanning continued for 8 h, with breaks as needed for the participant to void and have lunch and low-fat snacks. Most participants required 3–5 breaks over the scanning period. To alleviate boredom, participants were allowed to watch movies on a computer monitor. An individually molded thermoplastic mask was used to reduce head motion and to facilitate repositioning after breaks. The participant’s head was aligned to the cantomeatal line in the scanner.
Scan 1: Bolus administration of 2FA
After a transmission scan, dynamic PET scans and arterial blood collection commenced with the bolus administration of 2FA (1.65–2.61 MBq/kg, 0.045–0.071 mCi/kg). The specific activity of 2FA at the time of administration ranged from 134 to 754 GBq/μmol (3.6 to 20.5 Ci/μmol). The administered dose ranged from 3 to 12 pmol/kg.
Scan 2: Bolus plus Infusion of 2FA
After a transmission scan, dynamic PET scanning and arterial blood collection commenced with the bolus component of the 2FA administration, which was followed by the infusion phase using a Harvard 2 clinical pump (Harvard Clinical Technology, Inc., South Natick, MA). The total effective dose administered in these studies ranged from 0.99–2.83 MBq/kg (0.027 to 0.077 mCi/kg). The specific activity of 2FA at the time of administration ranged from 158 to 755 GBq/μmol (4.3 to 20.4 Ci/μmol). The administered dose ranged from 3 to 21 pmol/kg. For five participants in B/I studies, we collected venous and arterial blood. For the remaining participants, we obtained only venous blood.
Determination of Kbolus
Kbolus is defined as the time required to infuse (at a constant rate) the same amount of radioligand as administered as a bolus. The Kbolus was determined using data from four nonsmokers and two smokers acquired in previously reported studies in which 2FA was administered as a bolus (Kimes et al., 2003; Kimes et al., 2006). We determined that the optimal value for Kbolus was 500 min, which resulted in the desired equilibrium between blood and brain within 6–8 h. Using this Kbolus, the dose for the bolus part of the study was 1.04 times the dose of the infusion part (480 min). In practice, some of the radioactivity in the syringe decayed before being administered to the participant during the infusion. Therefore, the actual dose of radioactivity received by the participants as an infusion was less than 1/3rd of the nominal dose. For example, for a participant who received a total effective dose of 185 MBq, 142 MBq was administered as a bolus and 136 MBq (142 MBq/500 min)*480 min), decay-corrected to the beginning of administration, was administered by constant infusion. Because of decay, the true amount of radioactivity infused was 43 MBq.
Measurement of the concentration of unbound, unmetabolized 2FA in plasma
Twenty-two blood samples of 3 ml each were taken from the radial artery (bolus studies) and from the radial artery and antecubital vein (contralateral to the injection site) or only from the vein (in B/I studies) at predetermined intervals over 7–8 hours after the start of the 2FA injection and dispensed into heparinized tubes stored on ice. Following centrifugation at 3000g for 10 minutes, plasma radioactivity was measured in a single detector gamma-counter (Cobra, Packard Instruments, Meriden, CT). Additionally, a baseline blood sample (usually venous) was acquired from each participant before 2FA injection to determine the binding of 2FA to plasma protein and to prepare standards for solid phase extraction (SPE). Plasma protein binding of 2FA was determined by ultrafiltration with a Centricon YM-10 filtration device (Millipore Corp., Bedford, MA). Unmetabolized 2FA was determined by SPE using clean screen extraction columns (United Chemical Technologies, Bristol, PA) (Shumway et al., 2007).
Structural Magnetic Resonance Images (MRIs)
T1-weighted structural MRIs were obtained for all participants on a Siemens Allegra (3T) scanner (Erlangen, Germany) for anatomical reference (1-mm3 isotropic voxels, TR = 2.5 s, TE = 4.38 ms, FA = 8).
VOI Data Analysis
Data from the PET scans were transformed in the manner described below to obtain time activity curves (TACs) for each of the following brain regions: thalamus, pons, midbrain, cerebellum, putamen, frontal cortex and corpus callosum. For the analysis method described herein, region of interest (ROI) refers to the structure in 2-dimensional space (e.g., on a slice) and volume of interest (VOI) refers to the structure in 3-dimensional space (i.e., sum of ROIs). Dynamic frames were motion and decay corrected and then combined into one set of dynamic images, which was averaged over time (0–480 min). Each participant’s MRI was coregistered to his/her average PET images. Templates for each of the seven structures were drawn bilaterally on 2–4 adjacent sections of the MRI from a representative participant. This standard template was copied to each participant’s MRI and the position was adjusted if necessary without resizing. The adjusted template was applied to the respective dynamic PET images. The value for radioactivity in each structure at each time point for each participant is the average of all pixels in all ROIs yielding a VOI for each structure. This process yielded TACs for each structure for each participant for each study (bolus and B/I). PMOD (v. 2.7, PMOD Technologies Ltd., Zurich, Switzerland) was used to calculate VT in the VOIs and parametric maps (see below). For the bolus study, VT for each structure was determined by classic Logan analysis (Logan et al., 1990), one-tissue compartment model (1TCM) and two-tissue compartment model (2TCM). For the B/I studies, VT for each structure was calculated as the ratio of the average radioactivity in each VOI at steady state (i.e., 6–8 h) to the average radioactivity corresponding to free unmetabolized 2FA in either venous or arterial plasma (also 6–8 h).
Parametric Maps
For the bolus study, parametric VT maps were generated using classic Logan analysis (Logan et al., 1990) and Ichise multilinear regression analysis (MA1) (Ichise et al., 2002) using PMOD. For both methods the arterial input function for free unmetabolized 2FA was used. Parametric VT maps from B/I studies were generated by dividing the radioactivity in each pixel of the set of average images obtained from 6 to 8 h after the start of 2FA administration for each participant by the average radioactivity corresponding to free unmetabolized 2FA in plasma samples collected from 6–8 h. Parametric VT maps from each B/I study were coregistered to respective parametric maps (PM) from the bolus study (classic Logan model). For the bolus study, each individual’s PM was aligned to the parametric map of a randomly chosen volunteer and then the aligned maps were averaged. This averaged PM was used for a second alignment of the individual PMs. This second alignment algorithm was then applied to the MA1-modeled images and to the PMs from the B/I studies. The final Logan method PMs for each of the seven participants were averaged (averaged Logan PM) as were those obtained by the MA1 method (averaged MA1 PM) and from the B/I studies (averaged B/I PM). The result was three averaged PMs (one for each modeling procedure) all aligned to each other. The image sets from each participant were not transformed into a standard coordinate space. The sets of average images were compared to obtain differences maps.
Measurement of VT of the entire brain for each participant using parametric maps
An overall average parametric map from the averaged Logan PM, averaged MA1 PM and averaged B/I PM was obtained. An ROI of the entire brain was drawn on each slice of this parametric map. This ROI template was applied to the parametric maps from each participant for each modeling procedure to obtain average VT value for the entire brain (three values for each participant). These average values for each participant (n=7) were averaged to yield one mean VT ± SEM for each of the three modeling procedures (Logan, MA1 and B/I).
Results
Time course of concentration of radioactivity in brain regions and plasma after bolus and bolus/infusion administration
For the bolus administration studies, radioactivity in the plasma peaked immediately after the 2FA injection and declined steadily for the remainder of the study as expected (Fig. 1A). The TACs for the radioactivity in the various VOIs peaked between one and three hours and declined steadily thereafter (Fig. 1A). Fig. 1B shows the curves predicted for the brain regions and plasma if the 2FA had been administered by B/I using a Kbolus of 500 min. The curves in Fig. 1C are based on actual data from the B/I study in the same volunteer and agreed well with the predicted curves. The average areas under the predicted curves deviated from those actually measured by 3 ± 6% (mean ± SD) and the VT values calculated from the predicted curves agreed well with those calculated from B/I experimental data. The mean deviation was 3 ± 5% (± SD).
Figure 1.

Panel A Time activity curves (TACs) from bolus study of a representative volunteer. Panel B Predicted TACs (dashed lines) for B/I study if Kbolus = 500 min. Panel C TACs from the B/I study on the same volunteer. Curves are provided for thalamus (blue), pons (yellow), midbrain (pink), cerebellum (aqua), frontal cortex (brown), putamen (green), corpus callosum (gray), and radioactivity corresponding to unmetabolized 2FA in blood plasma (red). Radioactivity values are given as standard uptake values (SUV).
2FA radioactivity in venous vs. arterial blood plasma
For five B/I studies, we collected both venous and arterial blood. In each of these studies, the TACs for the percent of radioactivity in blood plasma that corresponded to unmetabolized 2FA in venous and arterial plasma collected from 5–8 h after the start of 2FA administration were very similar (Fig. 2A). Furthermore, the average percent of radioactivity corresponding to unmetabolized 2FA in venous and arterial plasma for samples collected between 5 h and 8 h after the start of the 2FA administration was almost identical for each of these 5 volunteers (Fig. 2A insert).
Figure 2.

Time course of arterial and venous plasma radioactivity during B/I studies (data are given as mean ± SEM, n = 5). (A) Radioactivity corresponding to unmetabolized 2FA expressed as a percent of total plasma radioactivity (open squares = arterial plasma, filled squares = venous plasma). The insert shows the unmetabolized 2FA in arterial (white bars) and venous plasma (black bars) at 6.5 h after start of 2FA injection, expressed as a percent of total plasma radioactivity for each of five participants (#1, #2, #3, #4 and #5). Values given are the average of the last seven blood samples collected (5–8 h after the start of 2FA administration). (B) Total arterial (open circles) and venous (filled circles) plasma radioactivity along with radioactivity corresponding to unbound unmetabolized 2FA in arterial (open squares) and venous (filled squares) plasma, expressed as standard uptake values (SUV) from the same five B/I studies shown in Figure 2A. The insert shows the average concentration of unbound unmetabolized 2FA in arterial (white bars) and venous (black bars) plasma expressed as SUV for each of five participants (#1, #2, #3, #4 and #5). Values given are the average of the last 7 blood draws (5–8 h after the start of 2FA administration).
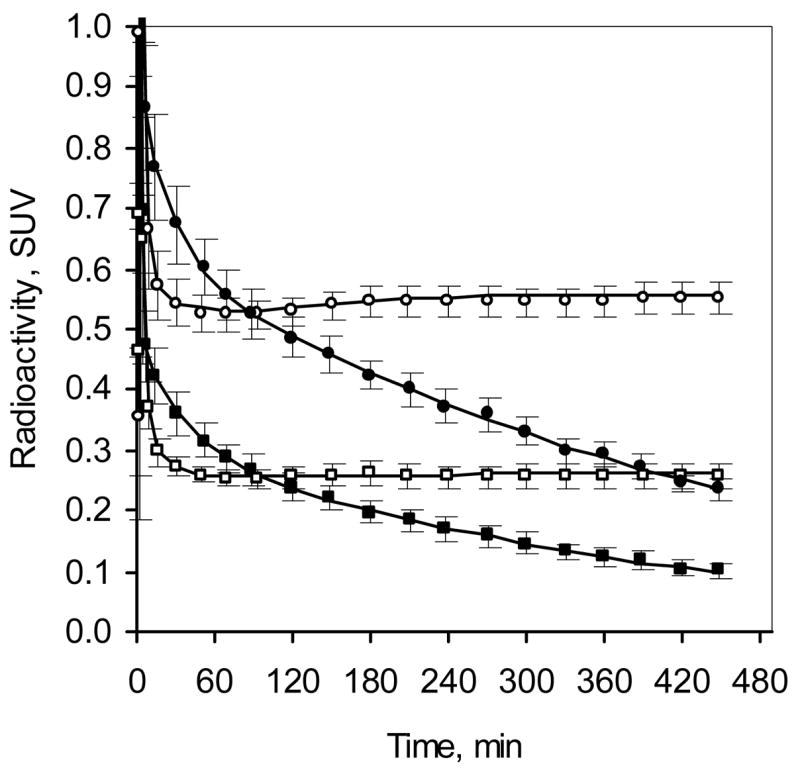
The average total radioactivity and the average radioactivity corresponding to the unmetabolized fraction of 2FA, presented as standard uptake values (SUV) (Bergström et al., 2003) for arterial and venous plasma during B/I studies (n = 5), show convergence starting at 4 h after the start of 2FA administration (Fig. 2B). Importantly, the average concentration of unmetabolized 2FA expressed as SUV for the time points from 5–8 h after the start of 2FA administration in arterial plasma was almost identical to that in venous plasma for each of the participants (Fig. 2B insert). Therefore, measures of unmetabolized 2FA from venous blood from 5–8 h after the beginning of 2FA administration can be used in lieu of those from arterial blood to calculate VT.
Radioactivity in brain and blood plasma – bolus vs. bolus plus infusion administration of 2FA
As predicted, the concentration of total radioactivity and unbound, unmetabolized 2FA in plasma for the last two h of the study (6–8 h after radioligand administration) expressed as SUV showed that a substantial increase in signal (more than 2-fold) was obtained by using a B/I administration compared to using a bolus administration (Figs. 3 and 4). Likewise, the average concentrations of radioactivity in the various VOIs during the same time period in the B/I studies are almost 2-fold those observed in the bolus studies (Fig. 4).
Figure 3.
Comparison of plasma radioactivity after bolus and B/I administration of 2FA (mean ± SEM, n = 7). Time course of total radioactivity (circles) and radioactivity corresponding to unbound unmetabolized 2FA (squares) in B/I study (venous plasma, open symbols) and bolus study (arterial plasma, filled symbols).
Figure 4.
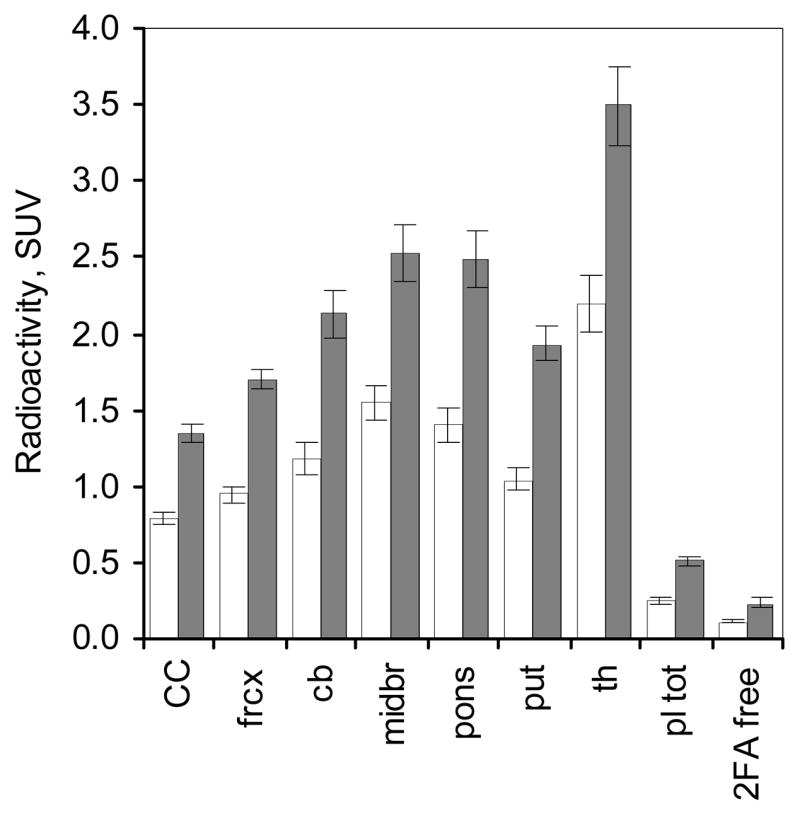
Radioactivity in various brain regions given as mean ± SEM of standard uptake values (SUV) obtained from 6 to 8 h after the start of 2FA administration. White bars and black bars represent data from the bolus studies (n = 7) and from the B/I studies (same n=7), respectively. Abbreviations: CC – corpus callosum, frcx – frontal cortex, cb - cerebellum, midbr – midbrain, pons – pons, put- putamen and th – thalamus, pl tot – total radioactivity in arterial (bolus study) or venous plasma (B/I study), 2FA free – unbound, unmetabolized 2FA in arterial (bolus study) and venous plasma (B/I study).
Steady state in blood and brain
The goal of the B/I paradigm is to reach equilibrium among all the compartments in the brain and between the brain and the arterial blood as soon as possible. We assumed this equilibrium was reached when the concentration of unbound, unmetabolized 2FA in arterial plasma and the concentration of radioactivity in the assayed brain regions reached steady state. At 4 h after the start of the 2FA administration, the concentration of free 2FA in the arterial plasma overestimated the value observed at 7.5 h by 2 % (Fig. 5A). At the same time, the radioactivity in the cerebellum, putamen, pons, corpus callosum, midbrain and thalamus underestimated the steady state values by 3%, 2%, 2%, 7%, 8% and 8%, respectively (Fig. 5 C–I). By 6.5 h after the start of 2FA administration, radioactivity in all VOIs underestimated steady state values by 2% or less (Fig. 5C–I).
Figure 5.

Time required for plasma or tissue radioactivity to reach steady state. Values are expressed as percent of average of values obtained from 7–8 h after the start of the B/I administration of 2FA Data are given as mean ± SEM for n = 7.
VOI analyses of VT
We used three methods to calculate VT for each VOI in the bolus studies and compared those values to the ones obtained in the B/I studies. Utilizing an arterial input function (free unmetabolized 2FA) yielded similar results for the bolus studies regardless of the method used (1TCM, 2TCM, or classic Logan graphical analysis), but the 2TCM values tended to be higher.
The mean VT values for the seven VOIs obtained from the bolus and B/I studies are shown in Fig. 6. Although the 2TCM tended to yield greater values for VT, the values for the bolus study with 2TCM analysis and the values from the B/I study were not significantly different (p > 0.1). Based on the values obtained in the B/I studies, the average percent underestimation was 1% compared to the 1TCM values (Table 1A) and Logan graphical method values (Table 1C) and 4% for the 2TCM values (Table 1B). The average absolute deviation for all VOIs (either over- or underestimation) between bolus by any analytical method and B/I was 7–8% (Table 1). Furthermore, the regional average absolute deviation was less than or equal to 11%. Thus, there is good agreement between the values obtained in the B/I study with each of the three methods of analysis for the bolus study. This agreement suggests that the reproducibility of a given measurement in a given region with this radioligand is reasonably good regardless of the analysis method, including B/I. These findings also suggest that repeated studies using the same 2FA administration paradigm and same analysis method will yield coefficients of variation (CV) that are similar to or less than those obtained using two different 2FA administration methods. In support of this assertion is the finding that the CV was 6% or less depending on the region assayed when we performed two B/I studies on three volunteers (Table 2).
Figure 6.
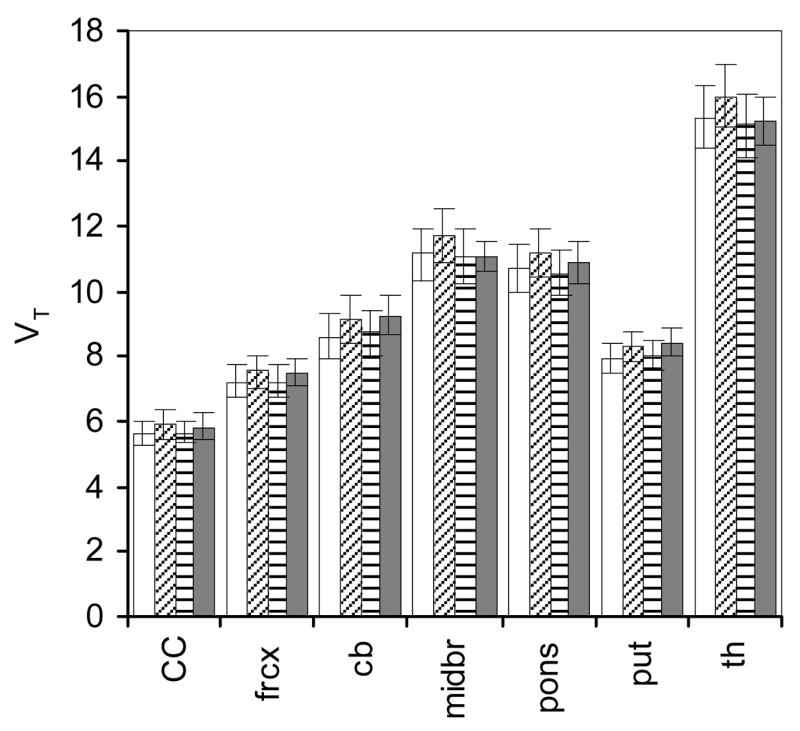
Comparison of the total volume of distribution (VT, mean ± SEM) in various brain regions. Data were acquired from seven volunteers in a B/I study and the same volunteers in a bolus study. VT from the bolus administration studies were calculated by the one tissue compartment model (white bars), two tissue compartment model (diagonally striped bars), and Logan graphical analysis (horizontally striped bars), all using the arterial input function. VT from the B/I studies (black bars) were calculated as a ratio of radioactivity in each brain region at steady state to the radioactivity corresponding to unbound, unmetabolized 2FA in venous plasma at steady state. The abbreviations are as in Fig.4. See Table 1 for comparisons of data from B/I study and bolus study for each participant..
Table 1.
Percent deviation of VT values obtained in bolus administration studies from those in B/I studies when results from bolus studies were analyzed using: One Tissue Compartment Model (1A), Two Tissue Compartment Model (1B) and Logan Graphical Analysis (1C).
| 1A | ||||||||
|---|---|---|---|---|---|---|---|---|
| Subject # | Corpus Callosum | Frontal Cortex | Cerebellum | Midbrain | Pons | Putamen | Thalamus | Average |
| #1 | 6% | 9% | 6% | 12% | 8% | 6% | 16% | |
| #2 | −12% | −6% | −15% | −10% | −9% | −12% | −7% | |
| #3 | 11% | −10% | −6% | −8% | −4% | 0% | −12% | |
| #4* | −7% | −4% | −11% | −3% | −7% | −7% | −4% | |
| #5* | −7% | −6% | −7% | 1% | 9% | −10% | 3% | |
| #6* | −4% | 2% | −14% | 14% | 3% | −5% | 15% | |
| #7* | 7% | 1% | 12% | 12% | 2% | 2% | 11% | |
| Average deviation | −1% | −2% | −5% | 3% | 0% | −4% | 3% | −1% |
| Average absolute deviation | 8% | 5% | 10% | 9% | 6% | 6% | 10% | 8% |
| 1B | ||||||||
| Subject# | Corpus Callosum | Frontal Cortex | Cerebellum | Midbrain | Pons | Putamen | Thalamus | Average |
| #1 | 4% | 15% | 12% | 17% | 12% | 14% | 20% | |
| #2 | −2% | −1% | −5% | −6% | 1% | −6% | 0% | |
| #3 | 17% | −7% | −4% | −5% | −3% | 2% | −10% | |
| #4* | −4% | −2% | −8% | 0% | −4% | −11% | 0% | |
| #5* | −5% | −1% | −4% | 6% | 14% | −6% | 8% | |
| #6* | −1% | 6% | −5% | 19% | 7% | 1% | 20% | |
| #7* | 15% | 6% | 20% | 20% | 5% | 8% | 15% | |
| Average deviation | 3% | 2% | 1% | 7% | 5% | 0% | 8% | 4% |
| Average absolute deviation | 7% | 6% | 8% | 11% | 7% | 7% | 10% | 8% |
| 1C | ||||||||
| Subject# | Corpus Callosum | Frontal Cortex | Cerebellum | Midbrain | Pons | Putamen | Thalamus | Average |
| #1 | 1% | 7% | 4% | 6% | 3% | 6% | 8% | |
| #2 | −5% | −3% | −10% | −9% | −5% | −7% | −5% | |
| #3 | 12% | −10% | −8% | −9% | −6% | −1% | −15% | |
| #4* | −11% | −5% | −11% | −5% | −10% | −12% | −6% | |
| #5* | −2% | −4% | −6% | 1% | 11% | −6% | 5% | |
| #6* | −8% | 0% | −9% | 13% | 1% | −3% | 14% | |
| #7* | 9% | 0% | 11% | 14% | −1% | 3% | 9% | |
| Average deviation | −1% | −2% | −4% | 1% | −1% | −3% | 2% | −1% |
| Average absolute deviation | 7% | 4% | 8% | 8% | 5% | 5% | 9% | 7% |
- smoker
Table 2.
Test-Retest for Total Volumes of Distribution, Bolus/Infusion with venous blood, (n = 3)
| Subject # | Session | Corpus Callosum | Frontal Cortex | Cerebellum | Midbrain | Pons | Putamen | Thalamus |
|---|---|---|---|---|---|---|---|---|
|
#1 |
1
2 deviation* |
4.5
4.8 3% |
5.5
5.7 1% |
6.7
7.0 2% |
9.6
9.1 3% |
9.6
9.0 4% |
6.9
6.8 1% |
12.5
10.9 7% |
|
#3 |
1
2 deviation |
4.1
5.2 11% |
6.3
6.6 3% |
6.7
6.8 1% |
9.4
9.3 0% |
8.5
9.0 3% |
6.8
7.0 2% |
15.5
13.8 6% |
|
#8 |
1
2 deviation |
4.6
4.9 3% |
6.4
6.8 3% |
8.3
8.5 1% |
10.4
10.2 1% |
9.4
9.6 1% |
7.3
7.9 3% |
15.6
15.7 0% |
| average deviation | 6% | 2% | 1% | 1% | 2% | 2% | 4% | |
| CV | 6% | 2% | 1% | 2% | 2% | 2% | 4% | |
% deviation from average of 2 studies
Parametric maps of VT
A parametric map of data from a representative B/I study performed in a nonsmoker is shown in Fig. 7. This map was obtained from the ratio of the average radioactivity in each brain voxel to average concentration of free 2FA in venous plasma samples (average of frames and blood acquired from 6–8 h after the start of the 2FA administration). These data show the expected distribution of nAChRs (e.g., highest in thalamus, intermediate in midbrain and cerebellum and lowest in corpus callosum). Intermediate values for VT were also observed for some white matter regions such as the internal capsule.
Figure 7.

Images from a representative volunteer (nonsmoker). Top panel – MRI scans, Middle panel - parametric maps of total volumes of distribution (VT) from the bolus plus infusion study (B/I) using 2FA concentrations from venous plasma, Bottom panel – fused MRI and VT images.
Average parametric maps obtained from bolus studies using classic Logan analysis and from B/I studies in seven volunteers are shown in Fig. 8 (top two panels). The B/I map and the map of the Logan analysis are nearly identical in the relative VT and in the image quality. The map of the difference between these methods shows a random distribution of values and that difference (B/I –Bolus with Logan analysis) was slightly above zero (Fig. 8, second panel from bottom). The figure insert provides the average of the VT for the entire brain for the seven subjects in the B/I study, the bolus study with Logan analysis and the bolus study with MA1 analysis. Based on the values obtained in the B/I study, Logan analysis of the bolus study yielded approximately an 8% underestimation of average VT. This underestimation may reflect the previously observed underestimation of VT that has been attributed to statistical noise in this graphical analysis method (Slifstein and Laruelle, 2000).
Figure 8.

Average parametric maps (n = 7) of total volume of distribution (VT) obtained by different methods. Average parametric maps in each row are shown in axial, saggital and coronal planes (from left to right) at the level of the thalamus. From top to bottom: bolus/infusion study (B/I), bolus study using classic Logan analysis, bolus study using MA1 analysis, difference between the B/I map and classic Logan analysis map of bolus study and between the B/I map and the MA1 analysis map of the bolus study. The insert provides the mean (± SEM, n = 7) VT values for the entire brain for the B/I study, the bolus study with Logan analysis and the bolus study with Ichise analysis. Note that the scale for the difference maps is expanded.
We also analyzed the data from the bolus studies using the MA1 graphical method (Ichise et al., 2002) as this analysis method was designed to remove the above mentioned systematic underestimation. This analysis also produced parametric maps that were very similar to those from the B/I studies, and the average VT values for the entire brain for the seven subjects using MA1 analysis in the bolus studies and B/I studies were almost identical (Fig. 8, insert). Nonetheless, MA1 analysis gave somewhat higher VT values (up to 5%) for those regions with high receptor densities (e.g., thalamus). Difference maps between B/I studies and bolus with MA1 analysis reflect this overestimation of VT in thalamus and internal capsule (Fig. 8, bottom panel).
To illustrate the differences among the methods, scatter plots of VT for each of 166208 voxels from the average images for each analysis method are shown in Fig. 9. The scatter plot in Fig. 9A compares the B/I method with the Logan method. The linear regression line shows the strong linear correlation (r2 = 0.90) between these two methods, but the slope of the line (0.93) reflects the systematic underestimation of VT throughout the brain. The scatter plot in Fig. 9B compares the B/I method with the MA1 analysis. In this comparison, the linear regression line has a slope of 1, but shows a correlation that is slightly less (r2 = 0.86) than that obtained in Fig. 9A. These findings are similar to the observations of Ichise et al. (2002), who suggested that MA1 decreases the noise-induced bias at the expense of increased variability.
Figure 9.

Scatter plots comparing values for VT from each voxel from averaged images (see Figure 8). (A) Averaged parametric maps from bolus plus constant infusion study (B/I) vs. averaged parametric maps from bolus study with classic Logan analysis (Logan). The slope of the line is 0.93. (B) Averaged parametric maps from bolus study with MA1 (Ichise) analysis. The slope of the line is 1.01
Discussion
In this study, we showed that the VT of 2FA, which interacts with nAChRs, can be reliably determined with PET using B/I methodology and the concentration of unbound, unmetabolized radioligand in venous blood. As mentioned in the introduction, the B/I method provides several advantages over the bolus administration of the respective radioligand both in terms of comfort for the research participant and invasiveness and simplicity of the methods. Furthermore, once steady state is reached, additional perturbations of the system (e.g., release of endogenous neurotransmitter) can be measured within a single study.
The current study extends this body of knowledge and shows that use of B/I administration of 2FA and venous blood sampling provides a simplified method for obtaining values of VT. Specifically, we showed using B/I studies, that radioactivity corresponding to free, unmetabolized 2FA obtained from venous blood samples can be used instead of values from arterial samples and that radioactivity in brain and blood is ~2-fold that in bolus studies at 6–8 h after the start of 2FA administration, thus providing data of greater reliability. Our results also showed that a steady state was reached in arterial plasma and in most brain regions at 4–6 h after the start of 2FA administration using a Kbolus of 500 min. In brain regions with slower kinetics (e.g., thalamus, midbrain) a steady state was almost reached by 6–8 h using this Kbolus. Analyses of seven VOIs from B/I studies were in good agreement with results from bolus studies, regardless of method of analysis (1TCM, 2TCM or Logan), suggesting a high reproducibility of measurement among methods. Because acquiring venous blood and scanning for 2 h (from 6–8 h after the start of 2FA administration) provides sufficient data and eliminates the need for modeling, B/I studies provide an extremely useful method for quantitative imaging of nAChRs compared to bolus studies that require arterial blood collection, scanning for up to 8 h and sophisticated mathematical modeling of the data.
Unmetabolized 2FA in venous plasma attained a constant level before steady state was achieved in arterial blood (Fig. 5B). This finding suggests that data from venous blood collected as soon as 1 h after the start of 2FA administration can be used as a surrogate measure for 2FA in arterial blood at equilibrium and this value can be used to calculate VT. It should be noted that the time at which the concentration of 2FA becomes constant in venous blood does not provide the time at which equilibrium between 2FA in arterial blood and 2FA in the brain has been reached. The almost equal concentration of free radioligand in arterial and venous plasma at 5–8 h after start of 2FA administration for each of the volunteers (Fig. 2a insert), suggests that little metabolism is occurring in peripheral tissue (e.g., muscle).
Although only one Kbolus value (500 min) for the B/I studies was used in the current study, we determined that this value was good for all subjects and all regions assayed. We found that this Kbolus was sufficient to measure VT in the various brain regions regardless of the receptor concentration (e.g., high receptor densities in thalamus vs. low to moderate densities in cortical area). Smokers have greater concentrations of nicotinic receptors than non-smokers (Benwell et al., 1988; Breese et al., 1997; Herzog et al., 2006; Kimes et al., 2006; Staley et al., 2006). Although absolute VT values were greater in smokers than in nonsmokers, especially in the cerebellum and frontal cortex, the deviation between values obtained in bolus studies compared to B/I studies were similar in both groups (see Table 1), suggesting that the Kbolus used in this study was sufficient to obtain reliable values for VT in both groups. It should be noted that the purpose of the current study was not to compare smokers with nonsmokers. That comparison with more participants will be presented separately. The VT values calculated for non-smokers using the B/I method, 15 ± 1, 7.3 ± 0.4, 7.8 ± 0.5, and 6.6 ± 0.5 (mean ± SEM, n=4) for thalamus, putamen, cerebellum and frontal cortex, respectively, were consistent with those obtained by Gallezot et al. (2005), but values obtained by Mitkovskia et al. (2005) were remarkably lower (15–46%) than those obtained in our study, especially for thalamus.
If the purpose of a PET study of nAChRs is to obtain values for regions with widely divergent VT, then Kbolus=500 min and scanning for 2 h starting 6 h after the start of 2FA administration will provide good estimates of these values. On the other hand, if the study has a more restricted scope in terms of brain regions to be assayed, scans acquired at earlier times (4–6 h) will provide reasonable VT values for regions such as the cortex, putamen and cerebellum. If the target region has slower kinetics, (e.g., midbrain or thalamus), a higher Kbolus may be more useful. Theoretically, increasing the Kbolus would result in achieving a constant level of radioactivity in these brain regions earlier relative to the start of 2FA administration, but actual testing is required to prove this prediction. Alternatively, using 500 min as the Kbolus, VT in a brain region with slow kinetics could be calculated based on kinetics of the regional brain radioactivity measured from 4 to 6 h after start of 2FA administration. Since the concentration in arterial blood has reached steady state at this time, the concentration of radioactivity in those brain regions will increase monoexponentially. Therefore, the level of radioactivity at steady state can be easily calculated by extrapolation. Again, the reliability of this approach must be verified by data simulation or by performing additional studies.
Parametric maps of B/I studies seem to remove most of the bias from analyses commonly used with bolus studies. These maps are free of underestimation of VT because they are not subject to bias from statistical noise that affects the Logan analysis (Logan et al., 1990) and do not have the additional variability that can be introduced by the MA1 method (Ichise et al., 2002). Obtaining measures of brain radioactivity and unmetabolized 2FA in venous plasma between 6 and 8 h after the start of 2FA administration in B/I studies yields comparable values for VT to those obtained from a full arterial plasma curve obtained from 0 to 8 h after the start of bolus administration and dynamic scanning for 8 h. Although obtaining one plasma sample and one scan may provide enough data to calculate VT, obtaining data from several plasma samples reduces the statistical noise from the measurement of free unmetabolized 2FA and performing dynamic scanning over 2–3 h allows confirmation that steady state in the brain has been achieved.
Conclusion
We conclude that 2FA administration via B/I (Kbolus = 500 min) with venous blood sampling and scanning from 6 to 8 h after the start of the 2FA infusion is a reliable method for quantifying nAChRs in the human brain. Because of its minimal invasiveness and shorter scanning duration, this procedure will be particularly useful in many clinical and experimental investigations (e.g., % receptor occupancy by nicotine or measuring VT and nondisplaceable volume distribution in the same study on the same day).
Acknowledgments
The authors would like to acknowledge Peter Willis, Ph.D., Andrew Hall, B.S., Andrew Horti, Ph.D. and Larry Koenig, A.A. for the radiosynthesis of the radioligand; Varughese Kurian, M.H.S., and Amy Kunce, C.N.M.T., A.R.R.T.(N) for maintaining the PET camera and acquiring the PET scans; Dean Shumway, B.S. for analyzing the blood samples; Betty Jo Salmeron, M.D. for her medical expertise; and Joyce Lutz, R.N. B.S., Kathy Demuth, R.N., B.S. and the rest of the NIDA nursing staff for their medical assistance with the study. This study was supported by the Intramural Research Program of the National Institute on Drug Abuse.
Footnotes
Publisher's Disclaimer: This is a PDF file of an unedited manuscript that has been accepted for publication. As a service to our customers we are providing this early version of the manuscript. The manuscript will undergo copyediting, typesetting, and review of the resulting proof before it is published in its final citable form. Please note that during the production process errors may be discovered which could affect the content, and all legal disclaimers that apply to the journal pertain.
References
- Abi-Dargham A, Laruelle M, Seibyl J, Rattner Z, Baldwin RM, Zoghbi SS, Zea-Ponce Y, Bremner JD, Hyde TM, Charney DS. SPECT measurement of benzodiazepine receptors in human brain with iodine-123-iomazenil: kinetic and equilibrium paradigms. J Nucl Med. 1994;35:228–238. [PubMed] [Google Scholar]
- Benwell ME, Balfour DJ, Anderson JM. Evidence that tobacco smoking increases the density of (−)-[3H]nicotine binding sites in human brain. J Neurochem. 1988;50:1243–1247. doi: 10.1111/j.1471-4159.1988.tb10600.x. [DOI] [PubMed] [Google Scholar]
- Bergström M, Grahnén A, Långström B. Positron emission tomography microdosing: a new concept with application in tracer and early clinical drug development. Eur J Clin Pharmacol. 2003;59:357–366. doi: 10.1007/s00228-003-0643-x. [DOI] [PubMed] [Google Scholar]
- Breese CR, Marks MJ, Logel J, Adams CE, Sullivan B, Collins AC, Leonard S. Effect of smoking history on [3H]nicotine binding in human postmortem brain. J Pharmacol Exp Ther. 1997;282:7–13. [PubMed] [Google Scholar]
- Brody AL, Mandelkern MA, London ED, Olmstead RE, Farahi J, Scheibal D, Jou J, Allen V, Tiongson E, Chefer SI, Koren AO, Mukhin AG. Cigarette smoking saturates brain α4β2 nicotinic acetylcholine receptors. Arch Gen Psychiatry. 2006;63:907–915. doi: 10.1001/archpsyc.63.8.907. [DOI] [PMC free article] [PubMed] [Google Scholar]
- Carson RE, Channing MA, Blasberg R, Dunn BB, Cohen RM, Rice KC, Herscovitch P. Comparison of bolus and infusion methods for receptor quantitation: application to [18F]cyclofoxy and positron emission tomography. J Cereb Blood Flow Metab. 1993;13:24–42. doi: 10.1038/jcbfm.1993.6. [DOI] [PubMed] [Google Scholar]
- Chefer SI, London ED, Koren AO, Pavlova OA, Kurian V, Kimes AS, Horti AG, Mukhin AG. Graphical analysis of 2-[18F]FA binding to nicotinic acetylcholine receptors in rhesus monkey brain. Synapse. 2003;48:25–34. doi: 10.1002/syn.10180. [DOI] [PubMed] [Google Scholar]
- Derogatis LR, Lipman RS, Covi L. SCL-90: An outpatient psychiatric rating scale-preliminary report. Psychopharmacol Bull. 1973;9:13–28. [PubMed] [Google Scholar]
- Gallezot JD, Bottlaender M, Grégoire MC, Roumenov D, Deverre JR, Coulon C, Ottaviani M, Dollé F, Syrota A, Valette H. In vivo imaging of human cerebral nicotinic acetylcholine receptors with 2-18F-Fluoro-A-85380 and PET. J Nucl Med. 2005;46:240–247. [PubMed] [Google Scholar]
- Herzog H, Minnerop M, Eschner W, Jessen F, Schutz C, Schmaljohann J, Wullner U. Distribution volume of the nicotinic acetylcholine receptor ligand 2-[F-18]F-A-85380: Nonsmokers versus smokers. Neuroimage. 2006;31:T156. [Google Scholar]
- Horti AG, Scheffel U, Koren AO, Ravert HT, Mathews WB, Musachio JL, Finley PA, London ED, Dannals RF. 2-[18F]Fluoro-A-85380, an in vivo tracer for the nicotinic acetylcholine receptors. Nucl Med Biol. 1998;25:599–603. doi: 10.1016/s0969-8051(98)00031-6. [DOI] [PubMed] [Google Scholar]
- Ichise M, Toyama H, Innis RB, Carson RE. Strategies to improve neuroreceptor parameter estimation by linear regression analysis. J Cereb Blood Flow Metab. 2002;22:1271–1281. doi: 10.1097/01.WCB.0000038000.34930.4E. [DOI] [PubMed] [Google Scholar]
- Ito H, Hietala J, Blomqvist G, Halldin C, Farde L. Comparison of the transient equilibrium and continuous infusion method for quantitative PET analysis of [11C]raclopride binding. J Cereb Blood Flow Metab. 1998;18:941–950. doi: 10.1097/00004647-199809000-00003. [DOI] [PubMed] [Google Scholar]
- Kendziorra K, Meyer P, Wolf H, Barthel H, Hesse S, Seese A, Sorger D, Patt M, Becker G, Schidan A, Gertz HJ, Sabri O. Cerebral nicotinic acetylcholine receptors in patients with Alzheimer’s disease assessed with 2-[18F]F-A85380 PET—correlations to dementia severity. Neuroimage. 2006;31:T39. [Google Scholar]
- Kimes AS, Chefer S, Contoreggi CS, Hall A, Horti A, Vaupel DB, Pavlova O, Stein EA, Mukhin AG. In vivo quantification of the greater densities of alpha4beta2* nicotinic acetylcholine receptors in smokers compared to non-smokers. Neuroimage. 2006;31:T153. [Google Scholar]
- Kimes AS, Horti AG, London ED, Chefer SI, Contoreggi C, Ernst M, Friello P, Koren AO, Kurian V, Matochik JA, Pavlova O, Vaupel DB, Mukhin AG. 2-[18F]F-A-85380: PET imaging of brain nicotinic acetylcholine receptors and whole body distribution in humans. FASEB J. 2003;17:1331–1333. doi: 10.1096/fj.02-0492fje. [DOI] [PubMed] [Google Scholar]
- Lindstrom J, Anand R, Peng X, Gerzanich V, Wang F, Li Y. Neuronal nicotinic receptor subtypes. Ann N Y Acad Sci. 1995;757:100–116. doi: 10.1111/j.1749-6632.1995.tb17467.x. [DOI] [PubMed] [Google Scholar]
- Logan J, Fowler JS, Volkow ND, Wolf AP, Dewey SL, Schlyer DJ, MacGregor RR, Hitzemann R, Bendriem B, Gatley SJ. Graphical analysis of reversible radioligand binding from time-activity measurements applied to [N-11C-methyl]-(−)-cocaine PET studies in human subjects. J Cereb Blood Flow Metab. 1990;10:740–747. doi: 10.1038/jcbfm.1990.127. [DOI] [PubMed] [Google Scholar]
- Meyer P, Hesse S, Kendziorra K, Becker G, Wegner F, Schildan A, Seese A, Lobsien D, Barthel H, Schwarz J, Sabri O. Dissociation between striatal alpha4beta2 nicotinic acetylcholine receptors (alpha4beta2) and dopamine transporters (DAT) in Parkinson disease: A 2-[18F]-F-A-85380 PET/[123I]-FP-CIT SPECT study. Neuroimage. 2006a;31:T157. [Google Scholar]
- Meyer P, Kendziorra K, Hesse S, Becker G, Strecker K, Hensel A, Patt M, Seese A, Gertz HJ, Schwarz J, Sabri O. Nicotinic acetylcholine receptors (alpha4beta2) and their relationship to cognitive and mood symptoms in Parkinson disease: A 2-[18F]-FA-85380 PET study. Neuroimage. 2006b;31:T151. [Google Scholar]
- Mihailescu S, Drucker-Colin R. Nicotine, brain nicotinic receptors, and neuropsychiatric disorders. Arch Med Res. 2000;31:131–144. doi: 10.1016/s0188-4409(99)00087-9. [DOI] [PubMed] [Google Scholar]
- Mitkovski S, Villemagne VL, Novakovic KE, O’Keefe G, Tochon-Danguy H, Mulligan RS, Dickinson KL, Saunder T, Gregoire MC, Bottlaender M, Dolle F, Rowe CC. Simplified quantification of nicotinic receptors with 2[18F]F-A-85380 PET. Nucl Med Biol. 2005;32:585–591. doi: 10.1016/j.nucmedbio.2005.04.013. [DOI] [PubMed] [Google Scholar]
- Picard F, Bruel D, Servent D, Saba W, Fruchart-Gaillard C, Schollhorn-Peyronneau MA, Roumenov D, Brodtkorb E, Zuberi S, Gambardella A, Steinborn B, Hufnagel A, Valette H, Bottlaender M. Alteration of the in vivo nicotinic receptor density in ADNFLE patients: a PET study. Brain. 2006;129:2047–2060. doi: 10.1093/brain/awl156. [DOI] [PubMed] [Google Scholar]
- Pinborg LH, Adams KH, Svarer C, Holm S, Hasselbalch SG, Haugbol S, Madsen J, Knudsen GM. Quantification of 5-HT2A receptors in the human brain using [18F]altanserin-PET and the bolus/infusion approach. J Cereb Blood Flow Metab. 2003;23:985–996. doi: 10.1097/01.WCB.0000074092.59115.23. [DOI] [PubMed] [Google Scholar]
- Robins L, Cottler L, Bucholz K, Compton W. Diagnostic Interview Schedule for DSM-IV. Washington University; St. Louis, MO: 1995. [Google Scholar]
- Shumway DA, Pavlova OA, Mukhin AG. A simplified method for the measurement of nonmetabolized 2-[18F]F-A-85380 in blood plasma using solid-phase extraction. Nucl Med Biol. 2007;34:221–228. doi: 10.1016/j.nucmedbio.2006.12.001. [DOI] [PubMed] [Google Scholar]
- Slifstein M, Laruelle M. Effects of statistical noise on graphic analysis of PET neuroreceptor studies. J Nucl Med. 2000;41:2083–2088. [PubMed] [Google Scholar]
- Staley JK, Krishnan-Sarin S, Cosgrove KP, Krantzler E, Frohlich E, Perry E, Dubin JA, Estok K, Brenner E, Baldwin RM, Tamagnan GD, Seibyl JP, Jatlow P, Picciotto MR, London ED, O’Malley S, van Dyck CH. Human tobacco smokers in early abstinence have higher levels of beta2* nicotinic acetylcholine receptors than nonsmokers. J Neurosci. 2006;26:8707–8714. doi: 10.1523/JNEUROSCI.0546-06.2006. [DOI] [PMC free article] [PubMed] [Google Scholar]
- Vaupel DB, Stein EA, Mukhin AG. Quantification of α4β2* nicotinic receptors in the rat brain with microPET and 2-[18F]F-A-85380. Neuroimage. 2007;34:1352–1362. doi: 10.1016/j.neuroimage.2006.10.036. [DOI] [PMC free article] [PubMed] [Google Scholar]
- Zachary RA. Shipley Institute of Living Scale. Western Psychological Services; Los Angeles: 1986. [Google Scholar]