

Abstract
We quantitatively analyzed, using laser scanning confocal microscopy, the three-dimensional structure of individual senile plaques in Alzheimer disease. We carried out the quantitative analysis using statistical methods to gain insights about the processes that govern Aβ peptide deposition. Our results show that plaques are complex porous structures with characteristic pore sizes. We interpret plaque morphology in the context of a new dynamical model based on competing aggregation and disaggregation processes in kinetic steady-state equilibrium with an additional diffusion process allowing Aβ deposits to diffuse over the surface of plaques.
Although the mechanism whereby Aβ deposition may lead to dementia in Alzheimer disease (AD) is unknown, compelling genetic evidence suggests that aggregation of Aβ to form senile plaques (SP) is an essential component of AD pathophysiology (1–3). Biochemical studies suggest that these Aβ deposits are insoluble, and their formation process is viewed as irreversible. From inspection of AD tissue samples, it is evident that a wide variety of morphologies and textures of SP are present in the AD brain. Their morphologies cannot be explained by known aggregation models (4–8).
Aβ is a ≈39- to 42-amino acid amphipathic peptide derived from a portion of the transmembrane domain and extracellular region of the Aβ precursor protein (9). Aβ is a normal cellular product and is present in nanomolar concentrations in biological fluids (10, 11). In vitro, at higher concentrations, it is extremely insoluble and precipitates to form aggregates (12–15). In the AD brain, Aβ deposits form β-pleated, sheets which are the major constituent of SP. Racemized amino acids have been found in Aβ, suggesting that at least some of the deposits are long-lived (16). Given the insoluble nature of Aβ, it is reasonable to predict that plaques would continue to grow in size and number as the disease progresses. However, experimental data show that this is not the case; instead, plaque size and Aβ burden (total percentage) appear to remain relatively constant over a wide range of disease durations (17–19).
Optical microscopy of the AD brain reveals innumerable Aβ deposits of various sizes and shapes. In an effort to understand how Aβ deposition occurs and evolves over time, we have examined the fine structure of the SP using confocal scanning laser microscopy (20, 21) and immunofluorescence techniques for Aβ immunostaining. The confocal microscope is able to obtain optical sections that are ≈0.3- to 0.5-μm thick, allowing the reconstruction of the three-dimensional fine structure of a plaque with a resolution close to the theoretical limit of the order of the wavelength of visible light.
Standard immunostaining in thick sections might suggest that plaques are relatively solid (Fig. 1a), but our examination of individual cross-sections using confocal microscopy reveals cavities and inner structure, suggesting that the three-dimensional structure of Aβ aggregates in SPs is porous [Fig. 1b]. By stepping through the Aβ deposit in a chosen direction, sequential optical sections similar to those shown in Fig. 1c can be obtained and reconstructed to analyze the three-dimensional structure of the plaque (Fig. 1d).
Figure 1.
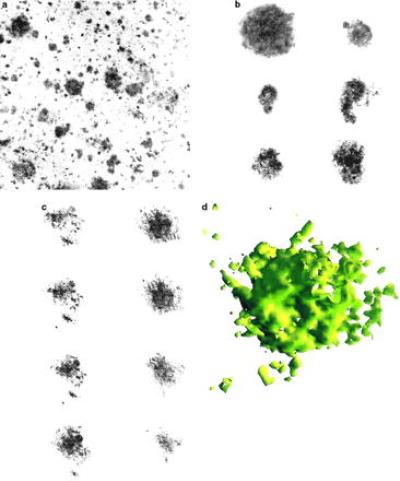
(a) Photomicrograph from a Bio-Rad 1024 confocal microscope of a section of cerebral tissue of dimensions 600 × 600 μm in area, displaying plaque aggregates as dark regions. Immunofluorescence used anti-Aβ mAb 10D5 on 50-μm thick frozen sections as described (17). Immunoreactivity was visualized using a Cy-5-labeled secondary antibody (Jackson ImmunoResearch) to overcome potential problems due to tissue autofluorescence. Qualitative analysis of the figure shows that the Aβ aggregates are of roughly spherical shape. Quantitative analysis shows that the size distributions are peaked around a characteristic size. (b) Typical plaques and (c) consecutive cross-sections of an individual plaque, as observed under a confocal microscope, are shown. (d) Three-dimensional reconstruction of an SP (of diameter ≈60 μm) from 18 images (×100 oil immersion objective) separated by 0.3 μm. Each cross-sectional image represents the average of three scans combined with a Kalman filter. All images were obtained from the multimodal superior temporal sulcus neocortex of six Alzheimer cases from the Massachusetts Alzheimer Disease Research Center Brain Bank.
The first approach to quantify the geometry of these individual plaques is to calculate the density–density correlation function (22) g(r), which is defined to be the probability that two points of space at a distance r are both part of the SP. Results from cross-sections of typical cortical samples (Fig. 3a) indicate that, in contrast to that of a solid disk (shown by a solid line), the correlation function displays three regimes: (i) a central region that approximates the solid disk curve and (ii) an inner and (iii) an outer regime that deviate. The deviations from the solid line in the small r regime indicate the existence of “pockets” of higher and lower density than the average density, corroborating the conclusion derived by simple inspection of confocal pictures (Fig. 1 b and c). For larger distances, the deviation indicates that the density of the plaque decays slowly (diffuse ring) as the distance from the center of the plaque increases.
Figure 3.

Correlation functions calculated for the cross-sections of over 500 images representing 37 plaques from the superficial layers of the superior temporal sulcus cortex in tissue of Alzheimer brain (a and b) and for the cross-sections of computer-simulated model plaques (c and d). Plaques from tissue were not selected to represent any morphological subtype. In fact, it is difficult to categorize with certainty the three-dimensional confocal images of Aβ deposits into “classic,” “cored,” or “primitive” plaques. In a, the calculation considers the plaque and its surroundings. In b, only the interior region of a plaque is considered in the correlation function calculation. Our choice of normalization in the correlation function is such that, as r → ∞, the correlation function tends to the normalized density of the system [g(∞) = 0 in a and = 1 in b]. The parameter ro for each graph indicates the characteristic radius of the entire plaque and is obtained from the solid disk fit. The characteristic size, ξ, of the porosity inside plaques is obtained from the x-axis intercept of the small-r fits to a solid disk of g(r) calculated as in b. The fit is carried out exclusively over the small-r region because we were interested in the smallest homogeneous structure inside the plaque. The Inset in b shows a histogram of pore sizes from plaques that peaks at ≈5 μm (much larger than the resolution of the images). (c) Correlation function for the computer-simulated model plaques taking into account the model plaque with the surroundings and (d) taking into account only the interior of the model plaque. In both c and d, the solid lines are fits to a correlation function of a solid disk. The Inset in d shows a histogram of pore sizes in cross-sections of 13 different model plaques of different diameters. The histogram shows a peak at a characteristic pore size of ≈6 pixels. The curve in d with the black squares is the interior correlation function for the model plaque without surface relaxation (top of Fig. 2b), giving a considerably smaller value than that for the model with surface relaxation.
To further study the characteristics of the inner structure of the plaques and thus gain some insight into the formation of SP, we performed the correlation function analysis again, but now exclusively over the cross-sectional area of the plaque confined to its interior. In this way, there are no surface effects on the calculation, so this analysis yields information only about the plaque’s inner structure. Over 500 images were collected; correlation function analysis of middle sections of plaques of diameters ranging from 20 to 90 μm (Fig. 3b) indicated that the average linear size of these pores or “pockets” of different density is, at most, only weakly diameter-dependent, being roughly 5 ± 2 μm (see the Inset of Fig. 3b). Double immunostaining using 4′, 6-diamidino-2-phenylindole for nuclei, LN-3 for microglia, or glial fibrillary acidic protein for astrocytes showed that these pores are infrequently occupied by cellular elements.
Thus, these quantitative analyses of plaque structure revealed two new features not evident by qualitative inspection. A typical plaque consists of (i) a porous core with pores of a characteristic size and (ii) a diffuse ring whose density slowly decays from the center of mass of the SP. Recognition of these two features immediately leads to the question of how these structures are formed in the AD brain and what kind of mechanisms could produce such morphologies. Consideration of general principles of aggregation leads to several possibilities that depend on the diffusion constant of Aβ (4–8, 22–26). If the diffusion of the solute Aβ is slower than the speed of aggregation, the growth will occur at the tips of the aggregate, leading to a ramified tree-like structure belonging to the diffusion limited aggregation universality class (5–8, 22–26) rather than the structure observed. This case is very unlikely to occur in AD brains because, it is believed, aggregation is a slow process that may continue for years while the diffusion of Aβ in the brain is much faster. On the other hand, if the diffusion of Aβ is faster than the aggregation, then Aβ is equally likely to aggregate at any point on the surface of the SP. The outcome is a very compact spherical structure with only a few very small pores, belonging to the Eden universality class (5–8, 22–26), which is also quite different than the experimentally observed morphology. Physicochemical models based on nucleation-dependent polymerization, as suggested by Jarrett and Lansbury (27), would yield a compact object if the process is continued beyond the nucleation and growth steps.
We suggest an alternative possibility in which aggregation occurs simultaneously with disaggregation. Objects grown by our proposed process can lead to the formation of porous objects whose size distributions, number, and Aβ burden are constant if the aggregation is in dynamic equilibrium with disaggregation (17). Our hypothesis is not inconsistent with the nucleation process proposed by Jarrett and Lansbury (27), but extends it by adding a disaggregation process that, once the thermodynamic equilibrium is reached, would yield a porous structure similar to that found experimentally. This also does not preclude the possibility that, in addition to a dynamic equilibrium between soluble and deposited Aβ, some Aβ undergo irreversible biochemical changes to long-lived species (16).
To corroborate the expected outcomes from these hypothesized competing aggregation and disaggregation mechanisms, we developed a dynamical model. The model incorporates the experimental observation that the amount of Aβ burden varies within a narrow range and is independent of duration or severity of illness (28). In the model, an ensemble of plaques, as well as individual plaques of various sizes, are grown on a three-dimensional lattice. A collection of model plaques, grown in a computer simulation starting from a configuration of isolated occupied lattice points, is shown in Fig. 2a (to be compared with actual plaques shown in Fig. 1a). The size distribution of configurations of model plaques, like the one represented in Fig. 2a, was found to exhibit a peaked distribution—in agreement with earlier experimental work (28). The two computer-generated model plaques presented in Fig. 2b show the importance of the inclusion of surface diffusion in the model, which allows the model plaques to acquire a smoother surface (note the difference between the two model plaques in Fig. 2b). In addition, as a consequence of the surface diffusion, the model exhibits well defined pores in its interior (lower model plaque in Fig. 2b). Fig. 2 c and d shows cross-sections and three-dimensional reconstruction of a typical model plaque, respectively (compare with Fig. 1 c and d). To make quantitative comparisons between the experiment and the model, in Fig. 3 c and d we present results for the correlation function of the model plaques. Similarly to Fig. 3a, Fig. 3c exhibits a porous core and diffuse ring around the core for the model plaques. Comparing the Insets of Fig. 3 b and d, we concluded that the model was able to reproduce the distribution of average pore and pocket sizes in the cross-sections of SPs.
Figure 2.

The dynamical model is defined on a discrete three-dimensional lattice with lattice sites that can be either empty or occupied. At each time step in the simulation, each occupied site either grows with probability Pg or is cleared with probability Pc. Depending on the relative values, a system may be predisposed to create plaques or to dissolve them. Nearest neighbor rules are incorporated such that aggregation at a site is more likely if its neighboring sites are empty and less likely if they are occupied. On the other hand, an occupied site is more likely to be dissolved as the number of empty nearest sites increases. These rules follow from considering that, in real SP, the more exposed sites have a greater probability of being surrounded by Aβ. At the same time, these exposed sites are more likely to be disaggregated by external agents. To avoid the final state in which either all sites are occupied or empty (inevitable under the given rules), it is necessary to incorporate a dynamic feedback that allows the system to evolve into a steady state characterized by a burden that is, on average, conserved in time. The feedback modifies Pc by an amount that is proportional to the rate of change in the total burden. In addition, the model allows for a diffusion of aggregated particles on the model plaque. This diffusion permits a given occupied site to explore its immediate neighborhood and choose to change its position only if it ends up surrounded by more neighboring sites. This selective diffusive process allows for the system to relax so that the overall surface is smooth. In a, a cross-section of a system defined on a three-dimensional lattice of the size 400 × 400 × 20 after 500 time steps. The initial configuration corresponds to randomly scattered seeds covering 2% of the lattice sites. The initial values of the disaggregation and aggregation probabilities are Pc = Pg = 0.8. The surface diffusion is set to allow sites to move up to 10 steps around its initial position at every time step. (b) Typical cross-sections of two model plaques (of diameter ≈50 pixels) after 500 time steps, illustrating the effect of surface diffusion. The initial value of the disaggregation and growth probabilities are the same as in a. Starting with a small solid sphere as an initial condition, the model with no surface diffusion evolves into a too diffuse object with less well defined pores when compared with the lower one, which is a result of the model with diffusion. c and d show eight consecutive two-dimensional cross-sections and three-dimensional reconstruction of the model plaque from b, respectively.
In summary, using laser scanning confocal microscopy, we were able to obtain three-dimensional images of SP. Using correlation function analysis, we examined the fine structure of SPs, and we have discovered within the plaque’s internal morphological structure the presence of characteristic size pores and pockets of higher density (Figs. 1 and 3b). This structure serves to decrease the likelihood of several potential formation mechanisms based solely on aggregation and favors instead a model in which both aggregation and disaggregation processes are in dynamic steady-state equilibrium. The requirement of a disaggregation mechanism in the model is consistent with the possibility that Aβ deposition may not be irreversible. The plausibility of this model is further supported by (i) analyses of a small number of patients studied at both biopsy and autopsy, in whom a decrease (or no increase) in Aβ deposits was seen (29, 30), and (ii) in vitro studies suggesting that microglia can respond to and ingest Aβ aggregates (31, 32).
Acknowledgments
We thank D. Futer and R. Mantegna for very helpful discussions. This work was supported by National Institutes of Health Grant AG08487 and by generous gifts from the Walters Family Foundation. We also thank the Massachusetts Alzheimer Disease Research Center Brain Bank (National Institute on Aging Grant AG05134; Dr. E. T. Hedley-Whyte, director) for tissue samples.
ABBREVIATIONS
- SP
senile plaques
- AD
Alzheimer disease
References
- 1.Selkoe D. J Neuropathol Exp Neurol. 1994;53:438–447. doi: 10.1097/00005072-199409000-00003. [DOI] [PubMed] [Google Scholar]
- 2.Goate A, Chartier-Harlin M-C, Mullan M. Nature (London) 1991;349:704–707. doi: 10.1038/349704a0. [DOI] [PubMed] [Google Scholar]
- 3.Cai X-D, Golde T E, Younkin S G. Science. 1993;259:514–516. doi: 10.1126/science.8424174. [DOI] [PubMed] [Google Scholar]
- 4.de Gennes P-G. Scaling Concepts in Polymer Physics. Ithaca, NY: Cornell Univ. Press; 1979. [Google Scholar]
- 5.Family F, Landau D P, editors. Kinetics of Aggregation and Gelation. Amsterdam: Elsevier; 1984. [Google Scholar]
- 6.Herrmann H J. Physiol Rep. 1986;136:153–227. [Google Scholar]
- 7.Vicsek T, Shlesinger M F, Matsushita M, editors. Fractals in Natural Sciences. Singapore: World Scientific; 1994. [Google Scholar]
- 8.Grosberg A Y, Khokhlov A R. Statistical Physics of Macromolecules. New York: Am. Inst. Physics; 1994. [Google Scholar]
- 9.Lansbury P T., Jr Biochemistry. 1992;31:6865–6870. doi: 10.1021/bi00145a001. [DOI] [PubMed] [Google Scholar]
- 10.Seubert P, Vigo-Pelfrey C, Esch F, Lee M, Dovey H, Davis D, Sinha S, Schlossmacher M, Whaley J, Swindlehurst C, McCormack R, Wolfert R, Selkoe D, Lieberburg I, Schenk D. Nature (London) 1992;359:325–327. doi: 10.1038/359325a0. [DOI] [PubMed] [Google Scholar]
- 11.Shoji M, Golde T E, Ghiso J, Cheung T T, Estus S, Shaffer L M, Cai X-D, McKay D M, Tintner R, Frangione B, Younkin S G. Science. 1992;258:126–129. doi: 10.1126/science.1439760. [DOI] [PubMed] [Google Scholar]
- 12.Lomakin A, Chung D S, Benedek G B, Kirschner D A, Teplow D B. Proc Natl Acad Sci USA. 1996;93:1125–1129. doi: 10.1073/pnas.93.3.1125. [DOI] [PMC free article] [PubMed] [Google Scholar]
- 13.Fraser P E, Nguyen J T, Inouye H, Surewicz W K, Selkoe D J, Podlisny M B, Kirschner D A. Biochemistry. 1992;31:10716–10723. doi: 10.1021/bi00159a011. [DOI] [PubMed] [Google Scholar]
- 14.Barrow C J, Yasuda A, Kenny P T M, Zagorski M G. J Mol Biol. 1993;225:1075–1093. doi: 10.1016/0022-2836(92)90106-t. [DOI] [PubMed] [Google Scholar]
- 15.Pike C J, Burdick D, Walencewicz A J, Glabe C G, Cotman C W. J Neurosci. 1993;13:1676–1687. doi: 10.1523/JNEUROSCI.13-04-01676.1993. [DOI] [PMC free article] [PubMed] [Google Scholar]
- 16.Shapira R, Austin G E, Mirra S S. J Neurochem. 1988;50:69–74. doi: 10.1111/j.1471-4159.1988.tb13231.x. [DOI] [PubMed] [Google Scholar]
- 17.Hyman B T, Marzloff K, Arriagada P V. J Neuropathol Exp Neurol. 1993;52:594–600. doi: 10.1097/00005072-199311000-00006. [DOI] [PubMed] [Google Scholar]
- 18.Arriagada P V, Growdon J H, Hedley-Whyte E T, Hyman B T. Neurology. 1992;42:631–639. doi: 10.1212/wnl.42.3.631. [DOI] [PubMed] [Google Scholar]
- 19.Berg L, McKeel D W, Miller J P, Baty J, Morris J C. Arch Neurol. 1993;50:349–358. doi: 10.1001/archneur.1993.00540040011008. [DOI] [PubMed] [Google Scholar]
- 20.Lichtman J W. Sci Am. 1994;271(8):40–45. [Google Scholar]
- 21.Wilson T, editor. Confocal Microscopy. New York: Academic; 1990. [Google Scholar]
- 22.Vicsek T. Fractal Growth Phenomena. 2nd Ed. New York: World Scientific; 1992. [Google Scholar]
- 23.Avnir D, editor. The Fractal Approach to Heterogeneous Chemistry. Chichester: Wiley; 1989. [Google Scholar]
- 24.Takayasu H. Fractals in the Physical Sciences. Manchester, U.K.: Manchester Univ. Press; 1990. [Google Scholar]
- 25.Bassingthwaighte J B, Liebovitch L S, West B J. Fractal Physiology. New York: Oxford Univ. Press; 1994. [Google Scholar]
- 26.Stanley H E, Ostrowsky N, editors. On Growth and Form: Fractal and Nonfractal Patterns in Physics. Dordrecht, The Netherlands: Martinus Nijhoff; 1985. [Google Scholar]
- 27.Jarrett J T, Lansbury P T. Cell. 1993;73:1055–1058. doi: 10.1016/0092-8674(93)90635-4. [DOI] [PubMed] [Google Scholar]
- 28.Hyman B T, West H L, Rebeck G W, Buldyrev S V, Mantegna R N, Ukleja M, Havlin S, Stanley H E. Proc Natl Acad Sci USA. 1995;92:3586–3590. doi: 10.1073/pnas.92.8.3586. [DOI] [PMC free article] [PubMed] [Google Scholar]
- 29.Mann D M A, Marcyniuk B, Yates P O, Neary D, Snowden J S. Neuropathol Appl Neurobiol. 1988;14:177–195. doi: 10.1111/j.1365-2990.1988.tb00880.x. [DOI] [PubMed] [Google Scholar]
- 30.Gearing M, Schneider J A, Mori H, Mirra S S. J Neuropathol Exp Neurol. 1996;55:645. [Google Scholar]
- 31.Paresce D, Ghosh R, Maxfield F R. Neuron. 1996;17:553–565. doi: 10.1016/s0896-6273(00)80187-7. [DOI] [PubMed] [Google Scholar]
- 32.El-Khoury J. Nature (London) 1996;382:716–719. doi: 10.1038/382716a0. [DOI] [PubMed] [Google Scholar]