

Abstract
The mechanisms underlying visual perceptual stability are usually investigated using voluntary eye movements. In such studies, errors in perceptual stability during saccades and pursuit are commonly interpreted as mismatches between actual eye-position and eye-position signals in the brain. The generality of this interpretation could in principle be tested by investigating spatial localization during reflexive eye movements whose kinematics are very similar to those of voluntary eye movements.
Accordingly, in this study, we determined mislocalization of flashed visual targets during optokinetic afternystagmus (OKAN). These eye movements are quite unique in that they occur in complete darkness, and are generated by subcortical control mechanisms. We found that during horizontal OKAN slow-phases subjects mislocalize targets away from the fovea in the horizontal direction. This corresponds to a perceived expansion of visual space and is unlike mislocalization found for any other voluntary or reflexive eye movement. Around the OKAN fast-phases, we found a bias in the direction of the fast-phase prior to its onset and opposite to the fast-phase direction thereafter. Such a biphasic modulation has also been reported in the temporal vicinity of saccades, and during optokinetic nystagmus (OKN). A direct comparison, however, showed that the modulation during OKAN was much larger and occurred earlier relative to fast-phase onset than during OKN.
A simple mismatch between the current eye-position and the eye-position signal in the brain is unlikely to explain such disparate results across similar eye movements. Instead, these data support the view that mislocalization arises from errors in eye-centred position information.
Keywords: localization, eye movement, OKAN, OKN, saccade, smooth pursuit
Introduction
Space-constancy during eye movements is a major challenge for the visual system. Objects move across the retina with speeds up to several hundred degrees per second as a consequence of saccadic eye movements. Nevertheless we perceive the world as being stable. However, visual stability is not perfect, at least when transient stimuli are considered. Many studies have demonstrated spatial misjudgements of stimuli flashed during voluntary eye movements (pursuit and saccades). During smooth pursuit such stimuli are mislocalized in the direction of the eye movement, and the magnitude of the error depends on the position of the target relative to the fovea (Rotman et al., 2004;van Beers et al., 2001;Mitrani and Dimitrov, 1982). During voluntary saccades localization errors follow a characteristic spatio-temporal pattern, which heavily depends on experimental conditions (Ross et al., 2001;Schlag and Schlag-Rey, 2002). In complete darkness, transient stimuli are mislocalized in the direction of the eye movement from about 100ms before saccade onset (shift) (Cai et al., 1997;Honda, 1989). The maximum shift is observed around saccade onset. Mislocalization is then inverted and stimuli are perceived as being shifted opposite to the saccade direction for up to 100ms. In contrast, when visual references are available, the mislocalization strongly depends on the position of the target relative to the saccade goal and all stimuli are shifted towards the landing point of the eye resulting in a perceptual compression of visual space (Lappe et al., 2000;Ross et al., 1997;Kaiser and Lappe, 2004) .
Mislocalization is commonly interpreted as a temporary mismatch between the actual eye position and eye position signals in the brain (Dassonville et al., 1992;Honda, 1991). Given this context it is of interest to determine how different eye movements, with very similar kinematics, affect localization. Recently, two studies investigated mislocalization of transient visual stimuli during Optokinetic Nystagmus (OKN) (Kaminiarz et al., 2007;Tozzi et al., 2007). OKN is a reflexive eye movement evoked by large-field moving patterns. OKN consists of two alternating phases: a slow-phase in the direction of the stimulus motion and a fast-phase opposite to the stimulus motion. Stimuli presented during OKN slow-phase were found to be mislocalized in the direction of the eye movement. However, contrary to smooth pursuit, the size of the error did not depend on the position of the target relative to the fovea. The error pattern observed during the OKN fast-phase resembled the one described for voluntary saccades in darkness (perisaccadic shift). The biphasic mislocalization pattern during OKN, however, occurred earlier with respect to fast-phase onset.
In this study we continue our investigation of mislocalization during reflexive eye movements. Most importantly, we wished to address the issue that during OKN a moving textured background is permanently visible. This background in itself might contribute to the observed localization errors. Hence, to show that perceptual errors occur in the complete absence of visual stimulation, we tested localization during optokinetic afternystagmus (OKAN). OKAN is an alternation of slow and fast phases observed in total darkness in subjects who previously performed prolonged OKN.
Methods
Subjects
Nine subjects participated in the experiments. Six were naive as to the purpose of the experiment. All subjects had normal or corrected to normal visual acuity and gave informed written consent. All procedures used in this study conformed to the Declaration of Helsinki.
Stimulus presentation and eye movement recordings
Experiments were carried out in a completely dark experimental room to avoid visual references which otherwise could (i) prevent OKAN and/or (ii) influence visual localization. Computer generated stimuli were projected onto a large tangent screen using a CRT projector (Marquee 8000, Electrohome Inc.) running at a spatial resolution of 1152×864 pixels and a frame rate of 100 Hz. The screen was viewed binocularly at a distance of 114 cm and subtended 70°×55° of visual angle. During the experiments the subjects’ head was supported by a chin rest. Eye position was sampled at 500 Hz using an infrared eye tracker (Eye Link 2, SR Research). The system was calibrated prior to each session using a 9 (3×3) point calibration grid. During sessions drift correction was performed before each trial. Recording sessions lasted between 5 and 10 minutes, depending on experiment and subject. Eye movement and behavioral data were stored on hard disk for offline analysis.
Visual stimuli
To induce OKN/OKAN we presented a random dot pattern (RDP) consisting of black dots (size: 2.0°, luminance <0.1 cd/m2, number of visible dots: 250) moving left- or rightward on the screen. All dots moved coherently and a new RDP was generated for each trial. The visual localization target (white circle, 0.5° (OKAN) or 1.0° (OKN) in diameter, luminance 22.5 cd/m2) was flashed for 10ms at one of three positions (x = −8°, 0°, +8°) on the horizontal meridian. In all experiments different target positions were displayed with equal probability in pseudorandom order. To determine the perceived position of the target a horizontal ruler was displayed on a gray background (luminance 12.5cd/m2) at the end of each trial (see also: (Kaminiarz et al., 2007)). The ruler's tick-mark positions were equally spaced, but random numbers were assigned to the tick-marks for each trial to prevent subjects from developing stereotypical response strategies due to the limited number of targets. Subjects reported the perceived position of the target by entering the number of the tick-mark closest to the target flash.
Baseline trials
In OKAN baseline trials, subjects freely viewed a white (luminance 22.5 cd/m2) screen for 3000ms. Thereafter the screen turned black for another 3000ms. The target was flashed 2500ms after the luminance change (Figure 1b). This background luminance change mimicked the change that occurred in the actual OKAN trials (see below). Here and in all other cases, the ruler was displayed 490ms after target presentation and the trial ended once the subject entered the perceived position on the keyboard. In OKN baseline trials, subjects freely viewed a homogeneous gray (luminance 12.5cd/m2) screen for 4000 ms. The target was presented after 3500 ms (Figure 1d). Each baseline session consisted of 30 trials.
Figure 1.
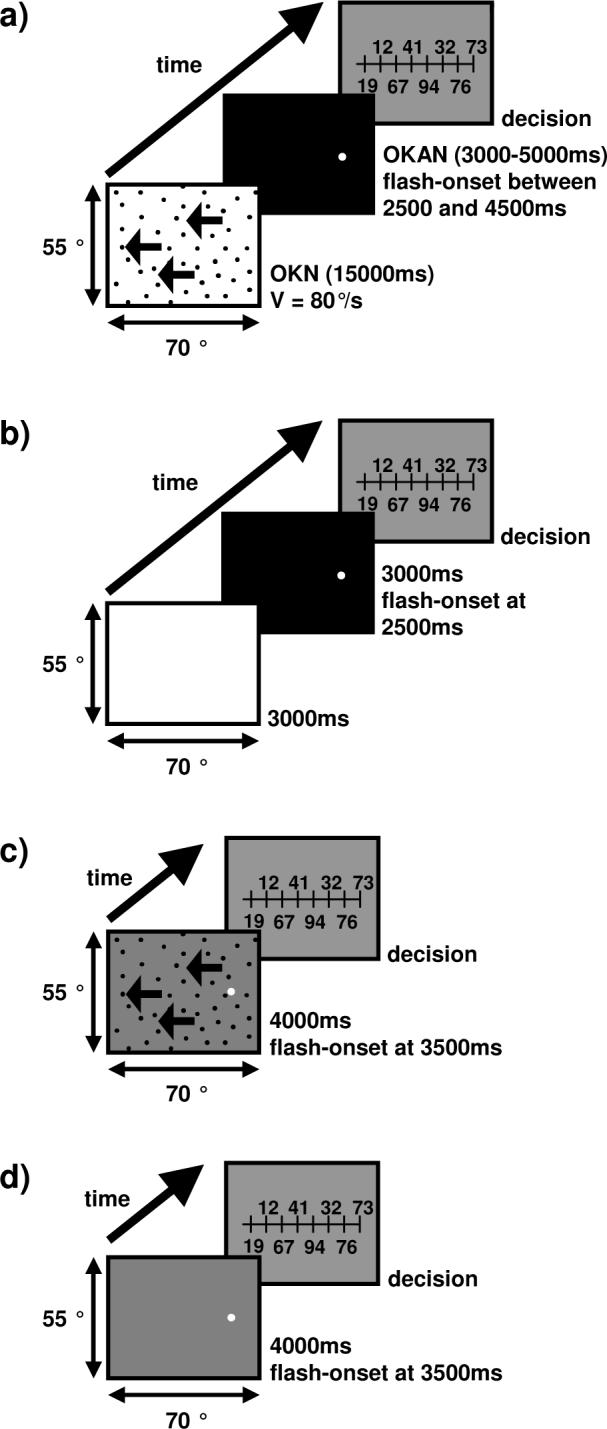
Schematic illustration of the temporal sequence of an OKAN (a), OKAN baseline (b), OKN (c) or OKN baseline trial. (a) During OKAN-trials a RDP moved left- or rightwards for 15s. Thereafter the background turned black. After 2500ms to 4500ms the target was flashed and a ruler appeared 490ms later. Subjects indicated which number on the ruler was closest to the perceived position of the flashed target. (b) During OKAN baseline measurements subjects freely viewed a screen for 6000ms. The initially white screen turned black after 3000ms. The target was flashed 2500 ms after the luminance change. (c) In the OKN condition, the RDP moved leftward for 4000ms. The target was flashed after 3500ms. Again, the ruler was used at the end of the trial to indicate the perceived target position. (d) During OKN baseline trials, subjects freely viewed a gray screen for 4000 ms. The target was presented after 3500 ms and the ruler appeared 490 ms after the target offset.
OKN trials
In the OKN condition, the RDP moved across a gray background (luminance 12.5 cd/m2) for 4000ms. The target was flashed after 3500ms (Figure 1c). The RDP velocity in the OKN condition was set individually for each subject such that the amplitudes of the fast-phases during OKN and OKAN matched as closely as possible. Thirty trials were recorded per session.
OKAN trials
In the OKAN condition the RDP moved on a white background (luminance 22.1cd/m2) at a speed of 80°/s. After 15 seconds of stimulus motion the screen turned completely dark. After 2500ms to 4500ms (depending on subject and session) in darkness, the target was flashed. The ruler was displayed 490ms later (Figure 1a). A single session consisted of 15 trials.
Data analysis
Data was analyzed using Matlab 7.3.0 (The MathWorks, Inc.) and SigmaStat 3.10 (Systat Software, Inc.). Eye-position data for all OKN/OKAN-trials were inspected offline. Trials were excluded from further analysis if (i) subjects had not performed any systematic OKN/OKAN, (ii) the fast-phase closest to the target flash did not match the previously defined velocity/acceleration criterion or if (iii) the fast phase closest to the flash was in the same direction as the slow eye movement, and was initiated less than 100ms after the target flash. Due to these criteria 38% of all OKAN and 21% of all OKN trials were excluded from further analysis. For the remaining valid trials, we determined as a first step the error in the free-viewing condition (baseline error). Then we computed the errors during OKN/OKAN slow phases. For this analysis only trials in which no fast-phase was initiated in a 200 ms time-window centred on the onset of the flash were considered. Net errors were estimated by subtracting baseline errors from OKN/OKAN slow-phase errors.
To determine the dynamics of the localization error around the fast-phases of the OKN/OKAN we first identified the fast phase closest (in time) to the flash. Then we determined the (baseline-corrected) localization error as a function of the time of the flash relative to the onset of the fast-phase and computed a moving average for this data set. The moving average was smoothed with a Gaussian shaped weighing function (σ = 7ms). Data were recorded until data from 150 valid trials in the relevant time-window were available for each subject.
Results
Eye movements during OKN- and OKAN trials
During OKN trials (leftward pattern motion only) fast-phase frequency averaged across subjects was 2.41 (SD 0.34) Hz with fast-phases having a mean horizontal amplitude of 5.3 (SD 1.2) deg. The slow-phase gain (gain = (eye velocity / stimulus velocity)) was 0.89 (SD 0.04) at an average stimulus velocity of 14.54 (SD 1.50) deg/s. Mean pre-flash slow-phase velocity (determined in the last 50ms before flash onset) was 12.85 (SD 1.15) deg/s while the average eye position at flash onset was 5.33 (SD 1.73) deg. The analysis was based upon 8545 fast-phases in 930 trials. During leftward/rightward OKAN trials mean fast-phase frequency during optokinetic stimulation (80deg/s) was 3.07/ 3.17(SD 0.5 / 0.49) Hz with an average horizontal fast-phase amplitude of 13.7/14.4 (SD 2.8 / 2.9) deg. Mean slow-phase gain was 0.66 / 0.72 (SD 0.06 / 0.04). During OKAN the fast-phase frequency and the horizontal fast-phase amplitude dropped to 1.5/0.97 (SD 0.23/0.33) Hz and 3.32/4.8 (SD 0.97 / 1.96) deg, respectively. Average pre-flash slow-phase velocity was −4.07/4.58 (SD 0.82/2.16) deg/s and the average horizontal eye position at flash onset was −2.71/4.46 (SD 2.41/3.36) deg. The analysis was based on 101,987 and 5,977 fast-phases during OKN and OKAN respectively performed during 1388 valid trials.
To summarize, we achieved our goal to match the fast-phase amplitudes during OKN and OKAN; they were within one standard deviation from each other. We could not, however, simultaneously match the slow-phase velocities; they were slower during OKAN than during OKN.
Localization during OKAN slow-phase
The left column of Figure 2 shows the results of the first experiment in head-centered coordinates. During free viewing in darkness (top left panel) perception was not veridical. Instead, we observed a heterogeneous pattern of misperceptions. Three subjects (1, 2, and 8) showed an outward bias (centrifugal shift), while two subjects (5 and 9) showed an inward bias (centripetal shift). The remaining subjects showed a tendency for an overall shift either to the left (subjects 4, 6, and 7) or to the right (subject 3). Across subjects (mean) we found no consistent bias in any direction.
Figure 2.

The graphs show the apparent target position during baseline (top row) and OKAN/OKN slow-phase without (middle row) and with baseline correction (bottom row) for leftward OKAN (left column) and OKN trials (right column). Bars show localization errors. Error bars are 95% confidence intervals.
During the slow phase of the OKAN (middle left panel) perception was biased towards larger eccentricities at the population level (mean). Yet, after correction for the baseline bias (bottom left panel), the remaining shift revealed no clear bias. Two (7, 8) subjects showed a significant (p<0.05) mislocalization opposite to the direction of the slow phase eye movement. Four subjects (1, 2, 3, and 5) mislocalized targets towards larger eccentricities, while two (4 and 6) showed no systematic bias. Only a single subject (9) revealed a shift in the direction of the slow-phase eye movement as we have previously reported for localization during OKN (Kaminiarz et al., 2007).
These results show that there is a large degree of intersubject variability. In order to confirm this finding, we repeated the experiment with rightward OKAN for seven of nine subjects (Figure 3). Again, we found no bias in any particular direction when data were averaged across all subjects. Visual comparison of the baseline corrected findings for leftward and rightward OKAN, however, showed that subjects were consistent in their mislocalization. For instance, subject 7 mislocalized against the direction of the slow-phase eye movement for leftward as well as rightward OKAN. Similarly, subject 3 showed a clear centrifugal effect irrespective of whether the OKAN slow-phase was leftward or rightward.
Figure 3.

Localization errors during rightward OKAN slow-phase without (top panel) and with (bottom panel) baseline correction. Conventions as in Fig. 2.
We will show below that much of the intersubject variability can be understood by analyzing the data in retinal coordinates. Before turning to that explanation, however, we first compare localization during OKAN with that during OKN.
Localization during OKN slow-phase
The kinematics of the eye movements during OKAN are quite similar to those during OKN, hence it is instructive to directly compare mislocalization during OKAN and OKN. Our previous OKN study used small field (monitor size: circular aperture with 25° diameter) rather than the large field visual stimulation (screen size: 70°×55°) of the current study. To exclude this factor as a possible cause for any differences, we repeated some of the OKN experiments in the large-field setup.
The results for localization during OKN are shown in the right column of Figure 2. In the control condition (top right panel) we observed for all but one subject (8) a centripetal shift of perceived target locations. This confirms our previous findings and matches errors of mislocalization found in the absence of eye movements (Müsseler et al., 1999) but is clearly different from our findings for the OKAN baseline in total darkness where we observed a much more heterogeneous error pattern (top left panel). Mislocalization during OKN slow-phase, however, closely matched results from our previous study; position perception during the OKN slow-phase was biased in the direction of the eye movement (right middle and bottom panel). This error was independent of flash position (p=0.71, ANOVA on Ranks)
Error as a Function of Retinal Eccentricity
We determined the effect of retinal eccentricity on localization error for OKAN and large-field OKN as well as during free viewing in darkness and in light. To do so we calculated localization errors as a function of retinal stimulus eccentricity independently for each subject and performed linear regressions for all three stimulus positions (see Fig 4 for data from a single subject). In Figure 5 regression lines for all single subjects (thin lines) as well the population mean (thick lines) are shown. Extending our earlier findings for both free viewing in light (top right panel) and OKN (middle right panel), respectively, mislocalization did not depend on retinal eccentricity as indicated by the flat regression curves. However the localization errors during both free viewing in darkness (top left panel) and slow-phase OKAN (middle left panel) depended strongly on the retinal eccentricity of the flashed target. To further analyze this behavioural difference we performed for each individual subject an eccentricity-dependent baseline correction by subtracting the baseline-fits from the corresponding OKAN-fits (bottom left panel). The data clearly show that on average when a target is flashed on the lagging side of the retina (i.e. on the right when the eye moves to the left and vice versa), it is mislocalized in a direction opposite that of the eye-movement. When a target is flashed on the leading side of the retina, however, it is mislocalized in the direction of the eye-movement. The OKAN-data were obtained during leftward slow-phases, but the same effect was found for rightward slow-phases (not shown). Hence, we can re-phrase this finding as showing a horizontal expansion of visual space in retinal coordinates during horizontal OKAN. The linear regressions of the single subject data provide us with a quantification of this expansion. First, we can determine the focus of the expansion by calculating the eccentricity for which the mislocalization is zero. When averaged across all subjects and all stimulus positions, the focus was found to lie at x = 0.2 degree. Across subjects, this focus of expansion ranged from x = −1.6deg to x = 0.76 deg. Second, the slope of the regressions quantifies the foveofugal mislocalization error per degree of retinal eccentricity. Averaged across subjects the mislocalization increased by 0.12 degrees / deg. eccentricity. This measure was somewhat more variable across subjects (range: [0.03, 0.26]). Most importantly, the correlation between eccentricity and mislocalization was positive and significant (p< 0.01; Spearman Rank Order) for all but one subject. These data confirm that horizontal OKAN slow-phases consistently lead to a horizontal expansion of visual space in retinal coordinates. Accordingly, the explanation of the intersubject variability found in Figure 2 (data in head-centred coordinates) can be found in the differences in average eye-position across OKAN phases in the different subjects. For instance, subject 5 performed leftward OKAN with eye positions mainly on the left side of the screen. Obviously, this shift in eye position has consequences for the average retinal position of the targets that were flashed at fixed positions on the screen. First, the left target was closer to this subject's fovea than it was to the fovea of subjects 2 or 6 who performed OKAN mainly with gaze located at the center of the screen. According to our retinal expansion model, a flash nearer the fovea will be mislocalized less, thus explaining the relatively small leftward mislocalization of subject 5 as shown in Figure 2. Similarly, for subject 5 the central target almost always landed on the lagging side of the retina (and not foveally), thus evoking a much stronger mislocalization.
Figure 4.

The graphs show localization errors as function of retinal stimulus eccentricity during free viewing in darkness (top) and OKAN slow-phase without (middle) and with (bottom) baseline correction for subject 1. Positive errors indicate rightward mislocalization (i.e. against the direction of the slow-phase eye movements). Stimulus positions are color-coded: black: x = −8°; red: x = 0°; blue: x = +8°. Solid lines are linear regressions to the data. The line-length codes the data-distribution with respect to the underlying eye-position, with lines ranging from 5% to 95% of the horizontal eye-position values. The vertical dotted lines mark the position of the fovea at the time of the flash while the horizontal ones mark correct localization. Points to the right of the dotted line depict trials during which the target was presented to the right of the fovea.
Figure 5.

The graphs show linear regressions to the localization error as function of stimulus position relative to the fovea during baseline (top row) and OKAN/OKN slow-phase without (middle row) and with baseline correction (bottom row) for leftward OKAN (left column) and OKN trials (right column). Thin lines display single subject data while thick lines show data averaged across subjects.
This perceptual expansion of visual space was only found during OKAN. The baseline-corrected OKN-data (bottom right panel) clearly show no such effect of retinal stimulus-eccentricity on visual localization.
Localization during OKAN/OKN fast-phase
To analyze the dynamics of the perceptual error in the temporal vicinity of the fast phases we computed the perceived stimulus position as a function of time between flash onset and the initiation of the temporally closest fast-phase. To increase our data-yield per time-window, we merged data from all subjects and flash-positions and calculated a moving average across these data-points. The solid lines in Figure 6 show the results for OKAN (top panel) and OKN (bottom panel), respectively. Dashed lines depict the underlying average eye position traces (trials in which the time-interval between flash-onset and fast-phase onset was larger than 100ms were not considered for calculating the average eye-position trace). While during OKN targets were on average mislocalized 4 deg in direction of the slow-phase eye movement (thin straight horizontal line) no such shift was observed during OKAN. This mirrors the findings shown in Figs 2 and 5. For both eye movements the observed bias depended on the time-interval between stimulus presentation and the onset of the fast-phase.
Figure 6.

Localization errors as a function of time relative to the onset of the temporally closest fast phase during leftward OKAN (top panel) and OKN (bottom panel). Positive errors indicate rightward mislocalization. The dotted horizontal lines indicates unbiased localization while solid horizontal lines represent mean localization errors. The dotted vertical line marks the onset of the fast-phase (t = 0ms). Solid curves are moving averages obtained from the raw data (gray dots) smoothed with a Gaussian shaped weighing function (σ = 7ms). Black dots mark the peak mislocalization in direction of the fast-phase. Dashed curves are mean eye positions traces during OKAN and OKN.
During OKAN flashes were mislocalized in the direction of the fast phase starting 150 ms before fast-phase onset with a peak error 51ms prior to fast-phase onset. Starting at about 20ms before fast-phase onset stimuli were slightly mislocalized in the opposite direction. This mislocalization returned back to its steady state level 100ms after fast-phase onset at the latest.
During OKN we observed a mislocalization in the direction of the fast phase before its onset and mislocalization in the opposite direction about 50ms after fast-phase onset. This fast-phase effect was superimposed on the general shift in direction of the slow-phase eye movement. Contrary to the OKAN, however, the error in direction of the fast-phase peaked 37ms before fast-phase onset. Error patterns during both OKAN and OKN fast-phases were independent of target position i.e. we did not observe any evidence for a compression of space around the fast phase (data not shown). As can be inferred from the eye position traces the average amplitude of the saccade closest (in time) to the flash was nearly identical for both types of eye movements (OKAN: 3.7° (SD 2.7); OKN: 3.5 (SD 2.2)). Statistical analysis comparing mean fast-phase amplitudes across subjects revealed no significant difference (p=.69 Mann-Whitney Rank Sum Test). Surprisingly, however, the amplitude of the biphasic modulation in perceived position induced by the fast-phase was considerably larger during OKAN (3.8°) than during OKN (2.15°).
Discussion
We demonstrated systematic mislocalization of briefly flashed visual targets during optokinetic afternystagmus (OKAN). The observed error pattern varied widely across subjects when expressed in head-centred coordinates, but was highly consistent when expressed in retinal coordinates. In the latter reference frame our data can be summarized as a horizontal expansion of visual space during slow-phase horizontal OKAN. Localization in the temporal vicinity of the fast-phases of the OKAN was modulated. A mislocalization in the direction of the fast-phase was observed prior to fast-phase onset. This perceptual effect was followed by a weak transitory shift into the opposite direction. The perceptual error returned to its steady state level about 100ms after fast-phase onset.
In this discussion we first compare our OKAN findings to those previously reported on other fast and slow eye movements. Second, we discuss the role of visual references in localization. Third, we discuss the claim that a combination of an erroneous eye position signals and veridical retinal signals could underlie these phenomena.
Mislocalization around slow eye movements
OKN, OKAN, and smooth pursuit share similar phases of slow eye movements. Mislocalization during these eye-movements, however, is quite different. During smooth pursuit and OKN slow-phase, but not OKAN slow-phase, stimuli are mislocalized in the direction of the eye movement. During pursuit and OKAN the error pattern depends on the retinal position of the flash (van Beers et al., 2001;Mitrani and Dimitrov, 1982;Mateeff et al., 1982;Rotman et al., 2004), while the error is independent of retinal position during OKN (Kaminiarz et al., 2007). This clearly shows that the kinematics of the eye-movements alone are not sufficient to account for the observed mislocalizations.
There are two clear differences that may in principle account for the disparate localization errors. First, the visual scene is quite different during OKN, smooth pursuit, and OKAN and these visual factors may contribute to mislocalization in various ways (see below for further discussion). Second, the eye-movement control networks involved in OKN, OKAN, and pursuit are distinct, and therefore they may interact in different ways with the visual system. To be specific smooth pursuit and OKN are accompanied by neural activity within identical cortical areas or networks (Schlack et al., 2003;Bremmer et al., 2002;Konen et al., 2005;Dieterich and Brandt, 2000), but with stronger activation during smooth pursuit (Konen et al., 2005). OKAN, on the other hand, is driven by the so called velocity storage mechanism whose neuronal substrate is located in the vestibular nucleus (Waespe and Henn, 1977;Leigh and Zee, 2006). Although we are not aware of any fMRI study investigating human brain activity during OKAN, studies in the macaque suggest that OKAN is not accompanied by specific cortical activity at all (Ilg, 1997). Furthermore, the subcortical Nucleus of the Optic Tract / Dorsal Terminal Nucleus (NOT/DTN) is active during OKN but not OKAN (Ilg and Hoffmann, 1996). This raises the possibility that the involvement or absence of cortical as well as specific subcortical processing may contribute to the observed perceptual differences during slow eye movements.
Mislocalization around fast eye movements
A temporally biphasic mislocalization has been found during voluntary saccades (Honda, 1991;Dassonville et al., 1992), fast-phase OKN (Kaminiarz et al., 2007;Tozzi et al., 2007) and now also fast-phase OKAN. In the spatial domain, these biphasic mislocalizations are quite similar, although a direct comparison across all three fast eye-movements is difficult given that the sizes of the fast movements in the different studies were not matched. In our study, however, the OKN fast-phases matched the OKAN fast-phases and we nevertheless found a much larger spatial modulation during OKAN. This is in line with reports showing that localization errors during voluntary saccades increase when fewer visual references are available (Dassonville et al., 1995;Honda, 1999). In other words, the relatively large effects found during OKAN, compared to OKN may be due to the complete absence of visual references. Interestingly, the errors during OKAN are not only larger than during OKN but also larger than those found during voluntary saccades in darkness. During saccades errors are in the range of up to 50% of the saccadic amplitude. During OKAN the error is about 100% of the fast-phase amplitude. Analogous to the line of arguments above this could be due to the total absence of visual references. In saccade experiments two visual references are available for the subjects: the initial fixation point and the saccade target. Even if both are not present at the time of the flash they allow subjects to build up an internal representation of the environment. During OKAN, on the other hand, subjects performed eye movements without visual goal or feedback for at least 2500ms which should severely constrain the build-up of a representation of the environment. Summarizing, this line of arguments suggests that perceptual bias increases when the internal visual representation of the environment is poor.
In the temporal domain, the biphasic mislocalization differs considerably across eye-movements. For visually guided saccades, the peak error generally occurs at saccade onset (Honda, 1991), while during OKN it occurs about 40ms before fast-phase onset and even earlier during OKAN.
Localization and visual references in the absence of OKAN/OKN
As remarked upon above, differences in visual input could be an important factor affecting mislocalization. This has been suggested before (Lappe et al., 2000) and our current data provide further evidence in favour of this view. Not only do we find very different patterns of mislocalization during OKAN (no visual references) and OKN (with some visual references), our free-viewing baseline trials support a similar view. We tested the same subjects during free gaze in light and in darkness and found a systematic centripetal (inward) bias in light but a centrifugal (outward) bias in complete darkness. This may also explain why previous studies reported disparate results concerning localization of targets during fixation. Some reported an overall centripetal bias (Kaminiarz et al., 2007;Müsseler et al., 1999;Mateeff and Gourevich, 1983) while others reported a centrifugal bias (Honda, 1989;Königs et al., 2007). Our data suggest that the details of the visual references are critical in those experiments and may explain some of the observed discrepancies.
The neural basis of visual mislocalization
It has been argued that localization errors during smooth eye movements could be due to a sluggish or delayed eye position signals which is combined with veridical retinal signals to determine the (world) position of the flashed stimulus (Schlag and Schlag-Rey, 2002). However, as discussed above, different patterns of mislocalization are observed during fast and slow eye-movements with very similar kinematics. To explain all mislocalizations with the same mismatch between eye-position signals and veridical retinal signals, one would have to assume that the eye-position signals generated by these three eye movements are very different. For smooth pursuit mislocalization, the eye-position signal should be sluggish, but the sluggishness/delay should vary with retinal eccentricity, for slow-phase OKN, the eye-position signal should be sluggish throughout the visual field, and for slow-phase OKAN, the eye-position signal should be veridical foveally, whereas it should lead on the leading side of the retina, and lag on the lagging side of the retina. For fast phases, these eye-position signals should then be modulated appropriately to account for the spatio-temporal mislocalization around fast eye movements.
We cannot exclude that such complex eye-position signals exist, but note that there is no evidence beyond that gathered in mislocalization experiments that supports their existence. Accordingly, based on our current results, we believe that mislocalization is not caused by the algebraic summation of a veridical retinal signal with an erroneous eye-position signal. Instead, these findings support the view that the underlying retinal signals are distorted. When distorted retinal position information is combined with (veridical or otherwise) eye-position signals, perceptual mislocalization in head-centred coordinates occurs. Explicit support for errors in eye-centred neural position signals comes from recordings in the middle temporal and medial superior temporal areas of the macaque. Neurons in MT and MST encode position information but this information is distorted around saccades in a manner that mimics the peri-saccadic compression of space (Krekelberg et al., 2003). The fact that a neural correlate of space compression is already found in an area encoding eye-centered position information suggests that the effect is not caused by a combination of retinal and eye-position information. Our current finding, that mislocalization during slow-phase OKAN is best understood in retinal rather than in head-centred coordinates also suggests that it arises from distortions of the representation in early visual areas, with a retinocentric encoding of space. These changes of the early visual representation may be related to mechanisms whose aim is to hide retinal motion that is caused by the eye-movements themselves (Kleiser et al., 2004). Such an early, purely visual basis for mislocalization would also be consistent with the fact that the details of the visual scene have such a large influence on mislocalization.
Acknowledgments
This work was made possible by financial support of the Deutsche Forschungsgemeinschaft (GRK-885-NeuroAct, FOR-560: AK & FB) and the European Union (EU-MEMORY: AK & FB) , the Pew Charitable Trusts (BK) and the NIH (BK: R01EY017605).
Reference List
- 1.Bremmer F, Klam F, Duhamel JR, Ben Hamed S, Graf W. Visual-vestibular interactive responses in the macaque ventral intraparietal area (VIP). Eur J Neurosci. 2002;16:1569–1586. doi: 10.1046/j.1460-9568.2002.02206.x. [DOI] [PubMed] [Google Scholar]
- 2.Cai RH, Pouget A, Schlag-Rey M, Schlag J. Perceived geometrical relationships affected by eye-movement signals. Nature. 1997;386:601–604. doi: 10.1038/386601a0. [DOI] [PubMed] [Google Scholar]
- 3.Dassonville P, Schlag J, Schlag-Rey M. Oculomotor localization relies on a damped representation of saccadic eye displacement in human and nonhuman primates. Vis Neurosci. 1992;9:261–269. doi: 10.1017/s0952523800010671. [DOI] [PubMed] [Google Scholar]
- 4.Dassonville P, Schlag J, Schlag-Rey M. The use of egocentric and exocentric location cues in saccadic programming. Vision Res. 1995;35:2191–2199. doi: 10.1016/0042-6989(94)00317-3. [DOI] [PubMed] [Google Scholar]
- 5.Dieterich M, Brandt T. Brain activation studies on visual-vestibular and ocular motor interaction. Curr Opin Neurol. 2000;13:13–18. doi: 10.1097/00019052-200002000-00004. [DOI] [PubMed] [Google Scholar]
- 6.Honda H. Perceptual localization of visual stimuli flashed during saccades. Percept Psychophys. 1989;45:162–174. doi: 10.3758/bf03208051. [DOI] [PubMed] [Google Scholar]
- 7.Honda H. The time courses of visual mislocalization and of extraretinal eye position signals at the time of vertical saccades. Vision Res. 1991;31:1915–1921. doi: 10.1016/0042-6989(91)90186-9. [DOI] [PubMed] [Google Scholar]
- 8.Honda H. Modification of saccade-contingent visual mislocalization by the presence of a visual frame of reference. Vision Res. 1999;39:51–57. doi: 10.1016/s0042-6989(98)00134-5. [DOI] [PubMed] [Google Scholar]
- 9.Ilg UJ. Responses of primate area MT during the execution of optokinetic nystagmus and afternystagmus. Exp Brain Res. 1997;113:361–364. doi: 10.1007/BF02450334. [DOI] [PubMed] [Google Scholar]
- 10.Ilg UJ, Hoffmann KP. Responses of neurons of the nucleus of the optic tract and the dorsal terminal nucleus of the accessory optic tract in the awake monkey. Eur J Neurosci. 1996;8:92–105. doi: 10.1111/j.1460-9568.1996.tb01170.x. [DOI] [PubMed] [Google Scholar]
- 11.Kaiser M, Lappe M. Perisaccadic mislocalization orthogonal to saccade direction. Neuron. 2004;41:293–300. doi: 10.1016/s0896-6273(03)00849-3. [DOI] [PubMed] [Google Scholar]
- 12.Kaminiarz A, Krekelberg B, Bremmer F. Localization of visual targets during optokinetic eye movements. Vision Res. 2007;47:869–878. doi: 10.1016/j.visres.2006.10.015. [DOI] [PubMed] [Google Scholar]
- 13.Kleiser R, Seitz RJ, Krekelberg B. Neural correlates of saccadic suppression in humans. Curr Biol. 2004;14:386–390. doi: 10.1016/j.cub.2004.02.036. [DOI] [PubMed] [Google Scholar]
- 14.Konen CS, Kleiser R, Seitz RJ, Bremmer F. An fMRI study of optokinetic nystagmus and smooth-pursuit eye movements in humans. Exp Brain Res. 2005;165:203–216. doi: 10.1007/s00221-005-2289-7. [DOI] [PubMed] [Google Scholar]
- 15.Königs K, Knöll J, Bremmer F. Localisation of auditory targets during optokinetic nystagmus. Perception. 2007;36:1507–1512. doi: 10.1068/p5849. [DOI] [PubMed] [Google Scholar]
- 16.Krekelberg B, Kubischik M, Hoffmann KP, Bremmer F. Neural correlates of visual localization and perisaccadic mislocalization. Neuron. 2003;37:537–545. doi: 10.1016/s0896-6273(03)00003-5. [DOI] [PubMed] [Google Scholar]
- 17.Lappe M, Awater H, Krekelberg B. Postsaccadic visual references generate presaccadic compression of space. Nature. 2000;403:892–895. doi: 10.1038/35002588. [DOI] [PubMed] [Google Scholar]
- 18.Leigh RJ, Zee DS. The Neurology of eye movements. Oxford University Press; 2006. [Google Scholar]
- 19.Mateeff S, Gourevich A. Peripheral vision and perceived visual direction. Biol Cybern. 1983;49:111–118. doi: 10.1007/BF00320391. [DOI] [PubMed] [Google Scholar]
- 20.Mateeff S, Mitrani L, Stojanova J. Visual localization during eye tracking on steady background and during steady fixation on moving background. Biol Cybern. 1982;42:215–219. doi: 10.1007/BF00340078. [DOI] [PubMed] [Google Scholar]
- 21.Mitrani L, Dimitrov G. Retinal location and visual localization during pursuit eye movement. Vision Res. 1982;22:1047–1051. doi: 10.1016/0042-6989(82)90041-4. [DOI] [PubMed] [Google Scholar]
- 22.Müsseler J, van der Heijden AH, Mahmud SH, Deubel H, Ertsey S. Relative mislocalization of briefly presented stimuli in the retinal periphery. Percept Psychophys. 1999;61:1646–1661. doi: 10.3758/bf03213124. [DOI] [PubMed] [Google Scholar]
- 23.Ross J, Morrone MC, Burr DC. Compression of visual space before saccades. Nature. 1997;386:598–601. doi: 10.1038/386598a0. [DOI] [PubMed] [Google Scholar]
- 24.Ross J, Morrone MC, Goldberg ME, Burr DC. Changes in visual perception at the time of saccades. Trends Neurosci. 2001;24:113–121. doi: 10.1016/s0166-2236(00)01685-4. [DOI] [PubMed] [Google Scholar]
- 25.Rotman G, Brenner E, Smeets JB. Quickly tapping targets that are flashed during smooth pursuit reveals perceptual mislocalisations. Exp Brain Res. 2004;156:409–414. doi: 10.1007/s00221-003-1795-8. [DOI] [PubMed] [Google Scholar]
- 26.Schlack A, Hoffmann KP, Bremmer F. Selectivity of macaque ventral intraparietal area (area VIP) for smooth pursuit eye movements. J Physiol. 2003;551:551–561. doi: 10.1113/jphysiol.2003.042994. [DOI] [PMC free article] [PubMed] [Google Scholar]
- 27.Schlag J, Schlag-Rey M. Through the eye, slowly: delays and localization errors in the visual system. Nat Rev Neurosci. 2002;3:191–215. doi: 10.1038/nrn750. [DOI] [PubMed] [Google Scholar]
- 28.Tozzi A, Morrone MC, Burr DC. The effect of optokinetic nystagmus on the perceived position of briefly flashed targets. Vision Res. 2007;47:861–868. doi: 10.1016/j.visres.2006.10.022. [DOI] [PubMed] [Google Scholar]
- 29.van Beers RJ, Wolpert DM, Haggard P. Sensorimotor integration compensates for visual localization errors during smooth pursuit eye movements. J Neurophysiol. 2001;85:1914–1922. doi: 10.1152/jn.2001.85.5.1914. [DOI] [PubMed] [Google Scholar]
- 30.Waespe W, Henn V. Vestibular nuclei activity during optokinetic after-nystagmus (OKAN) in the alert monkey. Exp Brain Res. 1977;30:323–330. doi: 10.1007/BF00237259. [DOI] [PubMed] [Google Scholar]