Abstract
The whole genome sequence of Tribolium castaneum, a worldwide coleopteran pest of stored products, has recently been determined. In order to facilitate accurate annotation and detailed functional analysis of this genome, we have compiled and analyzed all available expressed sequence tag (EST) data. The raw data consist of 61,228 ESTs, including 10,704 obtained from NCBI and an additional 50,524 derived from 32,544 clones generated in our laboratories. These sequences were amassed from cDNA libraries representing six different tissues or stages, namely: whole embryos; whole larvae; larval hindguts and Malpighian tubules; larval fat bodies and carcasses; adult ovaries; and adult heads. Assembly of the 61,228 sequences collapsed into 12,269 clusters (groups of overlapping ESTs representing single genes), of which 10,134 mapped onto 6,463 (39%) of the 16,422 GLEAN gene models (i.e. official Tribolium gene list). Approximately 1,600 clusters (13% of the total) lack corresponding GLEAN models, despite high matches to the genome, suggesting that a considerable number of transcribed sequences were missed by the gene prediction programs or were removed by GLEAN. We conservatively estimate that the current EST set represents more than 7,500 transcription units.
Introduction
The red flour beetle, Tribolium castaneum, is an important coleopteran pest of stored grain and cereal products. Coleoptera is the most diverse order, by some estimates contributing more than one-third of all eukaryotic species. This remarkably adaptable evolutionary group includes a profusion of devastating agricultural pests, such as the corn rootworm, Colorado potato beetle, elm bark beetle, southern pine beetle, and many others. Tribolium is the most sophisticated and flexible genetic model for the beetles. This insect has a number of physiological adaptations not found in other insect species with fully-sequenced genomes (e.g., Drosophila melanogaster, Anopheles gambiae, and Apis mellifera). For example, Tribolium has a short-germ mode of embryonic development more characteristic of the primitive condition. In addition, Tribolium belongs to a unique group of desiccation-tolerant insects with specialized cryptonephridial organs for active rectal absorption of atmospheric water (Koefoed 1975). Finally, as the only omnivorous arthropod with a fully-sequenced genome, Tribolium has revealed novel innovations involving digestive physiology as well as pest adaptations to plant defense chemistry (Tribolium genome consortium, 2007). Tools for functional genomic evaluation in this model organism are available, including piggyBac transposable element-mediated transgenesis (Berghammer et al. 1999; Lorenzen et al. 2002; 2003; 2007), and RNA interference (RNAi), a technique shown to be particularly effective in Tribolium (Bucher et al. 2002; Tomoyasu and Denell 2004).
The genome sequence of Tribolium was completed in 2005 along with the first version of the genome assembly (Tcas1.0; http://www.hgsc.bcm.tmc.edu/projects/tribolium/). Almost 90% of the ~152-Mb assembly has been aligned with the 10 linkage groups using a genetic recombination map (Lorenzen et al. 2005). After further refinement of the assembly (Tcas2.0), automated annotation was performed utilizing two annotation pipelines and four ab initio gene prediction programs (Tribolium genome consortium, 2007). A final gene set was generated using the GLEAN algorithm (Elsik et al. 2007) to combine the results from diverse gene prediction programs into one consensus set. Based on the number of GLEAN gene models, the genome assembly encodes ~16,500 genes (Tribolium genome consortium, 2007). In order to improve the accuracy of the genome annotation, we undertook a large-scale expressed sequence tag (EST) project.
An efficient approach to genome-scale identification of transcribed sequences is the automated generation of large numbers of EST reads by sequencing one or both ends of randomly selected clones from one or more cDNA libraries. In order to increase the efficiency of new-transcript discovery, the library may be enriched in full-length transcripts and normalized to increase diversity. When aligned with the assembled genome, these sequences improve the accuracy of de novo or preliminary evidence-based gene prediction and annotation by providing more complete data on intron/exon structure and 5’- and 3’-untranslated regions. Specific cDNA clones from genes of interest can be used in various downstream applications, such as functional expression, transgenesis, or RNAi. In addition, EST data obtained from tissue- or stage-specific libraries can provide hints about gene expression patterns. We report here the results of analyses of over 60,000 EST sequences, including >50,000 sequences from five different tissue- or stage-specific cDNA libraries, in addition to >10,000 sequences previously available at NCBI.
Materials and Methods
cDNA libraries
Five cDNA libraries were derived from the highly inbred strain Georgia-2 (GA-2; Lorenzen et al. 2002). The tissue- or stage- enriched libraries were: TH (adult hindguts and Malpighian tubules); TL (mixed-stage, whole larvae); TF (larval fatbody and epidermal layer from immune-challenged insects); TO (adult ovaries); and TB (adult heads). Insects used for the TL and TF libraries consisted mostly of feeding-stage, late-instar larvae, but in the case of the TL library, small numbers of pre-pupae and young pupae were also included. Approximately 1000 insects were harvested for each library. Dissections were performed in phosphate buffered saline and tissues were preserved in RNAlater® (Ambion, Austin, TX) at −80°C until the mRNA is extracted for TL and TH libraries. Other tissues were flash-frozen in liquid nitrogen and sent to the commercial source (Invitrogen, Carlsbad, CA) for the library construction. Tissues were obtained from approximately equal numbers of males and females. For the tissues from adult stage, insects were harvested less than one-month after eclosion.
Tissues for the TF library were harvested from larvae that had been immune-challenged as follows: Escherichia coli, Micrococcus luteus, and blastospores of Beauveria bassiana were cultured to log phase, killed with 2% formaldehyde, washed three times in deionized water, and pelleted. Equal volumes of the pellets were combined, and larvae were pricked in the thorax with a fine needle (minuten pin, BioQuip, Inc., Rancho Dominguez, CA) dipped in the combined pellet. After incubating the larvae for 18 h at 30°C, heads, terminal abdominal segments, and alimentary canals were removed, and the remaining carcasses were flash-frozen in liquid nitrogen.
The TL and TH libraries were prepared from total RNA isolated using TRIZOL® Reagent (Invitrogen) followed by messenger RNA (mRNA) isolation using Dynabeads® mRNA Purification Kit (Invitrogen). TH and TL libraries were constructed with the SuperScript™ Plasmid System (Invitrogen) using the pSPORT.CMV6 plasmid vector according to the manufacturer’s protocol. TF, TO, and TB libraries were constructed as described above, but by a commercial source (Invitrogen) from flash-frozen tissue shipped on dry ice. The latter three libraries were normalized using DNA collected from the TL library as bait. In addition, the TF library was constructed from full-length enriched cDNAs using CAP site selection followed by recombination-based Gateway® cloning (Invitrogen).
EST data and sequence analysis
A total of 32,544 clones were sequenced, including ~24,400 from both the 5’ and 3’ directions and the remainder from only the 5’ direction. Most of the EST sequences obtained from the TH and TL libraries were provided by The Human Genome Sequencing Center, Baylor College of Medicine, Houston, TX. Other libraries were sequenced by SeqWright (Houston, TX) or by the Institute for Integrative Genome Biology (University of California, Riverside). EST sequences were deposited in dbEST at GenBank (http://www.ncbi.nlm.nih.gov/dbEST/index.html) with the accession numbers TO1, ES552901 to ES554556; TB1, ES554600 to ES546047; TL2, ES550987 to ES552900; TH1, ES548430 to ES550986; TF1, ES546048 to ES548429.
Most of the 10,704 EST sequences downloaded from NCBI were derived from either of two libraries. The first set is 2,519 sequences (TE), including 2,466 entries by Savard and Tautz (e.g., DR753993) from an embryonic stage library constructed by Reinhard Schröder, and 53 entries from RACE product (e.g., DR953993) submitted by the same group. The second set is the EX library made by Exelixis Inc. from mixed larva and adults. These sequences were submitted by Schmitt (Open Biosystems, Inc, e.g., EC011169), by Lorenzen et al. (2005), or by Brown (e.g., DN644292). We found a number of redundancies in this set, and duplicates were removed to prepare the nonredundant data set.
Raw sequence data were trimmed to remove poor quality and vector sequence via default parameters using Sequencher™ (Gene Codes Corporation, Ann Arbor, MI). Paired, overlapping 5’ and 3’ sequences of each clone were assembled into contigs. In the absence of overlap, paired reads were force-joined with insertion of an arbitrary 20N linker. UniEST clusters were formed by assembling the sequences greater than 90% identical in a 30 bp window in Sequencher™.
BLAST searches (Altschul et al. 1997) were performed against the GLEAN consensus gene set (05-19-2006 version) (Elsik et al. 2007), the genome assembly (Tcas_2), and the UniProt set obtained from EBI (http://www.ebi.ac.uk/uniprot/database/download.html, 07-21-2006) using BlastStation v. 2.4 (TM software, CA), which has adapted NCBI BLAST 2.2.14. Gene Ontology (GO) annotation was derived using Blast2GO (http://www.blast2go.de/) (Conesa et al. 2005).
Results and Discussion
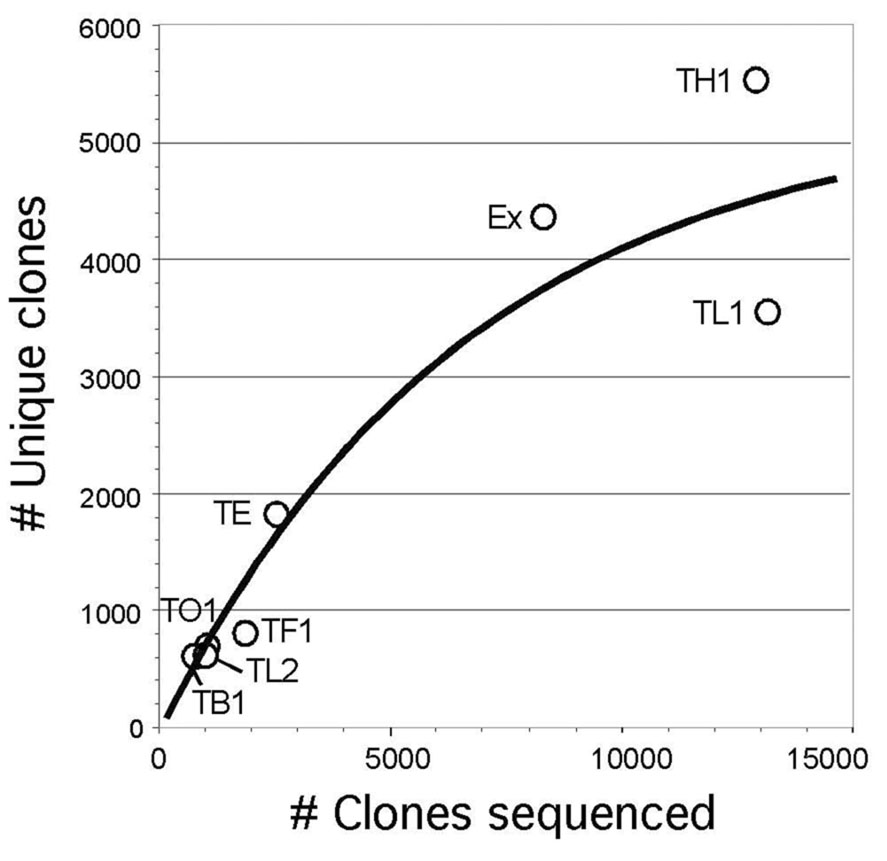
Most of the EST data used in this study were obtained from primary clones of the TH1 and TL1 libraries (Table 1). In comparisons among the sequences from the libraries TH1, TL1, and EX, the EX library provided the lowest redundancy, and the highest gene discovery rate (54%), defined as the percentage of unique clones among the total set of clones sequenced (Table 1 and Fig. 1). The TE library also had a relatively high gene discovery rate with low redundancy. However, there were many sequences in this library that did not match the Tribolium genome assembly, suggesting the presence of non-Tribolium sequences or low quality sequences (Table 1). More extensive sequencing of the TF1 and TB1 libraries is currently underway because the former is enriched in full-length transcripts, and the latter provides the high gene discovery rate.
Table 1.
Summary of cDNA libraries and the results of expressed sequence tag (EST) analysis.
| Name | Tissue source | # Original primary clones | Fold-reduction in normalization | Average insert size | Total # sequences 1 | Total # clones1 | # Unique clones (%) | #UniESTs (%)2 | %Specific uniESTs | % of ESTs matching genome3 |
|---|---|---|---|---|---|---|---|---|---|---|
| TH1 | Hindgut and Malpighian tubules | ~107 | NA | nd | 23,236 | 14,654 | 5,537 (38%) | 2,904 (20%) | 24% | 97 |
| TL1 | Mixed larval stages | ~107 | NA | nd | 20,120 | 13,085 | 3,559 (27%) | 1,600 (12%) | 13% | 93 |
| TL2 | Normalized TL1 | NA | Beta-actin 36x | 1.5kb | 1,708 | 1,050 | 640 (61%) | 143 (14%) | 1% | 98 |
| TF1 | Fatbody full-length, normalized | 3.8 × 10⁷ | EF1 alpha 93x | 2.4kb | 2,270 | 1,818 | 879 (45%) | 309 (17%) | 3% | 98 |
| TO1 | Ovary normalized | 5 × 10⁶ | EF1 alpha 11.7x | 2.0kb | 1,742 | 1,082 | 727 (67%) | 323 (30%) | 2% | 67 |
| TB1 | Head (Brain) normalized | 3.6 × 10⁶ | EF1 alpha 12x | 1.3kb | 1,448 | 855 | 633 (74%) | 251 (30%) | 2% | 94 |
| TE | Embryo | Downloaded from NCBI | 2,519 | 2,519 | 1,823 (72%) | 1,204 (48%) | 10% | 60 | ||
| EX4 | Mixed stages | Downloaded from NCBI | 8,185 | 8,185 | 4,379 (54%) | 2,121 (13%) | 17% | 95 | ||
| total | 61,228 | 43,248 | 12,351 | 72%5 | 92 | |||||
~70% of the clones were sequenced from both ends.
Expressed as a percentage of the total number of clones sequenced from the library.
E-value lower than 1E-50 in the BLAST search.
Refers to the Exelixis library (see Materials & Methods).
Remaining 28% of ESTs were redundant in multiple libraries.
Fig. 1.
Diversity of the clones within each Tribolium cDNA library. The function of exponential association was used for the regression with the equation: y = y0 + A1*(1 − exp(−x/t1)) + A2*(1 − exp(−x/t2)), y0, A1, t1, A2, and t2 are 0.18,2751, 6903, 2736, and 6904, respectively (R2 = 0.916). Note that incremental redundancy increases as more clones are sequenced.
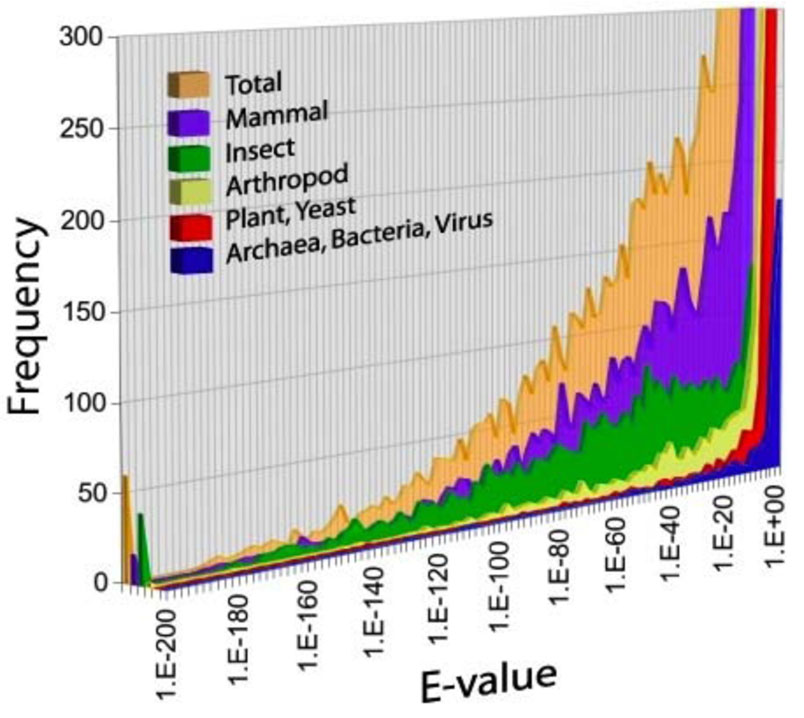
The current version of the Tribolium EST database contains a total of 61,228 EST sequences derived from 32,544 cDNA clones, in addition to 10,704 sequences obtained from NCBI (Table 1). These sequences collapse into 12,351 clusters (uniESTs) after assembly of 5’ and 3’ reads and elimination of redundancies. TBLASTN against the UniProt database (UniProt, http://www.pir.uniprot.org/) identified matches for 6,546 uniEsts (53% of the total) having high-scoring segment pairs (HSPs) with highly significant E-values (E<1e-10). Of these, the majority of HSPs were matches to other insect proteins. A portion of HSPs, with moderate E-values, were matches to mammalian sequences, possibly indicating either a bias towards mammalian sequences in the database, or the presence of ancestral genes that are retained in Tribolium but not in other insects. A portion of the HSPs included genes from plants, yeast, bacteria, and viruses, but these generally had higher E-values and are of questionable significance (Fig. 2).
Fig. 2.
Histogram showing cumulative frequency distribution of BLAST results (E-value) for Tribolium uniESTs. Results are categorized by taxon producing the highest-scoring pair HSP.
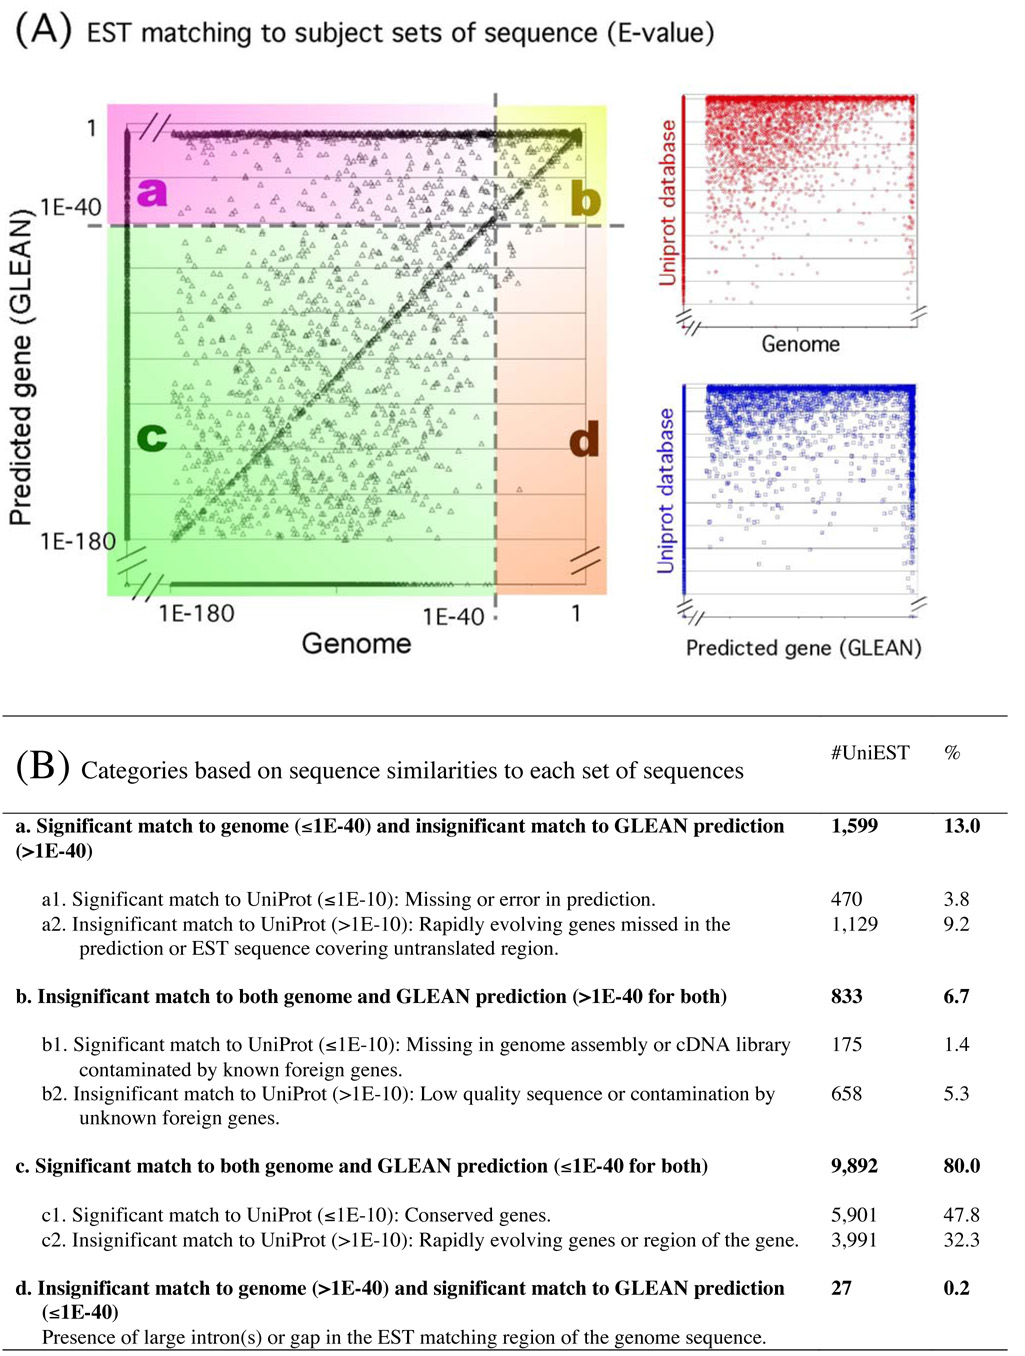
Slightly less than half of the 61,228 EST sequences analyzed in this study were used to support the various gene prediction programs that were merged to form the GLEAN consensus set, while more than half of the EST sequences were entered into GenBank after the GLEAN predictions were made. A comparison of the uniEST data to the GLEAN set revealed that 9,919 uniESTs (87% of the total) map onto 6,463 GLEAN genes (39% of 16,422 GLEAN genes, Fig. 3A, categories c and d), indicating that multiple uniESTs redundantly predict the same gene. The inverse, however, has not been included in those numbers: when an EST clone spanned multiple GLEAN predictions, only one GLEAN gene having the highest match was counted. EST analysis has revealed several examples of GLEAN predictions that incorrectly merged separate genes into a single computed gene. Therefore, the 39% coverage of the GLEAN genes by the uniESTs calculated by this method is probably an underestimate.
Fig. 3.
Plot showing similarities of uniESTs to the genome and to gene/protein predictions. (A) shows the match of each individual uniEST to GLEAN models, Genome sequence, and the UniProt database, in all three paired combinations. The plot for similarities to GLEAN × Genome is divided into four categories a, b, c, and d in different colors, depending on the E-values in the blast searches. (B) summarizes the interpretations made for each category shown in (A), giving numbers and percentages of uniESTs in each category. Note that E-values for GLEAN and Genome sequences are derived from BLASTN, and those for UniProt are from TBLASTN, thus the critical E-values in (B) were set 1E-40 and 1E-10, respectively.
We found that ~1,600 uniESTs lacked corresponding GLEAN predictions (Fig. 3A, category a). These included 470 uniESTs with significant matches in UniProt (Fig. 3B, category a1). It is possible that some of these are novel transcripts in the Tribolium genome, while others could reflect contamination from foreign DNA. An additional 1,129 uniESTs were missed by GLEAN and lack significant matches to UniProt (Fig. 3B, category a2). These may be rapidly evolving genes, or they may represent untranslated regions of the transcription units. Rapidly evolving genes may represent those specific to Tribolium or to the Coleoptera. A group of 658 uniESTs failed to give high matches either to the genome, to GLEAN, or to UniProt (Fig. 3B, category b2). Most of these probably represent low quality sequence reads. The TE library contributed the majority of these sequences (424 out of 658), which often consisted of simple repeats and/or short read-lengths. Combining this information and accounting for the redundancy of uniESTs in the GLEAN consensus set, we conservatively estimate that the current uniEST set covers more than 7,500 genes (47% of the estimated total of ~16,000 genes).
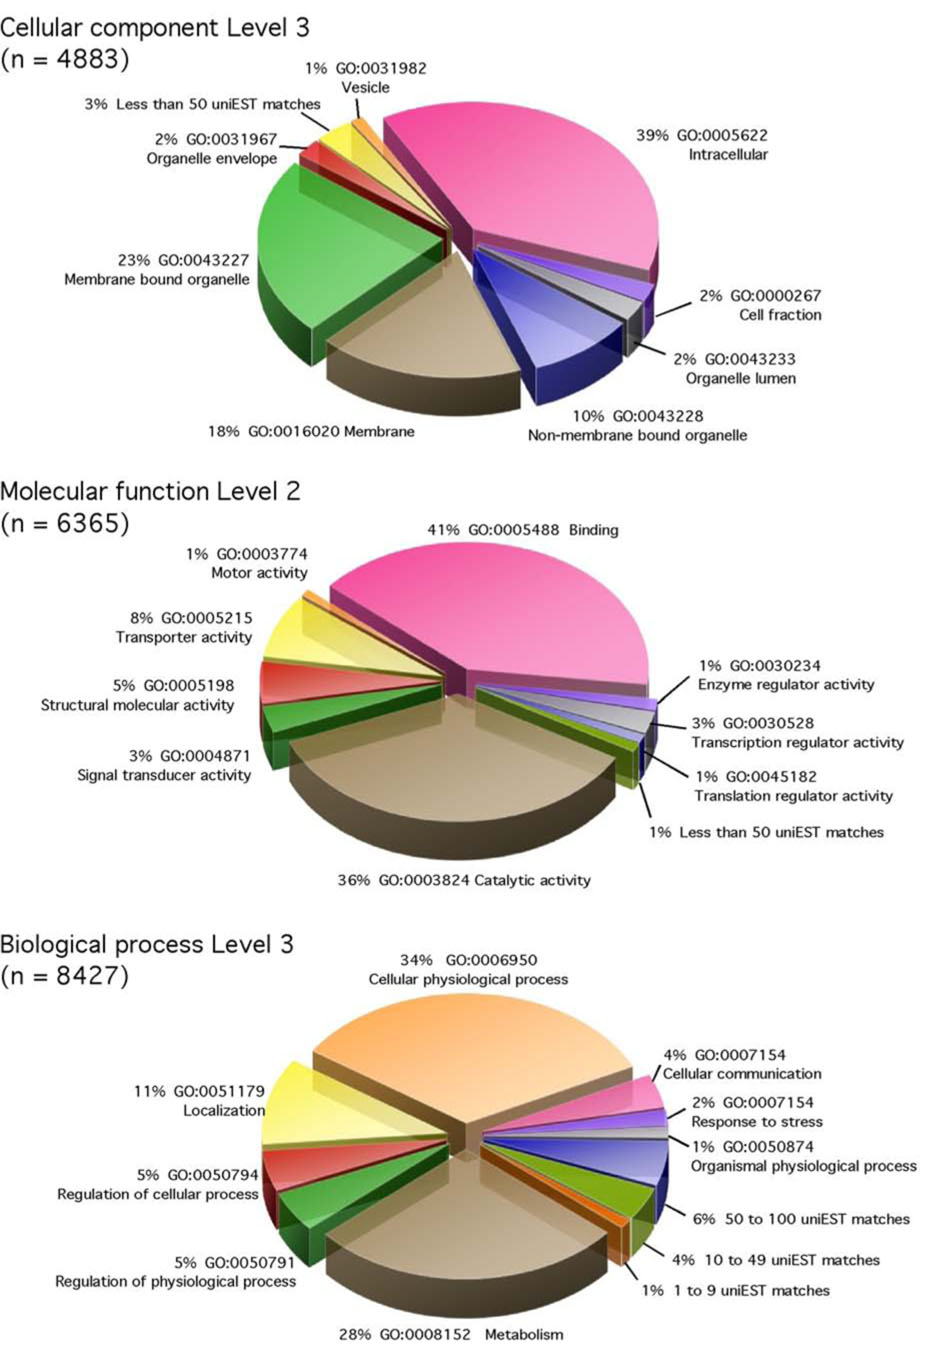
Fig. 4 shows the uniEST set classified using the Gene Ontology (GO) terms for cellular component, molecular function, and biological process. A broad range of components, functions, and processes is represented in the EST data, indicating the wide diversity of genes that have been captured in this EST project. Of particular note is the large portion of sequences encoding transporter activity (8% of the classification by molecular function). This is possibly due to sequences derived from the TH library presenting the transcripts from hindgut and Malpighian tubules the tissues involved in epithelial transport of solutes.
Fig. 4.
Gene Ontology (GO) terms of the uniESTs for cellular component, molecular function, and biological process. The levels were arbitrarily chosen for the best visual presentations. For the same reason, the GO terms containing less than 50 uniESTs (in cellular component and molecular function) or 1–9, 10–49, 50–100 uniESTs (in biological process) were combined into the groups in the graph.
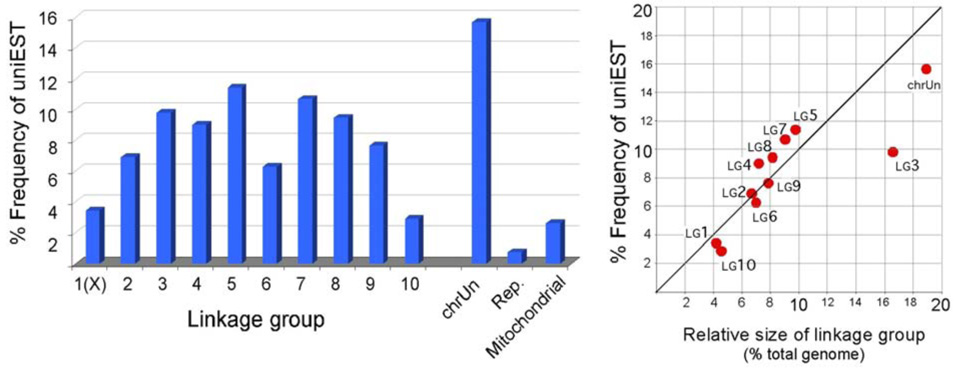
The genome assembly has been integrated with the linkage maps, resulting in 10 linkage group sequences representing the X chromosome and 9 autosomes, and an 11th artificial “unknown” linkage group (Tribolium genome consortium, 2007). The latter was created by connecting all unmapped sequence scaffolds in arbitrary linear order, and does not represent a real chromosome. Mapping the uniESTs onto these 11 linkage groups indicates that, with one exception, (Fig. 5) the number of uniESTs on each linkage group was roughly proportional to chromosome sequence length. The one notable exception was linkage group 3, the longest linkage group, which was relatively sparsely endowed with uniESTs. Linkage groups 4, 5, 7 and 8 were slightly overrepresented by uniESTs.
Fig. 5.
UniESTs mapped onto linkage groups. The unmapped sequence scaffolds are arbitrarily joined and named as chrUn (linkage group unknown). “Rep.” signifies reptigs, i.e. contigs that are highly repetitive and not included in the chromosomal scaffolds.
These EST data provide useful information for studies in Tribolium. Almost 90% of uniESTs map onto predicted genes, attesting to the overall accuracy and usefulness of the GLEAN gene set. Current EST data will be further expanded and utilized to determine intron/exon structure with even greater accuracy, and to identify splicing variants as well as 5’- and 3’-untranslated sequences, all of which are difficult to predict from automated annotations of genome sequence. Furthermore, a large portion (~1,600) of uniESTs lacks corresponding GLEAN models, indicating a continued need for additional EST projects. Additional survey of the Tribolium genome by EST analyses will further improve the automated annotation. Further sequencing of these libraries is being conducted and will be reported in a future publication.
Acknowledgements
This study was funded by the KSU-Plant Biotechnology Center, by NIH Grant Number P20 RR016475 from the INBRE Program of the National Center for Research Resources, and by USDA-NRI-CRSEES 2007-35604-17759. We thank Shiela Prabhakar and Mukta Pahwa for insect dissections. This is Contribution Number 07-218-J from Kansas Agricultural Experimental Station. Mention of trade names or commercial products in this publication is solely for the purpose of providing specific information and does not imply recommendation or endorsement by the U.S. Department of Agriculture.
Footnotes
Publisher's Disclaimer: This is a PDF file of an unedited manuscript that has been accepted for publication. As a service to our customers we are providing this early version of the manuscript. The manuscript will undergo copyediting, typesetting, and review of the resulting proof before it is published in its final citable form. Please note that during the production process errors may be discovered which could affect the content, and all legal disclaimers that apply to the journal pertain.
References
- Altschul SF, Madden TL, Schaffer AA, Zhang J, Zhang Z, Miller W, Lipman DJ. Gapped BLAST and PSI-BLAST: a new generation of protein database search programs. Nucleic Acids Res. 1997;25:3389–3402. doi: 10.1093/nar/25.17.3389. [DOI] [PMC free article] [PubMed] [Google Scholar]
- Berghammer AJ, Klingler M, Wimmer EA. A universal marker for transgenic insects. Nature. 1999;402:370–371. doi: 10.1038/46463. [DOI] [PubMed] [Google Scholar]
- Bucher G, Scholten J, Klingler M. Parental RNAi in Tribolium (Coleoptera) Curr Biol. 2002;12:R85–R86. doi: 10.1016/s0960-9822(02)00666-8. [DOI] [PubMed] [Google Scholar]
- Conesa A, Gotz S, Garcia-Gomez JM, Terol J, Talon M, Robles M. Blast2GO: a universal tool for annotation, visualization and analysis in functional genomics research. Bioinformatics. 2005;21:3674–3676. doi: 10.1093/bioinformatics/bti610. [DOI] [PubMed] [Google Scholar]
- Elsik CG, Mackey AJ, Reese JT, Milshina NV, Roos DS, Weinstock GM. Creating a honey bee consensus gene set. Genome Biol. 2007;8:R13. doi: 10.1186/gb-2007-8-1-r13. [DOI] [PMC free article] [PubMed] [Google Scholar]
- Koefoed BM. The cryptonephridial system in the mealworm Tenebrio molitor: transport of radioactive potassium, thallium and sodium; a functional and structural study. Cell Tissue Res. 1975;165:63–78. doi: 10.1007/BF00222800. [DOI] [PubMed] [Google Scholar]
- Lorenzen MD, Berghammer AJ, Brown SJ, Denell RE, Klingler M, Beeman RW. piggyBac-mediated germline transformation in the beetle Tribolium castaneum. Insect Mol Biol. 2003;12:433–440. doi: 10.1046/j.1365-2583.2003.00427.x. [DOI] [PubMed] [Google Scholar]
- Lorenzen MD, Brown SJ, Denell RE, Beeman RW. Transgene expression from the Tribolium castaneum Polyubiquitin promoter. Insect Mol Biol. 2002;11:399–407. doi: 10.1046/j.1365-2583.2002.00349.x. [DOI] [PubMed] [Google Scholar]
- Lorenzen MD, Doyungan Z, Savard J, Snow K, Crumly LR, Shippy TD, Stuart JJ, Brown SJ, Beeman RW. Genetic linkage maps of the red flour beetle, Tribolium castaneum, based on bacterial artificial chromosomes and expressed sequence tags. Genetics. 2005;170:741–747. doi: 10.1534/genetics.104.032227. [DOI] [PMC free article] [PubMed] [Google Scholar]
- Lorenzen MD, Kimzey T, Shippy TD, Brown SJ, Denell RE, Beeman RW. PiggyBac-based insertional mutagenesis in Tribolium castaneum using donor/helper hybrids. Insect Mol Biol. 2007 doi: 10.1111/j.1365-2583.2007.00727.x. OnlineEarly. [DOI] [PubMed] [Google Scholar]
- Tomoyasu Y, Denell RE. Larval RNAi in Tribolium (Coleoptera) for analyzing adult development. Dev Genes Evol. 2004;214:575–578. doi: 10.1007/s00427-004-0434-0. [DOI] [PubMed] [Google Scholar]
- Tribolium Genome Consortium. The first genome sequence of a beetle, Tribolium castaneum, a model for insect development and pest biology. Nature. 2007 Submitted. [Google Scholar]


