

Abstract
The purpose of this study was to obtain normative data using magnetic resonance elastography (MRE) to: [a] obtain estimates of the shear modulus of human cerebral tissue in vivo, and [b] assess a possible age dependence of the shear modulus of cerebral tissue in healthy adult volunteers. MR elastography studies were performed on tissue-simulating gelatin phantoms and 25 healthy adult volunteers. The data were analyzed using spatio-temporal filters and a local frequency estimating algorithm. Statistical analysis was performed using a paired t-test. The mean shear stiffness of cerebral white matter was 13.6 kPa (95% CI 12.3 to 14.8 kPa); while that of gray matter was lower at 5.22 kPa (95% CI 4.76 to 5.66 kPa). The difference was statistically significant (p < 0.0001).
Keywords: Magnetic resonance elastography, shear stiffness, elasticity, mechanical properties, tissue characterization, brain
INTRODUCTION
While many diagnostic imaging techniques have emerged over the last few decades, palpation remains a useful technique to localize lesions on the basis of their differential stiffness compared to surrounding tissues. Abnormal tissues commonly display a shear modulus up to 100 times that of normal tissue (Duck 1990; Sarvazyan et al. 1994). These observations have prompted the development of techniques to quantitatively image the elastic modulus of various normal and abnormal tissues (Bishop et al. 1998; Chenevert et al. 1998; Fowlkes et al. 1995; Lewa et al. 1995; Muthupillai et al. 1995; Ophir et al. 1991; Parker et al. 1990; Parker et al. 1992; Plewes et al. 1995; Van Houten et al. 1999). Conventional imaging modalities such as radiography, computed tomography (CT), ultrasound (US), and magnetic resonance imaging (MRI) are not capable of directly assessing the mechanical properties of tissue.
Magnetic resonance elastography (MRE) is a noninvasive technique that allows for the determination of the shear modulus (elastic modulus, shear stiffness) of tissues in vivo (Ehman et al. 1995; Muthupillai et al. 1996a; Muthupillai et al. 1995; Muthupillai et al. 1996b). This technique requires the application of shear waves to tissue (with frequencies in the acoustic range), a phase-sensitive MR imaging sequence to detect the propagating waves, and an algorithm to generate an elastic modulus map of the tissue of interest (Manduca et al. 2001).
While there is no clinical precedent for “brain palpation”, measurements of brain elastic properties may have useful applications for characterizing brain disease. For example, some diffuse diseases of the brain are poorly evaluated by conventional imaging techniques. Processes such as Alzheimer’s disease slowly replace normal brain tissue with senile plaques and neurofibrillary tangles. It is possible that such diffuse infiltration may affect the mechanical properties of cerebral tissue. It has also been hypothesized that certain diseases, such as normal pressure hydrocephalus, may be caused by changes in the mechanical properties of the brain (Bradley et al. 1991). It is also possible that quantitative imaging of the mechanical properties of tissue may be useful in the characterization of focal brain lesions. Valid quantitative measurements of the elastic modulus of cerebral tissue are also of interest in biomechanical studies of brain trauma and in the development of neurosurgery simulation techniques (Kleiven et al. 2002; Miga et al. 2000; Miller 1999; Roberts et al. 1999; Zhang et al. 2001). To date, the available estimates of the shear modulus of brain tissue in the literature are inconsistent (Figure 1).
Figure 1.
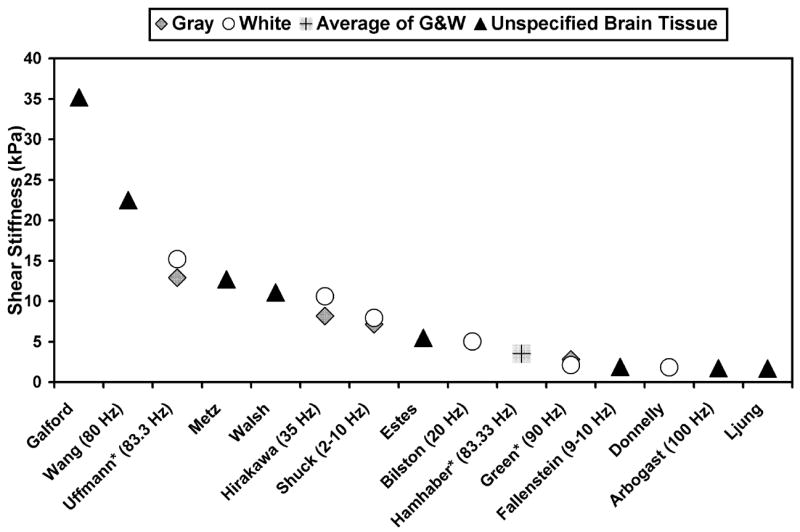
Shear stiffness measurements in the literature of mammalian brain tissue (Arbogast et al. 1998; Bilston et al. 1997; Donnelly et al. 1997; Estes et al. 1970; Fallenstein et al. 1969; Galford et al. 1970; Green et al. 2006; Hamhaber et al. 2007; Hirakawa et al. 1981; Ljung 1975; Metz et al. 1970; Shuck et al. 1972; Uffmann et al. 2004; Walsh et al. 1976; Wang et al. 1972). The studies were performed in vitro, ex vivo and in vivo (denoted by *) using a variety of experimental techniques (shear/strain, load cell, pressure transducer, vibrating probe and MR elastography). The frequency of dynamic testing is indicated. The shear wave speed was calculated from the real and imaginary parts of the complex modulus (Auld 1990; Oliphant et al. 2001). The result was then entered into Equation [2] to calculate shear stiffness.
The purpose of this study was to develop techniques for and to evaluate the feasibility of magnetic resonance elastography of the brain in vivo. The specific goals were: [a] to obtain estimates of the shear modulus of human cerebral tissue, and [b] to assess the age dependence of the shear modulus in healthy volunteers.
MATERIALS & METHODS
Magnetic Resonance Elastography Theory
The MR elastography technique has been described in numerous publications to date (Manduca et al. 2001; Muthupillai et al. 1996a; Muthupillai et al. 1995; Muthupillai et al. 1996b). Therefore, the image acquisition and processing will only be summarized here. MR elastography has three essential components. They are [a] an acoustic acutator which is coupled to the tissue of interest to induce shear wave motion, [b] a pulse sequence using phase-locked cyclic motion-sensitizing gradients to encode the motion as phase in the MR images, and [c] an inversion algorithm that uses the measured displacements to calculate the shear modulus distribution in the tissue.
The phase shift induced in the received NMR signal by cyclic motion at the location r caused by a mechanical wave propagating within a medium at a given frequency, in the presence of a cyclic motion-encoding gradient at the same frequency, is given by the following expression:
| [1] |
The accumulated phase shift ϕ is proportional to the dot product of the gradient vector G0 and the displacement vector ξ⃗0 , the number of gradient cycles (N), and the period of the gradient waveform (T). The quantity θ is the phase relationship between the motion-encoding gradient and the motion at r due to the externally applied mechanical excitation, k⃗ is the shear wave vector, r⃗ is the position vector, and γ is the gyromagnetic ratio. The dot product relationship indicates that displacements occurring along any direction can be measured by changing the direction of the applied gradients. As with other phase-contrast-based techniques, two measurements are acquired with alternate polarities of the motion-encoding gradients. The phase images from each acquisition are then subtracted to yield a phase difference image that reflects the phase shift caused by the propagating mechanical wave. By accumulating phase during several wave cycles, the technique can depict cyclic motions with amplitudes less than 100 nanometers (Muthupillai et al. 1995).
Acoustic Actuator
The method for imaging propagating mechanical waves in the brain has been previously described (Figure 2) (Felmlee et al. 1997; Moore et al. 2003; Rose et al. 1998; Smith et al. 1997; Xu et al. 2007). In one actuator design, the subject would lie supine with his/her head on a cradle attached to an electromechanical acutator with a restraining band across the forehead to ensure coupling of the vibration (Kruse et al. 1999). The electromechanical acutator vibrated the head in the anterio-posterior direction. The actuator coils were inside the imaging coil and in some cases caused artifacts in the posterior of the head. In later cases, a thermoplastic “bite block” was fit to each volunteer (Kruse et al. 2003). The bite block was attached to an electromechanical acutator that vibrated the head in the right-left direction. The bite block acutator was more comfortable for the volunteers. In both cases the applied global head vibration generated low-amplitude shear waves that originated at meningeal surfaces. This is thought to be due to an inertial effect, with coupling between the skull and brain (across the arachnoid space) by the trabeculae of the pia mater.
Figure 2.

Schematic diagram of the magnetic resonance elastography system. Conventional MR imaging gradients and RF pulses that encode spatial positions are shown at the bottom left. The electromechanical actuator (a) applies vertical displacement to the object to be imaged via a cradle or (b) horizontal displacement via a bite block (right). The cyclic motion-sensitizing gradients and the actuator are synchronized using trigger pulses provided by the imager. The phase offset (θ) between the two can be varied to image the waves at various stages of propagation. As shown by the shaded regions, the motion-sensitizing gradients can be superimposed along any desired axis to detect that component of the cyclic motion vector. All data was collected and analyzed using 100 Hz motion.
MRE Acquisition
All MR data acquisitions were performed on a 1.5T GE Signa System (General Electric, Milwaukee, WI) using a modified gradient-echo (GRE) pulse sequence. In addition to the standard imaging gradients, the MRI sequence incorporated oscillating motion-sensitizing gradients that were synchronized with the acoustic shear waves. The MRE scanning parameters included the following: a pulse repetition time (TR) of 100–200 ms, an echo time (TE) of 40–50 ms, a flip angle of 40°, an acquisition matrix of 256 x 64, a slice thickness of 5 mm, a field of view (FOV) of 20–24 cm, and one pair of interleaved toggling motion-encoding gradients acquired for each phase encoding view, resulting in an acquisition time of 13–26 sec. In each volunteer study, this sequence was repeated 8 times with incremental values of θ (the phase lag between the motion-encoding waveform and the applied mechanical waves) from 0 to 2π in order to provide wave images at multiple points over one cycle of the motion.
Summary of Inversion Processing
The mechanical property called the shear modulus (μ) describes the proportionality relationship between transverse stress and strain in a simple isotropic linear elastic material. The speed of propagation (υ) of planar shear waves in simple isotropic Hookean materials is related to the density (ρ) and the shear modulus by the following relationship (Graff 1991):
| [2] |
The propagation speed of shear waves can be calculated from the wavelength (λ) and the frequency of the externally applied mechanical excitation (f) as follows:
| [3] |
Hence, if the local wavelength is measured in an image of propagating shear waves, the shear modulus can be estimated using equations [2] and [3] . A further simplification is that a good approximation for the density of most soft tissues is that of water (ρ = 1 g-cm−3) (Burlew et al. 1980). Technically, the shear modulus of a material refers to a static stress, and in attenuating materials the quantity calculated above can vary with frequency (Auld 1990). We therefore use the term shear stiffness to indicate the “effective” shear modulus of an object at a specific frequency.
In complex wave fields, with reflections, interference, etc., the wave field (under certain assumptions) may still be regarded as the superposition of waves with different amplitudes propagating in different directions, but sharing the same underlying wavelength. The local wavelength at each point in the image is calculated with a local spatial frequency estimation algorithm (denoted LFE) that estimates this underlying wavelength (Knutsson et al. 1994). More details of the algorithm and the underlying assumptions are given in Manduca et al 1996, 2001 (Manduca et al. 1996; Manduca et al. 2001).
Each set of wave images was processed using a set of spatio-temporal filters to decompose the complex wave fields into components propagating in different directions (Manduca et al. 2003). The LFE algorithm was applied to each directionally filtered dataset to extract the local wavelength and compute quantitative shear stiffness maps (Manduca et al. 2001). The maps based on individual propagation directions were recombined using an amplitude squared weighting based on the amplitude of the filtered wave motion. T2-weighted images were used to select regions of interest (ROI) in the gray matter and white matter. The phase difference SNR (the ratio between the amplitude of the displacement phase data to the phase noise) was verified to be greater than 5:1 in each region of interest. The shear modulus maps were then analyzed by calculating the mean and standard deviation of four regions of interest, consisting of 100–200 pixels. The regions were chosen by one of the authors for all of the analysis. The exact locations for each volunteer were chosen following inspection of the T2-weighted images for large homogeneous regions of gray white and white matter. This was done to minimize partial volume and boundary effects in the ROIs. Because of intrinsic assumptions, such as local tissue homogeneity, tissue boundaries are not expected to be resolved correctly. Therefore, the regions-of-interest were selected away from tissue interfaces.
Tissue-Simulating Phantom
A tissue-simulating phantom was created to demonstrate the brain MRE imaging and reconstruction protocol using a very basic model of the vibration of the head. The geometry was chosen to provide a simple axial skull model with waves propagating from the edge to the center. The gelatin concentrations were chosen to approximate the shear stiffness values of brain tissue. The phantom consisted of a 9.5-cm diameter cylinder of 19% bovine gelatin surrounded by 10% bovine gelatin within a 20-cm diameter rigid cylinder. Axial imaging planes were acquired and 1-L reference phantoms were made from the same batches of gel used to construct the phantom for separate testing to verify the inversion results. All phantoms were scanned at a mechanical excitation frequency of 100 Hz. This was done to match the frequency used in the human study.
Human Studies
Cerebral elastography studies were performed in 25 healthy adult volunteers. All MRE examinations were performed with IRB approval and informed consent. The volunteers ranged in age from 23 to 79 years, with a mean age of 42.4 years. An operating frequency of 100 Hz was chosen as a compromise between wave penetration depth and the spatial resolution of the inversion algorithms. This level of vibration falls well below the conservative European Union whole body vibration standard (Ehman et al. 2007) designed to limit chronic occupational vibration exposure. Our IRB approved this guideline as one that would pose non-significant risk to our volunteers. MRE phase difference images were acquired after obtaining T2-weighted images to ensure proper slice selection and to provide an anatomical comparison map.
RESULTS
Tissue-Simulating Phantom
MR elastographic imaging of the gelatin phantom at an actuator frequency of 100 Hz demonstrated a systematic change in the wavelength reflecting the underlying shear stiffness difference between the center and the surrounding gelatin of the phantom (Figure 3). The mean shear stiffness for the inclusion was 13.5 + 0.6 kPa and the shear stiffness of the reference gel was 14.2 + 0.1 kPa. The background gel had a lower shear stiffness of 3.38 + 0.07 kPa; the corresponding reference gel was 3.28 + 0.06 kPa.
Figure 3.

(a) Image depicting shear waves propagating in the tissue-simulating gel phantom. Shear waves at 100 Hz were applied to the gel cylinder using the actuator in Figure 2a. This image is one of eight that were acquired, each providing a quantitative depiction of the deformation of the medium caused by the propagating waves at a different time point in the wave cycle. The circular cross section of the stiff inclusion can be identified in the image because the wavelength of the propagating shear waves is longer in the stiffer material. (b) A GRE image indicates the location of the stiff inclusion. (c) The elastogram obtained from the wave data in (a) using the spatio-temporal directional filters and the LFE algorithm.
Human Studies
Studying the data from the in vivo human studies, shear waves originated from the surface of the brain at the dural attachments and the falx (Figure 4b). The wave fronts approach the gray/white matter junction in a parallel fashion. The figure also shows that as the waves propagate toward the center of the brain, the waves rapidly attenuate. The wavelength of the traveling shear wave increases as it proceeds inward, which indicates that it is traveling through increasingly stiffer media.
Figure 4.
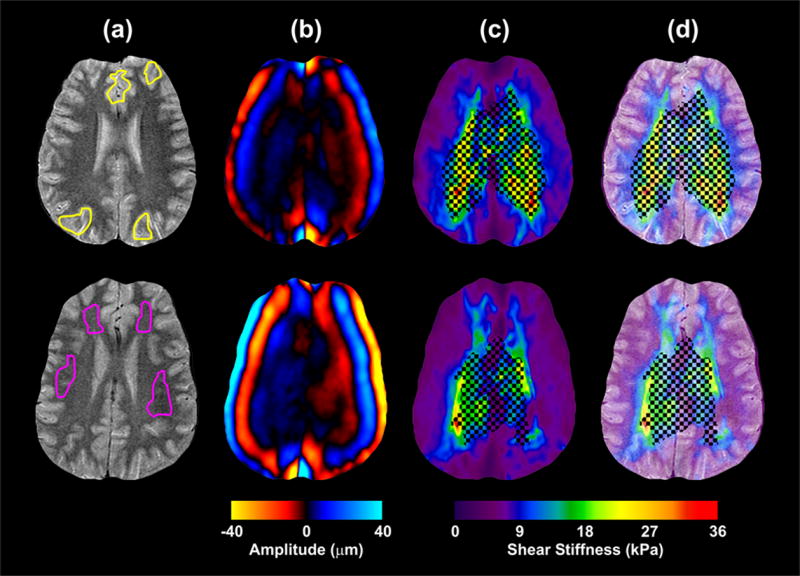
Results from the MRE experiment performed on 2 different volunteers aged 25 and 23 using 100-Hz mechanical excitations. (a) T2-weighted FSE images for anatomical reference. The ROIs for gray matter and white matter are indicated in the top and bottom rows respectively. (b) Images indicating the shear waves propagating in the brain. The shear waves propagate from the perimeter of the brain inward. (c) The shear stiffness maps computed from the Local Frequency Estimate (LFE) algorithm. A threshold, based on a phase difference SNR of 5:1, was applied to the shear stiffness estimates to mask regions with low displacement amplitude. (d) The shear stiffness maps overlaid on the anatomical reference illustrate the correlation of stiffness changes to anatomy.
Quantitative shear stiffness maps were computed from the wave image data sets. Figure 4 shows two typical shear stiffness maps (from two different volunteers) with their corresponding T2-weighted images. Due to attenuation, the SNR in the central regions is too low for accurate inversions (as indicated by the crosshatch pattern in the elastograms). However, the SNR is suitable in the gray matter and partway into the white matter, and an increase in shear stiffness is clearly seen at the transition from gray matter to white matter.
Figure 5 shows shear stiffness measurements obtained from the volunteers (n = 25). The mean shear stiffness of cerebral white matter was 13.6 kPa (95% CI 12.3 to 14.8 kPa), while the elasticity of gray matter was lower at 5.22 kPa (95% CI 4.76 to 5.66 kPa). The difference was statistically significant (p < 0.0001). No apparent age trend was observed in the stiffness of the gray or white matter.
Figure 5.
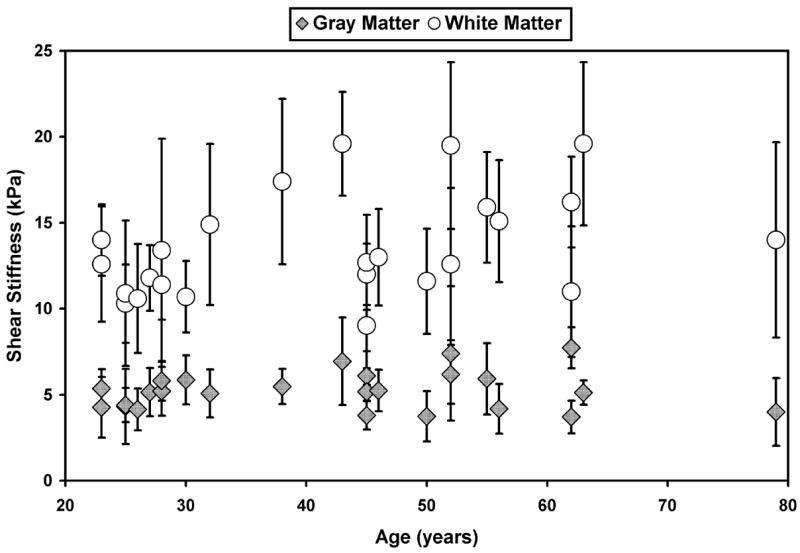
Shear stiffness measurements for the age study volunteers obtained at 100 Hz.
DISCUSSION
This study shows that quantitative measurements of the shear stiffness of intracranial tissues are feasible with MRE. The results indicate that cerebral white matter is significantly stiffer than gray matter in vivo. Even with the limitations and assumptions of the LFE algorithm the values of the shear stiffness appear to correlate well with the visualized anatomy of the brain (Figure 4). To date there is no definitive method for confirming estimates of brain stiffness in vivo. In fact, most estimates of brain elasticity in the literature (Figure 1) were obtained ex vivo, from specimens without blood pressure and metabolic activity. This may explain why these estimates span an order of magnitude, and why there is not even consensus on whether gray matter is softer or stiffer than white matter (e.g., Nagashima et al assumed gray matter to be stiffer than white matter for a finite element simulation of brain edema (Nagashima et al. 1990) and Green et al found gray matter to be stiffer than white matter with MRE (Green et al. 2006)). While no age-dependent trend in brain tissue stiffness was observed in this study, the current cohort of volunteers was not large enough to statistically determine age-dependent changes in the gray matter and white matter stiffness. If there are very small changes in stiffness with age, the sensitivity of our current technique may not allow for that assessment.
This dynamic MRE technique has advantages over other previously described imaging techniques for measuring tissue stiffness in vivo. For example, static and quasi-static MRE (Plewes et al. 2000) techniques require compression of the tissue through hundreds of microns for tens or hundreds of milliseconds, which is not practical to do non-invasively. Ultrasound elasticity (Cespedes et al. 1993; Ophir et al. 1991) imaging of the in vivo brain would be extremely difficult due to the lack of an acoustic window through the skull.
Developments in the acquisition and reconstruction of MRE data may provide a better understanding of the underlying mechanical properties of tissue. Multi-slice, multi-echo techniques like fast spin-echo (FSE) (Grimm et al. 2001; Rydberg et al. 2001) and echo planar imaging (EPI) (Braun et al. 2002) sequences can image a larger volume of the brain in the same amount of time as the current GRE implementation. Impulse displacements and transient MRE can also be used to determine the mechanical properties of the brain by tracking a single wave front across the entire brain (McCracken et al. 2003; McCracken et al. 2001).
Two-dimensional (2D) images were obtained in this study so that acquisition times could be limited to 3 minutes. It has been shown that 2D MRE is a good approximation of the three-dimensional (3D) wave propagation in the brain (Kruse et al. 2003). However, true 3D imaging would better account for the geometrically complex nature of the wave propagation, including boundary effects and guided wave propagation. This approach would also allow for studies of the possible anisotropic properties of white matter tracts. Green et al and Hamhaber et al used 3D inversions for the data reported in Figure 1 (Green et al. 2006; Green et al. 2005; Hamhaber et al. 2007). This may explain the lower shear stiffness values for gray matter, white matter and average brain tissue. MRE data could also be obtained at several shear wave frequencies for each volunteer. From such data, frequency-dependent viscous properties of cerebral tissue can be studied (Kruse et al. 2000). These results show promise for the in vivo assessment of the mechanical properties of cerebral tissue and merit further exploration. It currently is not known exactly how much, if at all, the stiffness of brain tissue changes during certain disease processes (e.g., Alzheimer’s disease). Therefore it is too early to claim limits in the detection ability of MRE. Further improvements in the data acquisition and processing techniques will improve the precision of brain MRE and may allow for improved distinction between normal and pathologic tissue.
Footnotes
Publisher's Disclaimer: This is a PDF file of an unedited manuscript that has been accepted for publication. As a service to our customers we are providing this early version of the manuscript. The manuscript will undergo copyediting, typesetting, and review of the resulting proof before it is published in its final citable form. Please note that during the production process errors may be discovered which could affect the content, and all legal disclaimers that apply to the journal pertain.
References
- Arbogast KB, Margulies SS. Material characterization of the brainstem from oscillatory shear tests. J Biomech. 1998;31(9):801–807. doi: 10.1016/s0021-9290(98)00068-2. [DOI] [PubMed] [Google Scholar]
- Auld BA. Acoustic fields and waves in solids. Krieger Publishing Company; 1990. pp. 21–38. [Google Scholar]
- Bilston LE, Liu ZZ, Nhan PT. Linear viscoelastic properties of bovine brain tissue in shear. Biorheology. 1997;34(6):377–385. doi: 10.1016/s0006-355x(98)00022-5. [DOI] [PubMed] [Google Scholar]
- Bishop J, Poole G, Leitch M, Plewes DB. Magnetic resonance imaging of shear wave propagation in excised tissue. J Magn Reson Imaging. 1998;8(6):1257–1265. doi: 10.1002/jmri.1880080613. [DOI] [PubMed] [Google Scholar]
- Bradley WG, Whittemore AR, Watanabe AS, Davis SJ, Teresi LM, Homyak M. Association of deep white matter infarction with chronic communicating hydrocephalus: implications regarding the possible origin of normal pressure hydrocephalus. AJNR Am J Neuroradiol. 1991;12:31–39. [PMC free article] [PubMed] [Google Scholar]
- Braun J, Bernarding J, Tolxdorff T, Sack I. In vivo magnetic resonance elastography of the human brain using ultrafast acquisition techniques. International Society for Magnetic Resonance in Medicine; 2002 May 18–24; Honolulu, Hawaii, USA. p. 2597. [Google Scholar]
- Burlew MM, Madsen EL, Zagzebski JA, Banjavic RA, Sum SW. A new ultrasound tissue-equivalent material. Radiology. 1980;134(2):517–520. doi: 10.1148/radiology.134.2.7352242. [DOI] [PubMed] [Google Scholar]
- Cespedes I, Ophir J, Ponnekanti H, Maklad N. Elastography: elasticity imaging using ultrasound with application to muscle and breast in vivo. Ultrason Imaging. 1993;15:73–88. doi: 10.1177/016173469301500201. [DOI] [PubMed] [Google Scholar]
- Chenevert TL, Skovoroda AR, O'Donnell M, Emelianov SY. Elasticity reconstructive imaging by means of stimulated echo MRI. Magn Reson Med. 1998;39(3):482–490. doi: 10.1002/mrm.1910390319. [DOI] [PubMed] [Google Scholar]
- Donnelly BR, Medige J. Shear properties of human brain tissue. J Biomech Eng. 1997;119(4):423–432. doi: 10.1115/1.2798289. [DOI] [PubMed] [Google Scholar]
- Duck FA. Physical properties of tissue - A comprehensive reference book. San Diego, CA: Academic Press; 1990. pp. 225–248. [Google Scholar]
- Ehman E, Rossman P, Kruse S. Vibration safety limits for magnetic resonance elastography. International Society for Magnetic Resonance in Medicine; 2007 May 19–25; Berlin, Germany. p. 1257. [DOI] [PMC free article] [PubMed] [Google Scholar]
- Ehman RL, Muthupillai R, Lomas DJ, Rossman PJ, Greenleaf JF, Manduca A. Magnetoelastography - MR-imaging of acoustic strain waves. Radiology. 1995;197:355. [Google Scholar]
- Estes MS, McElhaney JH. American Society of Mechanical Engineers. 1970. Response of brain tissue of compressive loading. Paper No. 70-BHF-13. [Google Scholar]
- Fallenstein GT, Hulce VD, Melvin JW. Dynamic mechanical properties of human brain tissue. J Biomech. 1969;2:217–226. doi: 10.1016/0021-9290(69)90079-7. [DOI] [PubMed] [Google Scholar]
- Felmlee JP, Rossman PJ, Muthupillai R, Manduca A, Dutt V, Ehman RL. Magnetic resonance elastography of the brain: preliminary in vivo results. International Society for Magnetic Resonance in Medicine; 1997 April 12–18; Vancouver, B.C., Canada. p. 683. [Google Scholar]
- Fowlkes JB, Emelianov SY, Pipe JG, Skovoroda AR, Carson PL, Adler RS, Sarvazyan AP. Magnetic resonance imaging techniques for detection of elasticity variation. Med Phys. 1995;22(11 Pt 1):1771–1778. doi: 10.1118/1.597633. [DOI] [PubMed] [Google Scholar]
- Galford JE, McElhaney JH. A viscoelastic study of scalp, brain, and dura. J Biomech. 1970;3(2):211–221. doi: 10.1016/0021-9290(70)90007-2. [DOI] [PubMed] [Google Scholar]
- Graff KF. Wave Motion in Elastic Solids. New York: Dover; 1991. pp. 278–281. [Google Scholar]
- Green M, Sinkus R, Bilston LE. High resolution 3D brain MR-elastography. International Society for Magnetic Resonance in Medicine; 2006 May 6–12; Seattle, Washington, USA. p. 2021. [Google Scholar]
- Green M, Sinkus R, Cheng S, Bilston L. 3D MR-elastography of the brain at 3tesla. International Society for Magnetic Resonance in Medicine; 2005 May 7–13; Honolulu, Hawaii, USA. p. 2176. [Google Scholar]
- Grimm R, Rydberg J, Ehman R. Phase difference encoding of coherent pathways for high speed MR elastography. International Society for Magnetic Resonance in Medicine; 2001 April 21–27; Glasgow, Scotland. p. 1636. [Google Scholar]
- Hamhaber U, Sack I, Papazoglou S, Rump J, Braun J. Three-dimensional analysis of shear wave propagation observed by in vivo magnetic resonance elastography of the brain. Acta Biomater. 2007;3:127–137. doi: 10.1016/j.actbio.2006.08.007. [DOI] [PubMed] [Google Scholar]
- Hirakawa K, Hashizume K, Hayashi T. Viscoelastic property of human brain - for the analysis of impact injury (author's translation) No To Shinkei. 1981;33(10):1057–1065. [PubMed] [Google Scholar]
- Kleiven S, Hardy WN. Correlation of an FE model of the human head with local brain motion - consequences for injury prediction. Stapp Car Crash Journal. 2002;46:123–144. doi: 10.4271/2002-22-0007. [DOI] [PubMed] [Google Scholar]
- Knutsson H, Westin C-F, Granlund G. Local multiscale frequency and bandwidth estimation. Los Alamitos, CA: IEEE Computer Society; 1994. pp. 36–40. [Google Scholar]
- Kruse SA, Dresner MA, Rossman P, Felmlee JP, Jack CR, Ehman RL. "Palpation of the brain" using magnetic resonance elastography. International Society for Magnetic Resonance in Medicine; 1999 May 22–28; Philadelphia, Pennsylvania, USA. p. 258. [Google Scholar]
- Kruse SA, Ehman RL. 2D approximation of 3D wave propagation in MR elastography of the brain. International Society for Magnetic Resonance in Medicine; 2003 July 10–16; Toronto, Ontario, Canada. p. 1084. [Google Scholar]
- Kruse SA, Smith JA, Lawrence AJ, Dresner MA, Manduca A, Greenleaf JF, Ehman RL. Tissue characterization using magnetic resonance elastography: preliminary results. Phys Med Biol. 2000;45:1579–1590. doi: 10.1088/0031-9155/45/6/313. [DOI] [PubMed] [Google Scholar]
- Lewa CJ, de Certaines JD. MR imaging of viscoelastic properties. J Magn Reson Imaging. 1995;5(2):242–244. doi: 10.1002/jmri.1880050221. [DOI] [PubMed] [Google Scholar]
- Ljung C. A model for brain deformation due to rotation of the skull. J Biomech. 1975;8(5):263–274. doi: 10.1016/0021-9290(75)90078-0. [DOI] [PubMed] [Google Scholar]
- Manduca A, Lake DS, Kruse SA, Ehman RL. Spatio-temporal directional filtering for improved inversion of MR elastography images. Med Image Anal. 2003;7:465–473. doi: 10.1016/s1361-8415(03)00038-0. [DOI] [PubMed] [Google Scholar]
- Manduca A, Muthupillai R, Rossman PJ, Greenleaf JF, Ehman RL. Image processing for magnetic resonance elastography. In: Loew MH, Hanson KM, editors. SPIE Proceedings Series. Newport Beach, California, USA: SPIE - The International Society for Optical Engineering; 1996. pp. 616–623. [Google Scholar]
- Manduca A, Oliphant TE, Dresner MA, Mahowald JL, Kruse SA, Amromin E, Felmlee JP, Greenleaf JF, Ehman RL. Magnetic resonance elastography: Non-invasive mapping of tissue elasticity. Med Image Anal. 2001;5:237–254. doi: 10.1016/s1361-8415(00)00039-6. [DOI] [PubMed] [Google Scholar]
- McCracken PJ, Manduca A, Ehman RL. MR elastography for studying the biomechanics of traumatic brain injury. International Society for Magnetic Resonance in Medicine; 2003 July 10–16; Toronto, Ontario, Canada. p. 799. [Google Scholar]
- McCracken PJ, Manduca A, Felmlee JP, Ehman RL. Mechanical transient-based method for MR elastography. Radiology. 2001;221P:329. [Google Scholar]
- Metz H, McElhaney J, Ommaya AK. A comparison of the elasticity of live, dead, and fixed brain tissue. J Biomech. 1970;3(4):453–458. doi: 10.1016/0021-9290(70)90017-5. [DOI] [PubMed] [Google Scholar]
- Miga MI, Paulsen KD. In vivo quantification of a homogeneous brain deformation model for updating preoperative images during surgery. IEEE Trans Biomed Eng. 2000;47(2):266–273. doi: 10.1109/10.821778. [DOI] [PubMed] [Google Scholar]
- Miller K. Constitutive model of brain tissue suitable for finite analysis of surgical procedures. J Biomech. 1999;32:531–537. doi: 10.1016/s0021-9290(99)00010-x. [DOI] [PubMed] [Google Scholar]
- Moore D, Pursley R, Dimitriadis E, Talagala S. Magnetic resonance imaging of brain transverse acoustic waves. International Society for Magnetic Resonance in Medicine; 2003 July 10–16; Toronto, Ontario, Canada. p. 2298. [Google Scholar]
- Muthupillai R, Ehman RL. Magnetic resonance elastography. Nat Med. 1996a;2(5):601–603. doi: 10.1038/nm0596-601. [DOI] [PubMed] [Google Scholar]
- Muthupillai R, Lomas DJ, Rossman PJ, Greenleaf JF, Manduca A, Ehman RL. Magnetic resonance elastography by direct visualization of propagating acoustic strain waves. Science. 1995;269(5232):1854–1857. doi: 10.1126/science.7569924. [DOI] [PubMed] [Google Scholar]
- Muthupillai R, Rossman PJ, Lomas DJ, Greenleaf JF, Riederer SJ, Ehman RL. Magnetic resonance imaging of transverse acoustic strain waves. Magn Reson Med. 1996b;36(2):266–274. doi: 10.1002/mrm.1910360214. [DOI] [PubMed] [Google Scholar]
- Nagashima T, Shirakuni T, Rapoport SI. A two-dimensional, finite element analysis of vasogenic brain edema. Neurol Med Chir (Tokyo) 1990;30(1):1–9. doi: 10.2176/nmc.30.1. [DOI] [PubMed] [Google Scholar]
- Oliphant TE, Manduca A, Ehman RL, Greenleaf JF. Complex-valued stiffness reconstruction for magnetic resonance elastography by algebraic inversion of the differential equation. Mag Reson Med. 2001;45:299–310. doi: 10.1002/1522-2594(200102)45:2<299::aid-mrm1039>3.0.co;2-o. [DOI] [PubMed] [Google Scholar]
- Ophir J, Cespedes I, Ponnekanti H, Yazdi Y, Li X. Elastography: a quantitative method for imaging the elasticity of biological tissues. Ultrason Imaging. 1991;13(2):111–134. doi: 10.1177/016173469101300201. [DOI] [PubMed] [Google Scholar]
- Parker KJ, Huang SR, Musulin RA, Lerner RM. Tissue response to mechanical vibrations for "sonoelasticity imaging". Ultrasound Med Biol. 1990;16(3):241–246. doi: 10.1016/0301-5629(90)90003-u. [DOI] [PubMed] [Google Scholar]
- Parker KJ, Lerner RM. Sonoelasticity of organs: shear waves ring a bell. J Ultrasound Med. 1992;11(8):387–392. doi: 10.7863/jum.1992.11.8.387. [DOI] [PubMed] [Google Scholar]
- Plewes DB, Betty I, Urchuk SN, Soutar I. Visualizing tissue compliance with MR imaging. J Magn Reson Imaging. 1995;5(6):733–738. doi: 10.1002/jmri.1880050620. [DOI] [PubMed] [Google Scholar]
- Plewes DB, Bishop J, Samani A, Sciarretta J. Visualization and quantification of breast cancer biomechanical properties with magnetic resonance elastography. Phys Med Biol. 2000;45:1591–1610. doi: 10.1088/0031-9155/45/6/314. [DOI] [PubMed] [Google Scholar]
- Roberts DW, Miga MI, Hartov A, Eisner S, Lemery JM, Kennedy FE, Paulsen KD. Intraoperatively updated neuroimaging using brain modeling and sparse data. Neurosurgery. 1999;45(5):1199–1206. [PubMed] [Google Scholar]
- Rose GH, Dresner MA, Rossman PJ, Felmlee JP, Muthupillai R, Ehman RL. "Palpation of the brain" using magnetic resonance elastography. Radiology. 1998;209P:1268. [Google Scholar]
- Rydberg J, Grimm R, Kruse S, Felmlee J, McCracken P, Ehman R. Fast spin-echo magnetic resonance elastography of the brain. International Society for Magnetic Resonance in Medicine; 2001 April 21–27; Glasgow, Scotland. p. 1647. [Google Scholar]
- Sarvazyan A, Goukassian D, Maevsky E, Skovoroda A, Emelianov S. Elasticity imaging as a new modality of medical imaging for cancer detection; 1994 5–9 April 1994; Valenciennes, France. pp. 69–81. [Google Scholar]
- Shuck LZ, Advani SH. Rheological response of human brain tissue in shear. J Basic Eng. 1972;94:905–911. [Google Scholar]
- Smith JA, Muthupillai R, Rossman PJ, Hulshizer TC, Greenleaf JF, Ehman RL. Characterization of Biomaterials Using Magnetic Resonance Elastography. In: Thompson DO, Chimenti DE, editors. Review of Progress in Quantitative Nondestructive Evaluation. New York: Plenum Press; 1997. pp. 1323–1330. [Google Scholar]
- Uffmann K, Maderwald S, de Greiff A, Ladd ME. Determination of gray and white matter elasticity with MR elastography. International Society for Magnetic Resonance in Medicine; 2004 May 15–21; Kyoto, Japan. p. 1768. [Google Scholar]
- Van Houten EEW, Miga MI, Weaver JB, Kennedy FE, Paulsen KD. An overlapping subzone technique for MR-based elastic property reconstruction. Magn Reson Med. 1999;42:779–786. doi: 10.1002/(sici)1522-2594(199910)42:4<779::aid-mrm21>3.0.co;2-z. [DOI] [PubMed] [Google Scholar]
- Walsh EK, Schettini A. Elastic behavior of brain tissue in vivo. Am J Physiol. 1976;230(4):1058–1062. doi: 10.1152/ajplegacy.1976.230.4.1058. [DOI] [PubMed] [Google Scholar]
- Wang HC, Wineman AS. A mathematical model for the determination of viscoelastic behavior of brain in vivo. I. Oscillatory response. J Biomech. 1972;5(5):431–446. doi: 10.1016/0021-9290(72)90002-4. [DOI] [PubMed] [Google Scholar]
- Xu L, Lin Y, Xi ZN, Shen H, Gao PY. Magnetic resonance elastography of the human brain: a preliminary study. Acta Radiol. 2007;48(1):112–115. doi: 10.1080/02841850601026401. [DOI] [PubMed] [Google Scholar]
- Zhang L, Yang KH, Dwarampudi R, Omori K, Li T, Chang K, Hardy WN, Khalil TB, King AI. Recent advances in brain injury research: a new human head model development and validation. Stapp Car Crash Journal. 2001;45:369–394. doi: 10.4271/2001-22-0017. [DOI] [PubMed] [Google Scholar]