

Abstract
We have constructed a synthetic ecosystem consisting of two Escherichia coli populations, which communicate bi-directionally through quorum sensing and regulate each other's gene expression and survival via engineered gene circuits. Our synthetic ecosystem resembles canonical predator–prey systems in terms of logic and dynamics. The predator cells kill the prey by inducing expression of a killer protein in the prey, while the prey rescue the predators by eliciting expression of an antidote protein in the predator. Extinction, coexistence and oscillatory dynamics of the predator and prey populations are possible depending on the operating conditions as experimentally validated by long-term culturing of the system in microchemostats. A simple mathematical model is developed to capture these system dynamics. Coherent interplay between experiments and mathematical analysis enables exploration of the dynamics of interacting populations in a predictable manner.
Keywords: microchemostat, microfluidics, quorum sensing, synthetic biology, systems biology
Introduction
Since its recent emergence, synthetic biology has shown great potential for generating practically useful systems while serving as an approach to decoding biological ‘design principles' (Hasty et al, 2002; Sprinzak and Elowitz, 2005; Andrianantoandro et al, 2006; Chang and Keasling, 2006; Chin, 2006; Haseltine and Arnold, 2007). A key challenge in this area is to identify general, scalable strategies that enable construction of increasingly complex gene circuits with reliable performance, as well as to develop novel technological platforms for quantitative circuit characterization (Simpson, 2004; Endy, 2005; Marguet et al, 2007). The predator–prey ecosystem serves as an excellent model for such a challenge. As an essential component of ecological dynamics, natural predator–prey systems have been analyzed extensively by modeling and experiments (May, 1974; Murray, 2002). In comparison with other types of ecological interactions (e.g. mutualism and competition), predation often generates richer dynamics and as such represents a greater challenge to engineer de novo. In this study, we constructed synthetic gene circuits that converted two Escherichia coli populations into a synthetic predator–prey system. Long-term quantification of the system dynamics, which required an improved version (Supplementary Figure S1) of the recently developed microchemostat (Balagadde et al, 2005), validated the designed function. In addition to pushing the limits of programming and characterization of complex cellular dynamics, our system can serve as a model system to address questions arising from its natural counterparts.
Results and discussion
As shown in Box 1A, two E. coli populations (‘predator' and ‘prey') communicate and regulate each other's density through quorum sensing (QS), a mechanism by which many bacteria broadcast and respond to changes in their local population density (Camilli and Bassler, 2006). Two QS modules, LuxI/LuxR from Vibrio fischeri and LasI/LasR from Pseudomonas aeruginosa, are used to enable two-way communication between the predator and prey populations. When the prey density is low, the predator cells die due to constitutive expression of a suicide gene (ccdB). In prey cells an acyl-homoserine lactone (AHL), 3OC6HSL, is synthesized by LuxI. As the prey density increases, 3OC6HSL accumulates in the culture and, at sufficiently high concentrations, it is bound by the transcriptional regulator LuxR in the predator cells leading to increased expression of an antidote gene (ccdA) to rescue the predators. The predator cells in turn produce another AHL, 3OC12HSL by LasI that permeates into the prey cells where it is bound by LasR, which activates expression of the killer ccdB gene, inducing ‘predation.' This system satisfies the broader definition of predation for a two-species ecosystem, where one species (prey) suffers from the growth of the second (predator) and the latter benefits from the growth of the former (Taylor, 1984). However, it differs from the canonical predator–prey system in two aspects. First, instead of acting as a food source, the prey provides an ‘antidote' to programmed death of the predator. Second, there is competition between predator and prey for nutrients in a co-culture, which is generally absent in natural predator–prey systems.
We employed ordinary differential equations to model the major kinetic events during the functioning of this circuit (see Supplementary information and Figure S5 for details). The model predicts extinction, coexistence or oscillatory dynamics (Box 1B) depending on rates of cell growth, cell death controlled by AHL, as well as production and degradation of AHL. According to bifurcation analysis (Box 1B, left panel), the larger the CcdB killing rate constant (dc1), the higher the likelihood of robust oscillatory behavior: increasing dc1 significantly broadens the parameter region that gives rise to oscillation (region bound by the loci of Hopf bifurcation points). Our experiments indicated that the original LacZα-CcdB fusion protein, which was used in our population control circuit (You et al, 2004), might lack the necessary toxicity (data not shown). To overcome this limitation, we constructed a new LacZα′-CcdB protein by deleting 32 amino acids in LacZα, which resulted in an eight-fold increase in potency compared to the full-length protein (Supplementary Figure S2). The LacZα′-CcdB fusion protein is referred to as ‘CcdB' in this paper.
It was previously shown that both active LasR and active LuxR can initiate gene expression at the luxI promoter (PluxI) (Gray et al, 1994) (Supplementary Figure S3). Therefore, we used PluxI to drive both the ccdA gene in the predator cells (regulated by LuxR) and the ccdB gene in the prey cells (regulated by LasR). To expedite rescue of the predator by its survival signal (3OC6HSL), the corresponding QS system was placed under the control of PLtetO-1 promoter (Lutz and Bujard, 1997), which is constitutively active in the MG1655 E. coli strain. This strategy simultaneously accelerates 3OC12HSL synthesis and thus prey killing. To ensure sufficient killing of the predator, we implemented the CcdB induction circuits in a high-copy-number plasmid (p15A origin of replication with a copy number of ∼20 per cell). This synthetic ecosystem is activated by isopropyl-β-D-thiogalactopyranoside (IPTG), which induces ccdB expression in the predator and the QS system in the prey. To optimize protein expression levels and synchronize the timing of the circuit components, we tested many combinations of promoters, origins of replication and bacterial host strains, and narrowed our focus to one configuration (Supplementary Figure S4A). Unless noted otherwise, the predator circuit was implemented in the E. coli strain MG1655, the prey circuit in the strain Top10F′. Finally, a destabilized green fluorescent protein gene (gfpuv-lva) was introduced into the predator (Supplementary Figure S4A) to capture dynamic changes and differentiate the predator from the prey cell populations in mixed cultures.
We verified the basic function of each population independently using IPTG and the corresponding AHL supplied exogenously (Figure 1). In the OFF culture containing neither IPTG nor 3OC6HSL, predator cells grew to a relatively high density in LBK medium (Figure 1A). Growth was significantly inhibited in the ON culture containing 1 mM of IPTG, which fully induced ccdB expression. However, predator cells induced with IPTG were rescued by 3OC6HSL (100 nM), which when bound by LuxR can initiate ccdA expression. Rescued predators (with IPTG and 3OC6HSL) grew slightly slower than those in the OFF condition (Figure 1A), possibly due to the metabolic burden involved in expression of circuit components, incomplete neutralization of CcdB by CcdA, or both. As shown in Figure 1B, prey cells were able to grow in the OFF culture (without inducers) as well as medium containing only IPTG but perished when both IPTG and 3OC12HSL were present. The IPTG-induced prey population grew slower compared to that of the OFF culture. This minor growth retardation could be a result of the metabolic burden of the circuit components, basal level CcdB expression due to crosstalk between 3OC6HSL and LasR, or both.
Figure 1.

Individual growth behaviors (without interactions) of (A) predator and (B) prey cells in liquid media. For each condition, 6 ml LBK medium containing chloramphenicol and kanamycin was inoculated with a single bacterial colony and was divided into three 2 ml cultures: ‘OFF' cultures contained no inducers, ‘+IPTG' cultures contained 1 mM IPTG and ‘+IPTG+AHL' contained 1 mM IPTG and 100 nM AHL, respectively. After 20 h of incubation (light gray bars), optical densities (ODs) of these cultures were measured with a microplate reader (see Supplementary information). Error bars represent standard deviation of triplicate cultures.
This synthetic predator–prey system represents one of the most complicated synthetic circuits reported to date. Long-term characterization of such circuits, which is essential to the verification of the designed dynamics, presents a major technological challenge. Measurement of circuit performance in conventional macroscopic (test tube) cultures hinted at oscillatory dynamics (data not shown). But insufficient temporal resolution due to the arduous and time-consuming process involved in acquiring such data made these observations inconclusive. In addition, the short-lived stability of the circuit in the macro-sized populations (Desai et al, 2007) could only provide a fleeting glimpse of the programmed behavior: function was lost before the circuit behavior could be appreciably observed. To this end, we resorted to a recently developed microchemostat platform (Balagadde et al, 2005); a high-throughput screening technology that can inexpensively perform rapid characterization of synthetic circuits under a matrix of conditions with unprecedented capabilities including long-term, non-invasive measurements of microbial population properties under steady-state conditions with single cell resolution and advanced automation. Equally important, the microchemostat's micro-sized population (∼102–104 cells versus at least ∼109 in macroscale cultures) reduces the number of cell division events per unit time and hence slows down microbial evolution (Desai et al, 2007). This aspect facilitates monitoring of programmed behavior of bacterial populations for hundreds of hours despite strong selection pressure to evade population control (Balagadde et al, 2005).
Furthermore, the challenge of real-time monitoring of community composition was met by an engineering revision to the microchemostat reactor channel to enable single-cell-resolved fluorescence quantification (Supplementary Figure S1). In addition, we reduced reactor volume from ∼16 to ∼9 nl to further reduce the bacterial population size in each reactor, which has been shown to help stabilize a population controller during long-term culturing (Balagadde et al, 2005). This strategy also allowed us to increase the number of parallel reactors per chip from 6–14 for higher throughput.
Figure 2A illustrates the typical oscillatory dynamics of predator and prey populations in the microchemostat with a period of ∼180 h (IPTG=5 μM, dilution rate (D)=0.1125 h−1). Initially, when the prey density was low, predator growth was inhibited due to constitutive expression of CcdB. Conversely, the prey grew to a high density (∼35 000 cells per reactor) in ∼10 h. The high prey density led to rescue of the predator population, which recovered from ∼5000 cells per reactor to >20 000 cells per reactor in ∼10 h. The increased predator density in turn resulted in killing of the prey cells, leading to a drastic reduction in the prey density (from ∼35 000 cells per reactor to just a few cells per reactor). The decrease in the prey density led to insufficient rescue of predator cells and the subsequent decline in predator density at ∼35 h. The prey population recovered ∼10 h later. In summary, the system yielded oscillatory dynamics between the predator and prey populations that clearly resemble those observed in natural predator–prey ecosystems.
Figure 2.

Long-term characterization of system dynamics using the microchemostat. (A) Typical oscillatory dynamics of the system with a period of ∼180 h (IPTG=5 μM, dilution rate=0.1125 h−1). (B) System dynamics for varying IPTG induction levels. The microchemostat dilution rate was 0.1125 h−1. Without induction, prey cells are washed out. At increased IPTG level (IPTG⩾5 μM), oscillatory dynamics were elicited in several reactors. (C) Bifurcation diagram of the predator density versus IPTG level. The inset shows the oscillation period as a function of IPTG. Time courses of the two populations at different IPTG concentrations are illustrated.
The parallel design of microchemostat reactors greatly facilitates the investigation of circuit response to changing circuit parameters. Figure 2B illustrates a typical set of dynamics of the synthetic predator–prey ecosystem for various circuit induction levels. Without induction (IPTG=0), predator and prey had negligible circuit-driven interactions. Since the predator (MG1655 strain) grows faster than the prey (Top10F′ strain), the prey population was eventually (after ∼50 h) driven to extinction (the fluctuations of the prey density around 0 cell per reactor were numerical artifacts of imaging processing; see Supplementary information for details). Higher IPTG levels (⩾5 μM) did elicit oscillatory dynamics between the predator and the prey populations.
These results suggest the crossing of a Hopf bifurcation point using the IPTG level as the control parameter (also see Supplementary Figures S6 and S7A). This aspect is illustrated with bifurcation analysis (Figure 2C) that accounts for the effects of IPTG on 3OC6HSL production by the prey and CcdB expression by the predator. At sufficiently low IPTG levels, there is minimal programmed predation between two populations and the primary interaction is competition. As a result, the predator population dominates due to its growth advantage, leading to the washout of the prey. Increasing IPTG beyond a critical level enables crossing of a Hopf bifurcation point and elicits oscillatory dynamics.
The model further predicts two salient features of the predator behavior at high IPTG induction levels. First, the response dynamics are much slower compared to those at low IPTG induction levels (Figure 2C, inset). Second, these dynamics involve minimal predator densities that are close to zero. Both aspects are qualitatively consistent with experimental data (top panels of Figure 2B; Supplementary Figure S7A), although the data do not exclude the possibility that the system may eventually approach steady state. Because of the miniaturized volume of the microchemostat reactor (∼9 nl), the predator (or prey) population is prone to falling below the detection limit (∼75 cells per reactor) during an oscillation trough (Figure 2B, row 1, columns 1 and 2; from ∼10 to ∼80 h) and in severe cases, getting washed out (Figure 2B, row 1, column 3).
Similarly, we explored the impact of dilution rate (D) on the system dynamics. Figure 3A illustrates coexistence dynamics at D=0.11 h−1, suggestive of an initial phase of long-period oscillations. However, an increase in D (to 0.2 h−1) led to a phase of damped oscillatory dynamics with much shorter periods (∼50 h). We observed similar response with a different circuit configuration: predator (Top10F′) and prey (Top10F′) (Figure 3B; also see Supplementary Figure S4B). These populations initially coexist at a low dilution rate (D=0.15 h−1). They switched to damped oscillations with short periods (∼30 h) upon an increase in D (to 0.23 h−1). Further increase in D (to 0.31 h−1) at ∼250 h led to predator washout. Bifurcation analysis qualitatively accounts for the experimental observations that an increase in the dilution rate can lead to a significant decrease in the period of oscillations (Figure 3C, inset). Simulations further show that an increase in D can shift a slow, sustained oscillation (Figure 3C, bottom left panel) to a fast, damped oscillation (Figure 3C, bottom middle panel). Predator cells will be washed out if D is too large (Figure 3C, bottom right panel).
Figure 3.

Dependence of systems dynamics on dilution rate (D). (A) Experimental dynamics of predator and prey populations at different D in the microchemostat: for the pair of predator (MG1655) and prey (Top10F′). (B) For the pair of predator (Top10F′) and prey (Top10F′). (C) Bifurcation diagram of oscillatory period versus D. The inset is the oscillation period versus D. Qualitatively different systems dynamics (sustained and damped oscillations, and steady state) can be obtained by the variation of D. These experiments were carried out at IPTG=50 μM.
These modeling results qualitatively account for the experimental observations of the dependence of systems dynamics on dilution rate. We note that the system's response to a shift in D is highly sensitive to the prevailing conditions of operation. Upon switching D from 0.11 to 0.2 h−1, the system either exhibits a damped oscillation or approaches a steady state (the third row, Supplementary Figure S7A, where IPTG=50 μM). The sensitivity of the damped oscillation to perturbations of a parameter or initial conditions can qualitatively explain this phenomenon (Supplementary Figure S7C, insets). Since damped oscillations are transient dynamics, small variations in the control of the microchemostat dilution rate or different initial phases of the predator and prey populations can significantly impact the oscillation behavior.
Drawing inspiration from the nature, synthetic biologists have created circuits that operate in single cells (Elowitz and Leibler, 2000; Gardner et al, 2000; Atkinson et al, 2003; Fung et al, 2005; Levskaya et al, 2005), in individual populations (Kobayashi et al, 2004; You et al, 2004; Basu et al, 2005; Anderson et al, 2006) and between populations (Brenner et al, 2007). Our study represents a major advance beyond recent efforts in constructing synthetic ecosystems (Shou et al, 2007; Weber et al, 2007), in terms of system complexity and resolution of characterization. It provides a framework for exploring how naturally existing cellular components can be assembled to program and coordinate highly complex cellular behavior. In addition, synthetic ecosystems such as ours may serve as well-defined systems for exploring evolutionary and ecological questions regarding, for example, the generation and maintenance of biodiversity (Chesson, 2000; Nowak and Sigmund, 2004). Conventionally, typical experiments involving microorganism systems are limited to using nutrient concentration and dilution rate as the sole control parameters (Fussmann et al, 2000; Becks et al, 2005). In comparison, our system allows direct manipulation of intrinsic parameters, such as growth rate, death rate and strength of cell–cell communication. In this system, there is a clear and explicit mapping between the genetic constructs and the corresponding population dynamics, which may facilitate future studies of how molecular interactions are manifested in the temporal patterns of population dynamics, a central theme in ecology (Bohannan and Lenski, 2000; Foster et al, 2007). The generic nature of our system design makes it portable to other ecological interactions, including mutualism, competition, commensalism and amensalism (May, 1974). The virtually unlimited configurations that are possible with these basic elements will allow us to further examine the interplay between the environment, gene regulation and population dynamics. With additional control over population mixing or segregation, it will be possible to program bacterial populations to mimic development and differentiation in multicellular organisms.
Materials and methods
Mircochemostat design and fabrication
Microchemostat chips were fabricated out of silicone elastomer polydimethylsiloxane (General Electric RTV 615) using multi-layer soft lithography as described previously (Balagadde et al, 2005). In this chip version, the number of reactors per chip was increased from 6 to 14. In addition, a relatively thin imaging section 3 μm high (compared to ∼10 μm high otherwise) was incorporated along a 150 μm stretch of the growth loop to constrain the entire fluorescent signal of the cells within a single focal plane (Supplementary Figure S1).
The microchemostat reader
The general assembly of the reader was described previously (Balagadde et al, 2005). The cells in the microchemostat were imaged through bright-field or fluorescence microscopy. Illumination in each case was synchronized to chip operation using two electronic shutters (Uniblitz electronic shutters; AG Heinz Inc., Lake Forest, CA, USA). Fluorescent and phase-contrast digital images were captured using a cooled charge coupled device camera (monochrome Retiga SRV 2000 RV from QImaging Corporation). Labview software was used to control the synchronized operation of these components and all chip operation.
Microscopic cell counting
Within the 3 μm height of the imaging section (compared to the 10 μm height otherwise), imaged cells were constrained into a sufficiently thin horizontal plane so that they could all be in focus simultaneously. This also enhanced the single-cell resolvability by decreasing the cell–cell overlap in the horizontal plane (Supplementary Figure S1).
The total number of cells in each continuous reactor was determined directly through automated bright-field microscopy by counting the number of cells present in a growth chamber section of known volume. Typically, a set of eight phase-contrast images was taken at the imaging section of each reactor via bright-field microscopy, with rotary mixing of the culture in between consecutive snapshots. Image-processing algorithms in Matlab were used to determine the average number of cells in each picture set, from which the total cell count was determined as described previously (Balagadde et al, 2005).
To determine community composition of mixed populations, one of the species (predator or prey) was tagged with a Gfpuv fluorescent label. The fluorescent signal was determined by directly counting the fluorescent cells in a set of typically four images acquired through automated fluorescence microscopy, using the appropriate Gfpuv filter set: excitation 395/40 and emission 510/40. Thus, the non-fluorescent density, obtained by subtracting the fluorescent from the total cell count, represented the density of the second population. According to this approach, members of a ‘fluorescent' species that are not bright enough to be captured by the image-processing algorithms get counted as non-fluorescent species cells. This could be a source of noise in the number of cells reported for each species. In the future, this problem could be addressed by assigning a different fluorescent marker to each species involved in the experiment.
A motorized stage system (Prior Scientific, Rockland, MA, USA) enabled simultaneous documentation of multiple microchemostat experiments that operated in parallel on a single chip.
Plasmids
Plasmids used for this study are shown in Supplementary Figure S4. To construct placCcdBs (p15A origin, KanR), 96 base pairs between two NstI sites in the coding region of LacZα-CcdB (pZErO-2) were deleted, and the resulting gene lacZα′-ccdB, along with its upstream lac promoter, was cloned into pPROLar.A122 (BD Biosciences Clontech). ptetLuxRLasI-luxCcdA (SC101 origin, CmR) was constructed in several steps. First, the lasI gene along with its ribosome-binding site was cloned from the P. aeruginosa (PAO1) chromosome into plasmid pLuxR (Collins et al, 2005), where it was placed downstream of the luxR gene. Second, the luxR-lasI cassette was cloned into plasmid pPROTet.E132 (Clontech) to generate ptetLuxRLasI, where the cassette is under control of a PLtetO-1 promoter (Lutz and Bujard, 1997). Next, the ccdA gene was cloned from the F plasmid, PCR-fused with a PluxI promoter from pluxGFPuv (Collins et al, 2005), and inserted into ptetLuxRLasI, in opposite direction from the PLtetO-1-lasR-lasI cassette. Finally, the ColE1 replication origin of this plasmid was replaced with the SC101 origin, which was cloned from the repressilator plasmid (Elowitz and Leibler, 2000). pLasRLuxI-luxCcdBs (p15A origin, KanR) was also constructed in several steps. First, the lasR gene was cloned from the P. aeruginosa (PAO1) chromosome into pPROLar.A122 (Clontech) placing it under control of the Plac/ara-1 promoter to generate pLasR. Second, the luxI gene was cloned from plasmid pSND-1 (Weiss and Knight, 2000) into pLasR where it was positioned directly downstream of the lasR gene, generating pLasRLuxI. Third, a pluxI-lacZα′-ccdB cassette was cloned from plasmid pluxCcdBs, which was derived from pluxCcdB by removing 96 base pairs between two NstI sites (see above).
Plasmid ptetGFPuv (LVA) (ColE1 origin, CmR) was constructed by inserting an N-terminal portion of GFPuv amplified by PCR with a primer, including a KpnI site upstream of the start codon and a primer annealing to the internal AvaII site, and a C-terminal portion of GFPuv (LVA) amplified by PCR from pINV-4 (Weiss, 2001) with a primer annealing to the internal AvaII site and a primer including BamHI downstream of the LVA tag into KpnI- and BamHI-digested pPROTet.E132 (BD Biosciences Clontech).
Strains, growth conditions and macro-scale data acquisition
MG1655 and Top10F′ E. coli cell strains (Invitrogen) were used unless otherwise noted. For IPTG/AHL response tests in Figure 1, we used 3OC6HSL (Sigma Aldrich) and 3OC12HSL synthesized by E Toone (Department of Chemistry, Duke University), which were prepared and stored as reference (Collins et al, 2005).
PH-buffered LBK media (containing 10 g tryptone, 5 g yeast extract and 7 g KCl l−1) were used for liquid culture. The media were buffered with 100 mM weak acids (PIPES was used for pH 6.2 and 6.6, and MOPS for pH 7.0), and pH was adjusted by adding 5 M KOH. Antibiotics (50 μg ml−1 chloramphenicol and 50 μg ml−1 kanamycin) and anhydrotetracycline were added. IPTG plus 0.05% arabinose (1 mM) was used to activate the circuit. Cultures were shaken in a 12 ml culture tube at 37°C and 250 r.p.m. A starter culture of the predator cells or the prey cells was inoculated from a single colony and grown separately for at least 10 h, and then diluted 1000-fold into 4 ml of fresh medium.
Microchemostat medium, preculture preparation and growth conditions
LBK medium was used in all microchemostat experiments unless otherwise stated. Predator and prey populations were independently tested for circuit function according to the procedure illustrated in Figure 1. Glycerol stock solutions (30 μl) were created using the tested predator and prey cultures and were placed in a −80°C freezer for long-term storage. These mini-stocks were used to prepare pre-cultures for subsequent microchemostat experiments.
Precultures were prepared by inoculating a 2 ml sterile medium sample with 10 μl of previously prepared mini-glycerol stock cell solution and shaking at 280 r.p.m. for ∼9 h at 37°C (VWR bench top incubator, model 1575R). The precultures were then used to seed microchemostat reactors with ∼20 cells nl−1. To measure predator–prey circuit dynamics in the microchemostat, cells were grown in pH 7.0-buffered LBK medium. All microchemostat media were supplemented with 5 g l−1 bovine serum albumin as an anti-adhesion adjuvant. The predator–prey circuit plasmids were maintained with 50 μg ml−1 of kanamycin and 15 μg ml−1 chloramphenicol. All experiments were performed within a microscope plexi-glass incubator to control growth temperature at 37°C.
A synthetic predator-prey ecosystem.
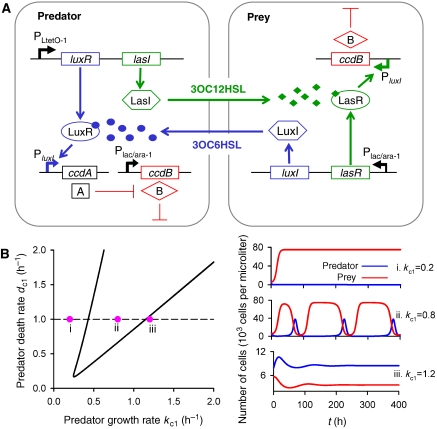
A synthetic predator–prey ecosystem. (A) The system consists of two types of engineered bacteria controlling each other's survival and death via two different QS signals. Outer boxes represent cell walls. Arrows represent activation or production; blunt arrows represent inhibition or killing. CcdB (‘B') is controlled by Plac/ara-1 in the predator and PluxI in the prey. CcdA (‘A') is controlled by PluxI. The lux system is shown in blue and the las system in green. The QS genes in the predator are controlled by PLtetO-1, and those in the prey by Plac/ara-1. Filled circles represent 3OC6HSL and filled diamonds represent 3OC12HSL. The predator–prey interaction is activated by IPTG. See main text and Supplementary information for more details. (B) Bifurcation analysis of the model in terms of the killing constant dc (=dc1 (predator)=dc2 (prey)) and the growth rate kc (=kc1 (predator)=kc2 (prey)) (left panel). The model construction is described in equations S14–S17. A line connecting Hopf bifurcation points demarcates three regions: (i) prey domination, (ii) predator–prey oscillation and (iii) predator domination. Typical population dynamics for specific parameter sets are illustrated for each region (right panel).
Supplementary Material
Supplementary Information
Supplementary XML
Acknowledgments
We thank M Elowitz for the repressilator plasmid; J Leadbetter for P. aeruginosa chromosomal DNA; R Weiss for plasmid pSND-1; RS Cox III, C Ward, P Blais, P Marguet and M Gray for preliminary study and technical assistance; E Toone and X Chen for synthesizing 3OC12HSL. This study was supported by grants from the Defense Advanced Research Projects Agency (FHA), National Institutes of Health (LY and FHA), the David and Lucile Packard Foundation (LY) and the Howard Hughes Medical Institute (SRQ).
References
- Anderson JC, Clarke EJ, Arkin AP, Voigt CA (2006) Environmentally controlled invasion of cancer cells by engineered bacteria. J Mol Biol 355: 619–627 [DOI] [PubMed] [Google Scholar]
- Andrianantoandro E, Basu S, Karig DK, Weiss R (2006) Synthetic biology: new engineering rules for an emerging discipline. Mol Syst Biol 2: 2006.0028 10.1038/msb4100073 [DOI] [PMC free article] [PubMed] [Google Scholar]
- Atkinson MR, Savageau MA, Myers JT, Ninfa AJ (2003) Development of genetic circuitry exhibiting toggle switch or oscillatory behavior in Escherichia coli. Cell 113: 597–607 [DOI] [PubMed] [Google Scholar]
- Balagadde FK, You LC, Hansen CL, Arnold FH, Quake SR (2005) Long-term monitoring of bacteria undergoing programmed population control in a microchemostat. Science 309: 137–140 [DOI] [PubMed] [Google Scholar]
- Basu S, Gerchman Y, Collins CH, Arnold FH, Weiss R (2005) A synthetic multicellular system for programmed pattern formation. Nature 434: 1130–1134 [DOI] [PubMed] [Google Scholar]
- Becks L, Hilker FM, Malchow H, Jurgens K, Arndt H (2005) Experimental demonstration of chaos in a microbial food web. Nature 435: 1226–1229 [DOI] [PubMed] [Google Scholar]
- Bohannan B, Lenski RE (2000) Linking genetic change to community evolution: insights from studies of bacteria and bacteriophage. Ecol Lett 3: 362–377 [Google Scholar]
- Brenner K, Karig DK, Weiss R, Arnold FH (2007) Engineering bidirectional communication mediates a consensus in a microbial biofilm consortium. Proc Natl Acad Sci USA 104: 17300–17304 [DOI] [PMC free article] [PubMed] [Google Scholar]
- Camilli A, Bassler BL (2006) Bacterial small-molecule signaling pathways. Science 311: 1113–1116 [DOI] [PMC free article] [PubMed] [Google Scholar]
- Chang MC, Keasling JD (2006) Production of isoprenoid pharmaceuticals by engineered microbes. Nat Chem Biol 2: 674–681 [DOI] [PubMed] [Google Scholar]
- Chesson P (2000) Mechanisms of maintenance of species diversity. Annu Rev Ecol Syst 31: 343–366 [Google Scholar]
- Chin JW (2006) Modular approaches to expanding the functions of living matter. Nat Chem Biol 2: 304–311 [DOI] [PubMed] [Google Scholar]
- Collins CH, Arnold FH, Leadbetter JR (2005) Directed evolution of Vibrio fischeri LuxR for increased sensitivity to a broad spectrum of acyl-homoserine lactones. Mol Microbiol 55: 712–723 [DOI] [PubMed] [Google Scholar]
- Desai MM, Fisher DS, Murray AW (2007) The speed of evolution and maintenance of variation in asexual populations. Curr Biol 17: 385–394 [DOI] [PMC free article] [PubMed] [Google Scholar]
- Elowitz MB, Leibler S (2000) A synthetic oscillatory network of transcriptional regulators. Nature 403: 335–338 [DOI] [PubMed] [Google Scholar]
- Endy D (2005) Foundations for engineering biology. Nature 438: 449–453 [DOI] [PubMed] [Google Scholar]
- Foster KR, Parkinson K, Thompson CR (2007) What can microbial genetics teach sociobiology? Trends Genet 23: 74–80 [DOI] [PMC free article] [PubMed] [Google Scholar]
- Fung E, Wong WW, Suen JK, Bulter T, Lee SG, Liao JC (2005) A synthetic gene-metabolic oscillator. Nature 435: 118–122 [DOI] [PubMed] [Google Scholar]
- Fussmann GF, Ellner SP, Shertzer KW, Hairston NG Jr (2000) Crossing the hopf bifurcation in a live predator–prey system. Science 290: 1358–1360 [DOI] [PubMed] [Google Scholar]
- Gardner TS, Cantor CR, Collins JJ (2000) Construction of a genetic toggle switch in Escherichia coli. Nature 403: 339–342 [DOI] [PubMed] [Google Scholar]
- Gray KM, Passador L, Iglewski BH, Greenberg EP (1994) Interchangeability and specificity of components from the quorum-sensing regulatory systems of Vibrio fischeri and Pseudomonas aeruginosa. J Bacteriol 176: 3076–3080 [DOI] [PMC free article] [PubMed] [Google Scholar]
- Haseltine EL, Arnold FH (2007) Synthetic gene circuits: design with directed evolution. Annu Rev Biophys Biomol Struct 36: 1–19 [DOI] [PubMed] [Google Scholar]
- Hasty J, McMillen D, Collins JJ (2002) Engineered gene circuits. Nature 420: 224–230 [DOI] [PubMed] [Google Scholar]
- Kobayashi H, Kaern M, Araki M, Chung K, Gardner TS, Cantor CR, Collins JJ (2004) Programmable cells: interfacing natural and engineered gene networks. Proc Natl Acad Sci USA 101: 8414–8419 [DOI] [PMC free article] [PubMed] [Google Scholar]
- Levskaya A, Chevalier AA, Tabor JJ, Simpson ZB, Lavery LA, Levy M, Davidson EA, Scouras A, Ellington AD, Marcotte EM, Voigt CA (2005) Engineering Escherichia coli to see light—these smart bacteria ‘photograph' a light pattern as a high-definition chemical image. Nature 438: 441–442 [DOI] [PubMed] [Google Scholar]
- Lutz R, Bujard H (1997) Independent and tight regulation of transcriptional units in Escherichia coli via the LacR/O, the TetR/O and AraC/I1-I2 regulatory elements. Nucleic Acids Res 25: 1203–1210 [DOI] [PMC free article] [PubMed] [Google Scholar]
- Marguet P, Balagadde F, Tan CM, You L (2007) Biology by design: reduction and synthesis of cellular components and behavior. J R Soc Interface 4: 607–623 [DOI] [PMC free article] [PubMed] [Google Scholar]
- May RM (1974) Stability and Complexity in Model Ecosystems, 2nd edn. Princeton, NJ: Princeton University Press [Google Scholar]
- Murray JD (2002) Mathematical Biology, 3rd edn. New York, NY: Springer [Google Scholar]
- Nowak MA, Sigmund K (2004) Evolutionary dynamics of biological games. Science 303: 793–799 [DOI] [PubMed] [Google Scholar]
- Shou WY, Ram S, Vilar JMG (2007) Synthetic cooperation in engineered yeast populations. Proc Natl Acad Sci USA 104: 1877–1882 [DOI] [PMC free article] [PubMed] [Google Scholar]
- Simpson ML (2004) Rewiring the cell: synthetic biology moves towards higher functional complexity. Trends Biotechnol 22: 555–557 [DOI] [PubMed] [Google Scholar]
- Sprinzak D, Elowitz MB (2005) Reconstruction of genetic circuits. Nature 438: 443–448 [DOI] [PubMed] [Google Scholar]
- Taylor RJ (1984) Predation. New York, NY: Chapman and Hall Ltd [Google Scholar]
- Weber W, Baba M, Fussenegger M (2007) Synthetic ecosystems based on airborne inter- and intrakingdom communication. Proc Natl Acad Sci USA 104: 10435–10440 [DOI] [PMC free article] [PubMed] [Google Scholar]
- Weiss R (2001) Cellular Computation and Communication Using Engineered Genetic Regulatory Networks. Boston, MA: Massachusetts Inst. Technology [Google Scholar]
- Weiss R, Knight TFJ (2000) Engineered communications for microbial robotics. In DNA6: Sixth International Meeting on DNA Based Computers. Leiden, The Netherlands, pp 1–16 [Google Scholar]
- You L, Cox RS, Weiss R, Arnold FH (2004) Programmed population control by cell–cell communication and regulated killing. Nature 428: 868–871 [DOI] [PubMed] [Google Scholar]
Associated Data
This section collects any data citations, data availability statements, or supplementary materials included in this article.
Supplementary Materials
Supplementary Information
Supplementary XML