

Abstract
Background
Stresses within the neuropathic foot’s tissues can be estimated by pressure distributions and may provide information regarding the potential for skin breakdown. The purposes of this study were to: 1) determine the magnitude of peak plantar pressure, pressure time integral, peak pressure gradient, and peak maximum shear stress; and 2) determine the association of these variables with one another.
Methods
Forefoot peak plantar pressure, pressure time integral, peak pressure gradient, peak maximal shear stress, and depth of peak maximal shear stress were calculated for 16 controls, 16 people with diabetic neuropathy, and 22 people with diabetic neuropathy and a history of ulceration from pressure assessments.
Findings
Peak plantar pressure, pressure gradient, and maximal shear stress were greater in subjects with a history of ulceration relative to control subjects (p < 0.03), pressure gradient was greater in subjects with diabetic neuropathy and a history of ulceration compared to subjects with diabetic neuropathy and no history of ulceration (p < 0.02), and depth of maximal shear stress was less in both groups of subjects with diabetic neuropathy compared to controls (p < 0.03). Strong relationships existed between the variables.
Interpretation
Although these variables are associated with one another, peak pressure gradient and peak maximal shear stress provide information concerning plantar pressure distribution and the potentially injurious internal stresses within the foot’s soft tissues. Peak pressure gradient and peak maximal shear stress may perhaps be more discriminating than peak plantar pressure alone in distinguishing between groups of individuals who are at risk for developing a foot ulcer.
Keywords: Plantar pressure, foot ulceration, Diabetes Mellitus
INTRODUCTION
Foot ulceration is a common and costly problem in people with diabetes mellitus (DM) and peripheral neuropathy (PN). Fifteen percent of people with DMPN will develop at least one plantar foot ulcer in their lifetime, and 24% of these people will require a subsequent amputation of the foot and/or leg (Reiber, 2001, American Diabetes Association, 1999). High peak plantar pressure coupled with a lack of protective sensation from sensory PN is a known contributing factor to the development of these plantar foot ulcers (Caselli et al., 2002; Pitei et al., 1999; Veves et al., 1992). As people with DMPN and high peak plantar pressure walk, the soft tissues of their feet are subjected to repetitive stresses which have been associated with the location of skin breakdown (Boulton et al., 1983).
To better understand how these stresses impact the soft tissues of the foot, investigators have examined various pressure variables. Researchers commonly use peak plantar pressure as a construct for trauma to the soft tissues of the plantar aspect of the foot (Caselli et al., 2002; Pitei et al., 1999; Veves et al., 1992), but there does not appear to be a set threshold of peak plantar pressure that predicts when foot ulceration will occur (Armstrong et al., 1998). Other researchers have examined how both the magnitude and duration of the applied pressure impact the foot by using the variable of pressure time integral (Soames, 1985; Sauseng et al., 1999; Stacpoole-Shea et al., 1999; Hsi et al., 2002; Stess et al., 1997). Maluf and Mueller utilized pressure time integral to estimate the daily cumulative stress (the product of pressure time integral and number of steps taken per day) to the foot (Maluf and Mueller, 2003).
Although all of the aforementioned pressure variables provide useful information regarding the stress exposure to the neuropathic foot, there is still considerable information that these variables do not provide regarding the potential for skin breakdown. Several mechanical factors may contribute in various ways to skin breakdown in people with DMPN (Mueller and Maluf, 2002). Mueller et al. recently described two other variables that appear to provide additional information regarding the potential trauma to the foot’s soft tissues (Mueller et al., 2005). The peak pressure gradient is defined as the spatial change in plantar pressure around the location of the peak plantar pressure (Mueller et al., 2005). This peak pressure gradient is associated with peak plantar pressure in the forefoot of people with DMPN and a history of a foot ulcer (r = 0.59), but peak pressure gradient appears to provide additional information as an indicator of plantar skin injury (Mueller et al., 2005). As two adjacent areas of the foot experience pressures with a large difference between them, we believe this high pressure gradient results in greater internal stress concentrations and increased risk of damaging the soft tissues of the foot when compared to high pressures that are more evenly spread across the foot.
More recently, Zou et al. described the peak maximum shear stress within the subsurface soft tissues of the foot (Zou et al., 2007). The maximum shear stress plays a key role in the mechanical failure criteria (Hills et al., 1993) and may predict tissue trauma and breakdown by estimating internal stresses. Finite element models of the foot have been used to predict stresses within the neuropathic foot (Actis et al., 2004; Chen et al., 2001; Gefen, 2003, Goske et al., 2005; Thomas et al., 2001), but these models can be quite complex and labor intensive to design and utilize. Zou et al. have described how to estimate the peak maximum shear stress and the depth of this stress from a clinically derived plantar pressure assessment using a potential function based on the theory of elasticity (Zou et al., 2007). This peak maximum shear stress and its depth can then be utilized to estimate the location and magnitude of the harmful internal stresses within the soft tissues of the neuropathic foot that appear to contribute to skin breakdown with less effort and complexity than a finite element analysis model.
While scientists have investigated peak pressure gradient and peak maximum shear stress in people with DMPN and a history of ulceration, we could find no studies describing these variables in other populations. Investigating these variables in populations with varying ulceration risk may provide additional information regarding how peak pressure gradient and peak maximum shear stress contribute to skin breakdown in the neuropathic foot. Therefore, the purposes of this study were to: 1) determine the magnitude of in-shoe pressure variables (peak plantar pressure, pressure time integral, peak pressure gradient, peak maximum shear stress and depth of peak maximum shear stress) in people with varied risk of foot ulceration and 2) determine the association of these pressure variables with one another. We hypothesized that: 1) the magnitude of peak plantar pressure, pressure time integral, peak pressure gradient, and peak maximum shear stress in the forefoot would be greatest for people with DMPN and a history of plantar ulcer (DMPN+U), less in people with DMPN and no history of skin breakdown, and even less in healthy people without DMPN; and 2) the pressure variables would be highly correlated with one another, but peak pressure gradient and peak maximum shear stress would be more discriminatory between groups than peak plantar pressure and pressure time integral.
METHODS
Subjects were recruited from the Diabetic Foot Center, Volunteers for Health, the Diabetes Research Training Center at Washington University School of Medicine, and the BJC Health System in St. Louis, MO, USA. Methods of recruitment for subject participation included Institutional Review Board approved fliers describing the study, phone calls to people who had expressed an interest and willingness to participate in studies at Washington University School of Medicine, and referrals from health care practitioners treating people with DMPN. Three groups of subjects participated in the study: 16 healthy people without DMPN (CON), 16 people with DMPN and no history of skin breakdown, and 22 individuals with DMPN+U. Two of the DMPN+U participants had an active unilateral ulcer (one at first metatarsal head and one at third metatarsal head) at the time of testing; however, measures were only taken on the foot without an active ulcer for these subjects. Criteria for all three groups included being ambulatory without an assistive device, having palpable pedal pulses (dorsalis pedis and posterior tibial artery pulses clinically assessed by a physical therapist), and having no history of severe midfoot or rearfoot Charcot neuroarthropathy. Less severe foot deformities (i.e. hammer toes) and foot type were not included as criteria for this study. Inclusion criteria for the groups with PN were a medical diagnosis of DM, an inability to sense the 5.07 Semmes Weinstein monofilament on the plantar aspect of the foot, and a vibratory perception threshold (VPT) of >25 V. See Table 1 for subject characteristics of these three groups. All subjects read and signed the informed medical consent according to institutional review board approved protocol prior to entering the study.
Table 1.
Subject Characteristics
| Group | CON | DMPN | DMPN+U |
|---|---|---|---|
| n | 16 | 16 | 22 |
| Gender (% male) | 63 | 75 | 68 |
| Age (years) | 62 (8) | 65 (12) | 57 (9)† |
| Body Mass Index (kg/m2) | 33 (6) | 34 (9) | 34 (9) |
| Duration of DM (years) | NA | 20 (12) | 15 (9) |
| DM type (% type 2) | NA | 88 | 81 |
| HbA1c (%) | 5.7 (0.4) | 7.7 (1.6)* | 8.4 (2.0)* |
| VPT (V) | 17 (9) | 45 (8)* | 49 (2)*† |
Data are in means (SD).
denotes difference from CON group (p < 0.05);
denotes difference from DMPN group (p < 0.05).
Sensation was tested using Semmes Weinstein monofilaments and a biothesiometer. All subjects in the DMPN+U and DMPN groups were unable to sense the 5.07 Semmes Weinstein monofilament on at least 2 sites on the plantar foot as described elsewhere (Diamond et al., 1989). Sensation was also quantified with a biothesiometer (Biomedical Instrument, Newbury, OH, USA). The head of the biothesiometer was held perpendicular to the plantar surface of the great toe and the amplitude of the vibration was gradually increased. The VPT was defined as the lowest voltage the patient could perceive using a mean of 3 trials (Pham et al., 2000; Caselli et al., 2002). A value of 50 V was assigned to those subjects unable to perceive the voltage even when turned to its maximum amplitude. On average, the VPT for the CON group was 17.0 (SD 9.3) V (Table 1). The mean values for the other two groups (DMPN 45.0 (SD 7.6) V and DMPN+U 48.7 (SD 2.3) V) were substantially higher than the CON group and significantly different from each other (p<0.05). A ceiling effect was evident in the VPT measure of these 2 groups due to the biothesiometer’s upward limit of 50 V. Forty-four percent of the DMPN subjects and 73% of the DMPN+U subjects could not perceive the vibration of the biothesiometer at its 50 V limit indicating the severe level of neuropathy in both groups, but especially in the DMPN+U subjects.
All 54 subjects participated in plantar pressure assessment while wearing standardized footwear (SoleTech shoes, Advance Orthopedic footwear, E3010) that is commonly used in clinical practice to reduce forefoot pressures in people with DMPN. An orthotist or pedorthist fitted the shoes for the DMPN+U subjects, and a physical therapist fitted the shoes for the DMPN and CON subjects. Pressure data were collected with the F-Scan system (Tekscan, Boston, MA, USA) during walking at a self-selected pace following previously validated methods (Mueller and Strube, 1996; Pitei et al., 1999; Nicolopoulos et al., 2000). Each F-Scan in-shoe sensor contains 960 individual sensels that are arranged in an array with individual sensel dimensions being 5.08 x 5.08 mm. A new sensor was trimmed to fit the shape of the subject’s foot and was inserted in the footwear lying between the shoe’s standard insert and the subject’s thin cotton sock. The subjects wore the shoe with the sensor inside and walked in the shoe for approximately 40 steps to allow for adequate sensor “break in” (Mueller and Strube, 1996; Pitei et al., 1999). We then calibrated the sensor according to the manufacturer’s guidelines and an additional calibration factor was determined as previously reported (Mueller and Strube, 1996; Pitei et al., 1999). During data collection, subjects walked at a self-selected walking speed, and data was collected at 50 Hz for 2 walking trials. The mean of 3 consecutive steps was used from the middle portion of the walking trials for determining the pressure variables. No difference was noted in walking speed for the three groups [CON 1.03 (SD 0.09) m/s, DMPN 0.95 (SD 0.08) m/s, and DMPN+U 0.93 (SD 0.20) m/s (p = 0.12)].
The pressure time integral variable for the forefoot was determined from the F-Scan software. The foot was divided in half from the most distal pressure reading to the most proximal pressure reading. ASCII files with data from the three middle steps were processed by custom software to determine the peak plantar pressure, peak pressure gradient, peak maximum shear stress, and depth of the peak maximum shear stress in the forefoot as described previously (Mueller et al., 2005; Zou et al., 2007). In brief, a bicubic polynomial smoothing was done to the pressure data prior to the calculation of the peak pressure gradient at the location of the peak plantar pressure for the forefoot.
The peak pressure gradient was determined in a defined area [a 3 x 3 box of F-Scan sensels (231.3 mm2)] around the peak plantar pressure on nodes (spacing equal to half the length of the sensels) which were generated using the bicubic polynomial spline function. The peak pressure gradient was calculated by determining the greatest difference in pressure from one node (half sensel apart) to the next according to rows, columns, and by diagonal. For determining the peak maximum shear stress; 3-D, principal, and shear stresses were first calculated for the subsurface tissues. The maximum shear stress was then calculated in the forefoot at 8 different depths from 0 to 10 mm, and the peak maximum shear stress was identified as the greatest maximum shear stress value (Zou et al., 2007).
One-way analysis of variance with post-hoc t-tests with Bonferroni correction were used to test for differences between the three groups (CON, DMPN, and DMPN+U) for age, body mass index, glycated hemoglobin, VPT, and each of the pressure variables in the forefoot (peak plantar pressure, pressure time integral, paek pressure gradient, peak maximum shear stress, and depth of peak maximum shear stress). Pearson correlation coefficients were used to examine the association of these pressure variables with one another for all 54 subjects. Criterion for significance was set at p = 0.05.
RESULTS
As illustrated in Figure 1, the peak plantar pressure (p < 0.05), peak pressure gradient (p < 0.0009), peak maximum shear stress (p < 0.05), and depth of the peak maximum shear stress (p < 0.0006) were different between groups. Post-hoc testing revealed differences between: 1) CON and DMPN+U groups for peak plantar pressure (increase of 26.1% relative to CON, p < 0.03), peak pressure gradient (increase of 88.3% relative to CON, p <0.0004), peak maximum shear stress (increase of 28.6% relative to CON, p < 0.02), and depth of peak maximum shear stress (decrease of 25.4% relative to CON, p < 0.0002), 2) CON and DMPN groups for depth of peak maximum shear stress (decrease of 13.0% relative to CON, p < 0.03), and 3) DMPN and DMPN+U groups for peak pressure gradient (increase of 44% relative to DMPN, p < 0.02). No differences were noted for PTI. A strong association was noted for: peak maximum shear stress and peak plantar pressure (r = 0.97; p < 0.0001), peak maximum shear stress and peak pressure gradient (r = 0.79; p < 0.0001), peak pressure gradient and peak plantar pressure (r = 0.84; p < 0.0001), and depth of peak maximum shear stress and peak pressure gradient (r = −0.56; p < 0.0001) (see Figure 2). A relatively lower association was noted for depth of peak maximum shear stress and peak plantar pressure (r = −0.27; p = 0.05).
Figure 1.

Pressure variables of peak plantar pressure (PPP); pressure time integral (PTI); peak pressure gradient (PPG); peak maximal shear stress (PMSS); and depth of PMSS at the forefoot (FF) for healthy control subjects (CON); people with diabetes mellitus, peripheral neuropathy, and no history of a foot ulcer (DMPN); and those with DMPN and a history of a foot ulcer (DMPN+U).
* denotes difference from CON group (p < 0.05); † denotes difference from DMPN group (p < 0.05).
Figure 2.
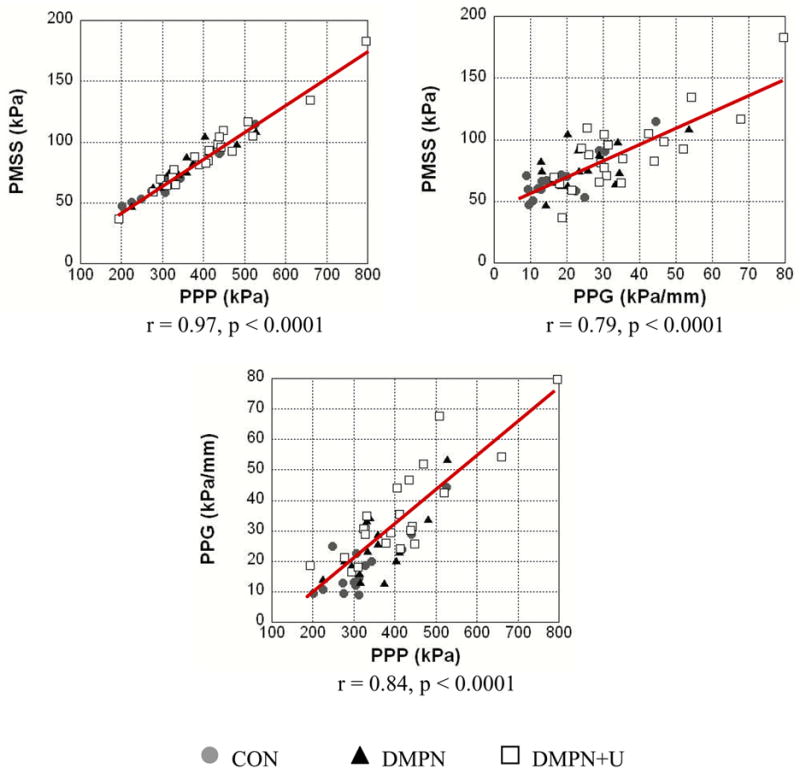
Relationship between peak maximal shear stress (PMSS), peak plantar pressure (PPP), and peak pressure gradient (PPG) for all 54 subjects.
DISCUSSION
The results of our study demonstrate an increase in peak plantar pressure, peak pressure gradient, and peak maximum shear stress and a decrease in depth of peak maximum shear stress in the forefoot of people with DMPN+U when compared to a healthy group of people without DMPN. Although these variables have a strong relationship with one another, each one provides some information that is unique from the other variables concerning the stresses the soft tissues of the forefoot experience during walking. The unique information each of these variables provides may contribute to a better understanding of ulceration risk in the neuropathic foot. Unlike previous studies, we did not find any difference between groups for pressure time integral in the forefoot (Stess et al., 1997; Sauseng et al., 1999). Although walking speed may affect the magnitude of PTI (Hsi et al., 2002), there was no difference noted in walking speed between the three groups in our study (p = 0.12). Peak pressure gradient was the only pressure variable that distinguished between people with DMPN who had no history of foot ulceration and the DMPN+U group, and depth of peak maximum shear stress was the only variable that differentiated between CON and DMPN groups. These findings provide support to the importance of considering both peak pressure gradient and peak maximum shear stress when assessing patients who are at risk for skin breakdown (i.e. patients with DMPN who demonstrate high peak plantar pressure).
While peak plantar pressure and more recently pressure time integral have been investigated by several groups of clinical scientists (Soames, 1985; Veves et al., 1992; Stess et al., 1997; Pitei et al., 1999; Stacpoole-Shea et al., 1999; Sauseng et al., 1999; Caselli et al., 2002; Hsi et al., 2002), little research has been done in evaluating the importance of peak pressure gradient and peak maximum shear stress and their potential contribution to tissue trauma and foot ulceration in people with DMPN. Prabhu et al. have described a variable similar to peak pressure gradient (Prabhu et al., 2001), and the concept of a pressure gradient contributing to potentially harmful internal stresses is documented in the engineering literature (Johnson, 1987). A large change in pressure across the surface of the skin (a high peak pressure gradient) may result in excessive internal stress concentrations and resultant shearing of the soft tissues, which may contribute to tissue injury and breakdown (Mueller et al., 2005). Interestingly, peak pressure gradient was the only pressure variable in this study that distinguished between people with DMPN+U and those with DMPN but no history of skin breakdown. In addition, peak pressure gradient was 88% greater in the DMPN+U group compared to CON while peak plantar pressure was only 26% greater. Lavery et al. stated that additional variables beyond peak plantar pressure are needed to better understand the risk of developing an ulcer (Lavery et al., 2003). Both peak pressure gradient and peak maximum shear stress appear to provide additional discriminatory information (beyond what is obtained from peak plantar pressure alone) to distinguish between groups of people who are at risk of skin breakdown. Future work examining plantar pressure should continue to investigate peak pressure gradient and peak maximum shear stress as variables that may be more sensitive indicators than peak plantar pressure and pressure time integral alone in distinguishing between people who are at risk for developing a foot ulcer.
In this study peak plantar pressure, peak pressure gradient, peak maximum shear stress, and the depth of peak maximum shear stress were different between CON and DMPN+U subjects. Depth of peak maximum shear stress was the only pressure variable that differentiated between the CON and DMPN groups. This ability to distinguish between a group not at risk for developing a foot ulcer (CON) and a group at risk for skin breakdown without prior ulceration (DMPN) highlights the importance of quantifying peak maximum shear stress and its depth. Theoretically, the maximum shear stress appears to be important to consider for determining when a material will fail and ultimately breakdown (Hills et al., 1993). Gefen et al. have suggested these internal shear stresses are increased in the feet of people with DM relative to healthy people without DM and that these internal shear stress concentrations may contribute to micro-tears in the soft tissues of the neuropathic foot that lead to skin breakdown and ulceration (Gefen, 2003; Gefen and Linder-Ganz, 2004). Finite element models have also estimated that the greatest amount of these stresses occurs in the deep soft tissues of the foot (Gefen, 2003; Gefen and Linder-Ganz, 2004) similar to where we have estimated the depth of the peak maximum shear stress (7.2–9.6 mm from the plantar surface). Additional prospective studies are required to clarify the usefulness of these variables that are highly correlated with one another, but appear to provide some unique information that may be helpful in identifying people most at risk for skin breakdown.
There are limitations to our study. In order to determine the peak maximum shear stress, we made several assumptions including that the plantar soft tissue was homogenous, isotropic, linearly elastic, and bounded by an infinite plane. The error associated with these assumptions is unknown, but we estimated it by comparing results of previous calculations (Zou et al., 2007) to the results derived from a finite element analysis that has undergone a systematic process involving validation and verification (Actis et al., 2006). The peak maximum shear stress predicted by the potential theory method using the measured pressures for four subjects in both a barefoot and shoe with total contact insert footwear conditions were compared to the predicted peak maximum shear stress using a two-dimensional finite element analysis method. The comparison of peak maximum shear stress computed by the finite element analysis and the potential theory demonstrated only small differences (from 4 to 8%) (unpublished data). The advantage to making the assumptions with the potential theory method is that we were able to estimate the high shear stresses within the foot’s soft tissues using only the measured plantar pressure distribution. This type of calculation can be done with equipment available in clinical practice and does not require the complexity of a finite element model. Each of these approaches, however, is an estimate of internal stresses and requires further validation using direct measurement techniques, as these direct measurement techniques are developed in the future.
Other limitations to our study were that the design was cross-sectional and included three groups of patients using only one type of footwear to obtain in-shoe pressure variables. While standardizing footwear decreased the confounding factor of the effect of different types of footwear on plantar pressure, having patients use their own footwear should provide more accurate information concerning the stresses individual subjects experience on a daily basis. Additional research is also needed to determine these variables during barefoot walking. We speculate the differences between groups would be even higher without the stress dispersing benefit of therapeutic footwear. We also only determined the peak pressure gradient around the location of peak plantar pressure and did not examine the pressure gradients at other areas of the foot. While it is possible for the peak pressure gradient to be in another area of the foot away from the peak plantar pressure, we believe it is the combination of high peak plantar pressure with peak pressure gradient that most likely contributes to harmful stresses to the soft tissues of the foot.
CONCLUSIONS
In conclusion, the results of this study provide further support for the importance of determining peak pressure gradient and peak maximum shear stress when assessing patients with DMPN and high peak plantar pressure. Although related to peak plantar pressure, both peak pressure gradient and peak maximum shear stress provide information regarding the distribution of peak plantar pressure on the plantar surface of the foot and the resultant internal stresses which may be harmful to the soft tissues. Peak pressure gradient and peak maximum shear stress may be better indicators than peak plantar pressure alone in distinguishing between groups of patients who are at risk for skin breakdown but additional prospective studies are needed.
Acknowledgments
Funding was provided by the Foundation for Physical Therapy, Inc. (Promotion of Doctoral Studies I and II scholarships awarded to DJL) and the National Center for Medical Rehabilitation Research, the National Institutes of Health Grant RO1 HD36895. The authors acknowledge the Volunteer for Health program at Washington University School of Medicine and the Prevention and Control Research Core of the Washington University Diabetes Research and Training Center (P60 DK20579) for their assistance in subject recruitment.
Footnotes
Publisher's Disclaimer: This is a PDF file of an unedited manuscript that has been accepted for publication. As a service to our customers we are providing this early version of the manuscript. The manuscript will undergo copyediting, typesetting, and review of the resulting proof before it is published in its final citable form. Please note that during the production process errors may be discovered which could affect the content, and all legal disclaimers that apply to the journal pertain.
References
- Actis RL, Ventura LB, Szabo BA, Commean PK, Smith KE, Lott DJ, Mueller MJ. Effect of modeling assumptions in the plantar pressure distribution of the diabetic foot using the p-version of the finite element method. Proceedings of ASME, IMECE; Anaheim, CA. 2004. p. 59400. [Google Scholar]
- Actis RL, Ventura LB, Smith KE, Commean PK, Lott DJ, Pilgram TK, Mueller MJ. Numerical simulation of the plantar pressure distribution in the diabetic foot during the push-off stance. Medical & Biological Engineering & Computing. 2006;44:653–663. doi: 10.1007/s11517-006-0078-5. [DOI] [PubMed] [Google Scholar]
- American Diabetes Association. Consensus development conference on diabetic foot wound care. Diabetes Care. 1999;22:1354–60. doi: 10.2337/diacare.22.8.1354. [DOI] [PubMed] [Google Scholar]
- Armstrong DG, Peters EJ, Athanasiou KA, Lavery LA. Is there a critical level of plantar foot pressure to identify patients at risk for neuropathic foot ulceration? Journal of Foot & Ankle Surgery. 1998;37:303–307. doi: 10.1016/s1067-2516(98)80066-5. [DOI] [PubMed] [Google Scholar]
- Boulton AJ, Hardisty CA, Betts RP, Franks CI, Worth RC, Ward JD, Duckworth T. Dynamic foot pressure and other studies as diagnostic and management aids in diabetic neuropathy. Diabetes Care. 1983;6:26–33. doi: 10.2337/diacare.6.1.26. [DOI] [PubMed] [Google Scholar]
- Caselli A, Armstrong DG, Pham H, Veves A, Giurini JM. The forefoot-to-rearfoot plantar pressure ratio is increased in severe diabetic neuropathy and can predict foot ulceration. Diabetes Care. 2002;26:1066–1071. doi: 10.2337/diacare.25.6.1066. [DOI] [PubMed] [Google Scholar]
- Chen W, Tang F, Ju C. Stress distribution of the foot during mid-stance to push-off in barefoot gait: a 3-D finite element analysis. Clinical Biomechanics. 2001;16:614–620. doi: 10.1016/s0268-0033(01)00047-x. [DOI] [PubMed] [Google Scholar]
- Diamond JE, Mueller MJ, Delitto A, Sinacore DR. Reliability of a diabetic foot evaluation. Physical Therapy. 1989;69:797–802. doi: 10.1093/ptj/69.10.797. [DOI] [PubMed] [Google Scholar]
- Gefen A. Plantar soft tissue loading under the medial metatarsals in the standing diabetic foot. Medical Engineering & Physics. 2003;25:491–499. doi: 10.1016/s1350-4533(03)00029-8. [DOI] [PubMed] [Google Scholar]
- Gefen A, Linder-Ganz E. Diffusion of ulcers in the diabetic foot is promoted by stiffening of plantar muscular tissue under excessive bone compression. Orthopade. 2004;33:999–1012. doi: 10.1007/s00132-004-0701-9. [DOI] [PubMed] [Google Scholar]
- Goske S, Erdemir A, Petre M, Budhabhatti S, Cavanagh PR. Reduction of plantar heel pressures: Insole design using finite element analysis. Journal of Biomechanics. 2006;39:2363–2370. doi: 10.1016/j.jbiomech.2005.08.006. [DOI] [PubMed] [Google Scholar]
- Hills DA, Nowell D, Sackfield A. Mechanics of Elastic Contacts. Butterworth-Heinemann Ltd; 1993. [Google Scholar]
- Hsi WL, Chai HM, Lai JS. Comparison of pressure and time parameters in evaluating diabetic footwear. American Journal of Physical Medicine & Rehabilitation. 2002;81:822–829. doi: 10.1097/00002060-200211000-00004. [DOI] [PubMed] [Google Scholar]
- Johnson KL. Contact Mechanics. Cambridge University Press; 1987. [Google Scholar]
- Lavery LA, Armstrong DG, Wunderlich RP, Tredwell J, Boulton AJM. Predictive value of foot pressure assessment as part of a population-based diabetes disease management program. Diabetes Care. 2003;26:1069–1073. doi: 10.2337/diacare.26.4.1069. [DOI] [PubMed] [Google Scholar]
- Maluf KS, Mueller MJ. Comparison of physical activity and cumulative plantar tissue stress among subjects with and without diabetes mellitus and a history of recurrent plantar ulcers. Clinical Biomechanics. 2003;18:567–575. doi: 10.1016/s0268-0033(03)00118-9. [DOI] [PubMed] [Google Scholar]
- Mueller MJ, Strube MJ. Generalizability of in-shoe peak pressure measures using the F-Scan system. Clinical Biomechanics. 1996;11:159–164. doi: 10.1016/0268-0033(95)00047-x. [DOI] [PubMed] [Google Scholar]
- Mueller MJ, Maluf KS. Tissue adaptation to physical stress: a proposed “Physical Stress Theory” to guide physical therapist practice, education, and research. Physical Therapy. 2002;82:383–403. [PubMed] [Google Scholar]
- Mueller MJ, Zou D, Lott DJ. Pressure gradient” as an indicator of plantar skin injury. Diabetes Care. 2005;28:2908–2912. doi: 10.2337/diacare.28.12.2908. [DOI] [PubMed] [Google Scholar]
- Nicolopoulos CS, Anderson EG, Solomonidis SE, Giannoudis PV. Evaluation of the gait analysis FSCAN pressure system: clinical tool or toy? The Foot. 2000;10:124–130. [Google Scholar]
- Pham H, Armstrong DG, Harvey C, Harkless LB, Giurini JM, Veves A. Screening techniques to identify people at high risk for diabetic foot ulceration. Diabetes Care. 2000;23:606–611. doi: 10.2337/diacare.23.5.606. [DOI] [PubMed] [Google Scholar]
- Pitei DL, Lord M, Foster A, Wilson S, Watkins PJ, Edmonds ME. Plantar pressures are elevated in the neuroischemic and the neuropathic diabetic foot. Diabetes Care. 1999;22:1966–1970. doi: 10.2337/diacare.22.12.1966. [DOI] [PubMed] [Google Scholar]
- Prabhu KG, Patil KM, Srinivasan S. Diabetic feet at risk: a new method of analysis of walking foot pressure images at different levels of neuropathy for early detection of plantar ulcers. Medical & Biological Engineering & Computing. 2001;39:288–293. doi: 10.1007/BF02345282. [DOI] [PubMed] [Google Scholar]
- Reiber GE. Epidemiology of foot ulcers and amputations in the diabetic foot. In: Bowker JH, Pfeifer MA, editors. The Diabetic Foot. 6. St. Louis, MO: Mosby Inc; 2001. pp. 13–32. [Google Scholar]
- Sauseng S, Kastenbauer T, Sokol G, Irsigler K. Estimation of risk for plantar foot ulceration in diabetic patients with neuropathy. Diabetes, Nutrition & Metabolism – Clinical & Experimental. 1999;12:189–193. [PubMed] [Google Scholar]
- Soames RW. Foot pressure patterns during gait. Journal of Biomedical Engineering. 1985;7:120–126. doi: 10.1016/0141-5425(85)90040-8. [DOI] [PubMed] [Google Scholar]
- Stacpoole-Shea S, Shea G, Lavery L. An examination of plantar pressure measurements to identify the location of diabetic forefoot ulceration. Journal of Foot & Ankle Surgery. 1999;38:109–115. doi: 10.1016/s1067-2516(99)80021-0. [DOI] [PubMed] [Google Scholar]
- Stess RM, Jensen SR, Mirmiran R. The role of dynamic plantar pressures in diabetic foot ulcers. Diabetes Care. 1997;20:855–858. doi: 10.2337/diacare.20.5.855. [DOI] [PubMed] [Google Scholar]
- Thomas VJ, Patil KM, Radhakrishnan S. Three-dimensional stress analysis for the mechanics of plantar ulcers in diabetic neuropathy. Medical & Biological Engineering & Computing. 2001;42:230–235. doi: 10.1007/BF02344636. [DOI] [PubMed] [Google Scholar]
- Veves A, Murray HJ, Young MJ, Boulton AJ. The risk of foot ulceration in diabetic patients with high foot pressure: a prospective study. Diabetologia. 1992;35:660–663. doi: 10.1007/BF00400259. [DOI] [PubMed] [Google Scholar]
- Zou D, Mueller MJ, Lott DJ. Effect of peak pressure and pressure gradient on subsurface shear stresses in the neuropathic foot. Journal of Biomechanics. 2007;40:883–890. doi: 10.1016/j.jbiomech.2006.03.005. [DOI] [PubMed] [Google Scholar]