

Abstract
Water oxidation to dioxygen in photosynthesis is catalyzed by a Mn4Ca cluster with O bridging in Photosystem II (PS II) of plants, algae and cyanobacteria. A variety of spectroscopic methods have been applied to analyzing the participation of the complex. X-ray spectroscopy is particularly useful because it is element-specific, and because it can reveal important structural features of the complex with high accuracy and identify the participation of Mn in the redox chemistry. Following a brief history of the application of X-ray spectroscopy to PS II, an overview of newer results will be presented and a description of the present state of our knowledge based on this approach.
Keywords: Photosystem II, X-ray spectroscopy, water oxidation, manganese enzyme
1. Introduction
1.1 X-ray absorption spectroscopy (XAS)
During the past 30 years X-ray spectroscopy has made major contributions to a wide variety of biochemical research and especially research on photosynthetic oxygen evolution. X-ray absorption spectroscopy (XAS) of the oxygen evolving complex (OEC), especially the earlier work, has been reviewed in some detail [1-6]. XAS as a method of characterizing the chemical nature and environment of atoms in molecules is particularly valuable because of its element specificity, and synchrotron sources provide a range of X-ray energies that are applicable to most elements in the periodic table – in particular, those present in redox-active metallo-enzymes. The choice of the energy of the X-rays used, in most cases, determines the specific element being probed. This is quite by contrast with other methods such as optical or UV absorption, fluorescence, magnetic susceptibility, electrochemistry, etc. which have been applied to biological redox systems. The results from infrared and Raman spectroscopy can be related to specific elements through isotopic substitution, but the analysis of such spectra for metal clusters is complicated when the structure is not known.
X-ray absorption near-edge spectra provide detailed information about the oxidation state and coordination environment of the metal atoms (Figure 1). The k-edge absorption edge energy increases with increasing oxidation state. A dominant contribution comes from 1s -> np transitions, where np represents the lowest unoccupied p orbital of the absorbing atom. This transition, with Δl = 1, is quantum mechanically allowed and is typically intense. Together with the allowed transitions to higher-energy unoccupied p orbitals, this results in a peak in the X-ray absorption for a given element just beyond the absorption edge, which is usually identified as the inflection point of the rising absorption. For transition metals with partially occupied d orbitals, additional insights can be gained by examination of pre-edge features that result from 1s to (n-1)d transitions. These are relatively weak in intensity (Δl = 2; hence, formally forbidden), but they can be detected because they occur at energies slightly less than that of the main absorption edge.
Fig. 1.
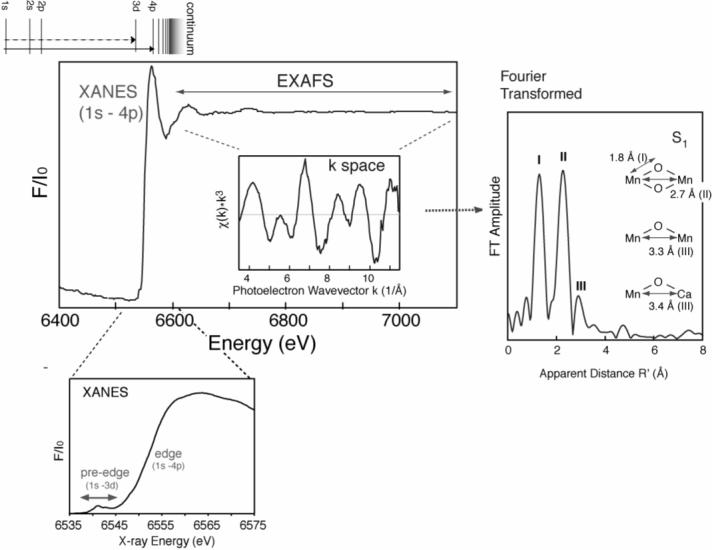
XANES and EXAFS spectra of a Mn complex. Fluorescence excitation spectra plot the X-ray fluorescence intensity divided by the incident X-ray intensity, F/I0, against the energy of the incident X-rays. The K-edge X-ray absorption near-edge spectra (XANES) reflect transitions from the 1s orbital to a bound-state orbital, as shown in the energy level diagram above the main figure. The 1s-4p transition is strongly allowed and contributes to the peak at 6554 eV for Mn. The 1s-3d transitions are only weakly allowed and give rise to pre-edge features. At higher X-ray energies, electrons are promoted to the continuum and leave the atom. Scattering of the electrons from nearby atoms results in Extended X-ray Absorption Fine Structure (EXAFS), which appears as interference modulations in the otherwise smooth continuum region. Removal of the smooth background and multiplication by k3, where k is the photoelectron wavevector, in Å−1 beyond the ionization energy, results in a k-space spectrum (insert). A Fourier transform of the Mn k-space spectrum for a spinach Photosystem II preparation in the S1-state is shown at the right. Peaks labeled I, II and III reflect major contributions from vectors that relate Mn to other-atoms vectors in the catalytic Mn cluster of PS II.
Extended X-ray absorption fine structure (EXAFS) occurs at energies sufficiently above the absorption edge that the excited core (e.g. K-shell) electron is released from the atom (Fig. 1). The wave nature of the departing electron results in interference owing to scattering off nearby atoms, which in turn is reflected by a modulation pattern in the X-ray absorption above the ionization energy. Fourier transform (FT) of the modulation provides distance information describing the vector(s) between the absorbing atom and atoms to which it is bound – typically within a range limit of 4−5 Å. Using the latest techniques, these vector lengths (distances) can be determined to a precision better than 0.1 Å [7] and much more precisely than by conventional X-ray crystallography, for example. For oriented single crystals or ordered membranes the interatomic vector orientations can be deduced from dichroism measurements. These techniques are especially useful for determining the structures of multi-nuclear metal clusters, such as the Mn4Ca cluster associated with water oxidation in the photosynthetic oxygen-evolving complex (OEC). Quite small changes in geometry/structure associated with transitions between the S-states can be readily detected. Another useful approach has been to do complementary EXAFS measurements, looking for example at both Mn K-edge and Ca K-edge signals for the OEC cluster, or doing a Sr -> Ca replacement and measuring at the Sr K-edge. It is more challenging to analyze the multiple Mn-Mn interactions in the cluster, because the absorptions are additive and overlap significantly.
Metal complexes as models with known structures have been essential in order to understand the XAS of metalloproteins. Inorganic chemists have synthesized molecules, determined their structure by X-ray diffraction and characterized the oxidation state using optical absorption, EPR or magnetic susceptibility [8]. Bi-, tri, and tetra-nuclear Mn complexes have been particularly valuable for interpreting the XAS of the OEC. Synthetic complexes also provide a basis for evaluating the influence of the coordination environment (coordination charge) on the absorption edge energy [9,10]. Changes in the coordination environment may be expected for the OEC Mn cluster as substrate water is bound, then deprotonated, and finally the O-O bond is formed prior to O2 release. Separating the Mn oxidation-state changes from changes in the coordination/structure presents a significant challenge.
XAS theory has been developed to an extent that it can be applied to complicated molecules of known structure. It is less straightforward to apply it to the OEC, where reliable and high-resolution models of the metal cluster and its molecular environment are not yet precisely defined. The basic XAS equation allows us to interpret EXAFS spectra to considerable advantage. Using available developed software like FEFF8 [11], X-ray spectral properties to be expected from specified cluster geometries can be calculated and compared with experimental measurements. Density functional theory can be applied to issues like the stability of a proposed cluster arrangement or the likelihood of postulated reaction paths.
1.2 XAS of Photosystem II (PS II)
1.2.1 XANES of PS II
The pioneering work of Melvin P. Klein and his associates introduced the use of X-ray fluorescence excitation spectra as a way of increasing sensitivity to small concentrations of metals that typically characterize biological materials [12]. Using this approach they demonstrated that Mn could be detected in a leaf by XAS. In the first EXAFS investigation of active chloroplasts from which excess Mn2+(aq) had been removed, comparison with synthetic models demonstrated that the di-μ-oxo bridged di-manganese structure motif is an important component of the OEC cluster [13]. In a companion paper describing studies of Mn XANES spectra of chloroplasts, it was concluded that the Mn atoms in the OEC are heterogeneous in their oxidation state and that the average oxidation state is higher than that of Mn2+(aq) [14]. Subsequent studies showed that illumination of initially dark-adapted chloroplasts showed an easily detectable increase in the Mn K-edge energy, which was interpreted as reflecting a higher average oxidation state of Mn in the S2 than in the S1 state [15,16]. In another investigation at the same time, a partial conversion to the S3 state provided evidence that no additional oxidation of Mn occurred during the S2 -> S3 transition [17]. As we shall see, this conclusion subsequently proved to be controversial. An S0-like state (S0′) was produced by chemical reduction of S1, and the Mn K-edge of the S0′-state reflected a more reduced Mn cluster than in S1 [18-20]. Thus, already nearly 20 years ago a picture had emerged to provide a basis for understanding important aspects of the Mn cluster structure and function. Subsequent refinements of X-ray methodology and using preparations having greater purity of the S-states have served to solidify and refine these initial conclusions [21-23].
1.2.2 EXAFS of PS II
The advance of structural insights using EXAFS proceeded more slowly. The superposition of contributions from 4 Mn atoms per OEC greatly complicates the analysis of the EXAFS data. Mn EXAFS of PS II exhibits three principal features in the Fourier Transform, designated Peaks I, II and III (Fig. 1, right). Peak I arises from nearest neighbor atoms (O and N) to Mn that are at distances in the range 1.8 − 2.1 Å. Typically the coordination environments of the 4 Mn atoms should collectively include more than twenty such vectors. At present all that can be concluded is that there are at least two classes of contributions to Peak I: short (1.8 Å) vectors resulting from bridging atoms and longer (2.1 Å) vectors reflecting terminal ligand atoms [24]. Peak II reflects contributions from Mn interacting with other Mn atoms at a distance approx. 2.8 Å. It was recognized early that this peak reflects contributions from di-μ-oxo bridged Mn-Mn vectors. Although initial measurements did not resolve Peak II further because of rather large uncertainties owing to noise in the data, [18,25] subsequent refinements in technology and better preparations of both S0 and S3 provided Mn EXAFS that were distinctly different from those of S1 or S2 [20,26]. The most recent results show substructure that reflects the heterogeneity in the contributions to Peak II also in the S1 and S2 states [7,27]. Peak III corresponding to vectors in the range 3.3 − 3.5 Å is typically smaller than the first two. Refinements, such as measuring EXAFS above the K-edge energy of Ca, or of Sr (replacing Ca), have resulted in the identification of contributions to Peak III from both Mn-Mn (at 3.3 Å) and Mn-Ca or Mn-Sr at 3.4 to 4.0 Å [27-29].
1.2.3 The Mn4Ca cluster of the oxygen-evolving complex
Models of the Mn4Ca cluster have been proposed in great variety. Some relatively simple models, such as a symmetric cubane of alternating Mn and O atoms [30], can be ruled out convincingly through examination of the EXAFS of synthetic molecules having that configuration [9]. To winnow the many other reasonable models, further information is needed. Particularly valuable is knowledge of the number of vectors of each particular length. Obtaining reliable counts requires careful examination of each proposed arrangement using theoretical expressions of the predicted EXAFS spectrum and comparing with experimental data. Recognition that Peak II results from two to three Mn-Mn interactions[31] and that Peak III reflects one Mn-Mn and probably one to two Mn-Ca interactions [28,29,32-34] helped greatly to narrow the choices. Nevertheless, reasonable models that satisfy these criteria number more than a dozen [35,36]. Many of these are recognizable clusters that occur in nature in Mn oxide minerals, which suggests a possible origin from precipitates in a primordial ocean [37].
2. Oxidation State Changes of the OEC
There is a consensus that Mn-centered oxidation occurs during the S0 to S1, and S1 to S2 transitions (Figure 2(a)). Within the context of localized oxidation, the formal oxidation state of the native S1 state has been assigned to Mn(III,III,IV,IV) and S2 to Mn(III,IV,IV,IV) (Some groups have proposed Mn(III,III,III,IV) in the S2 state and therefore Mn(III,III,III,III) for the S1 state [2,38]). Uncertainty remains about the S0 and S3 states. While evidence from EPR supports the alternation between odd-spin states (S0 and S2) and even-spin states (S1 and S3) [39], the precise characterization of any one of them has proved elusive. For simple compounds where the coordination environment is known, answers can usually be derived from examination of the Mn XANES spectrum. For the OEC, where the precise arrangement of the cluster and its peripheral coordination are not precisely known, the issue is more difficult to resolve. In the S0 state, one of the questions is whether Mn(II) is present, in which case the oxidation states are Mn (II,III,IV,IV) [40], or whether the oxidation states are Mn (III,III,III,IV) [32]. In the S3 state, whether Mn becomes further oxidized during the S2 to S3 transition was questioned in several publications [41-45]. Likely reasons for the discrepancies were reviewed by Penner-Hahn [3]. If Mn is not oxidized, one electron needs to come from a redox-active organic residue such as a protein side chain, bound water, or bridging oxygen. Hence, a ligand-centered oxidation would take place before O-O bond formation and release of molecular oxygen [22,23,46,47]. The conflicts concerning the S2 to S3 transition have led to two different types of proposed O2 evolution mechanisms, with one type incorporating the oxidation of ligand or substrate in the S3 state, and the other type invoking Mn oxidation during the S2 to S3 transition [48]. Fundamental differences in the chemistry of O-O bond formation and O2 evolution exist between these two types of mechanisms.
Fig. 2.

Oxidation-state changes of the OEC in PS II during the S-cycle. (a) Kok cycle, with a possible assignment of Mn formal oxidation numbers for each S-state. (b) XANES of each S-state, including an expansion of the pre-edge (top). Spectra of 2nd derivatives (± 3 eV smoothing) for each S-state spectrum (bottom). The inflection point energies (IPE) are obtained from the zero-crossing points of the 2nd derivative spectra.
In the following part, we look into the details of the XANES spectral changes of PS II during the S-state transitions. Two additional methods (Kβ emission spectroscopy and Resonant Inelastic X-ray Scattering, RIXS) have been used to understand the details of the oxidation state changes of the Mn4Ca cluster.
2.1 Mn K edge Spectroscopy
XANES spectra are sensitive to the oxidation state, spin state, and local geometry of the metal site. In general, the rising edge position shifts when the effective number of positive charges (in a simplified view, oxidation state) changes resulting from 1s core hole shielding effects [49]. In an atom with one electron, for example, the electron experiences the full charge of the positive nucleus. However, in an atom with many electrons, the outer electrons are simultaneously attracted to the positive nucleus and repelled by the negatively charged electrons. The higher the oxidation state of the metal, the more positive the overall charge of the atom, and therefore more energy is required to excite an electron from an orbital. Conversely, the XANES spectrum shifts to a lower energy when there is more negative charge on the metal.
Figure 2(b) shows the Mn K-edge spectrum of each S-state of spinach PS II after deconvolution of the spectra obtained from consecutive flash illumination into pure S-state spectra, and their second derivative spectra [23]. Traditionally, the inflection point of the rising Mn K main edge (electron 1s to 4p transition) has been used as an indicator of the oxidation states in the field of XAS including our group. The edge positions for each of the S-states have been quantitated by measuring the inflection point energy (IPE), given by the zero-crossing of the 2nd derivative. Extensive model compound studies have shown that, when Mn is oxidized by one electron in a set of Mn model compounds with similar ligands, the IPE shifts 1 to 2 eV to higher energy [50].
In PS II, there is a clear edge shift to higher energy during the S0 to S1 (2.1 +/− 0.15 eV shift) and S1 to S2 transitions (1.1 +/− 0.05 eV shift), indicating that Mn-centered oxidation occurs during these transitions. By contrast, the S2 to S3 state transition shows a much smaller shift (0.3 +/− 0.05 eV), suggesting that the chemistry of the S2 to S3 transition is different from that of the S0 to S1 or S1 to S2 transition [23,46] , This leaded us to the conclusion that a ligand-centered oxidation may take place in the S2 to S3 transition. However, Dau et al. has interpreted their data that there is an oxidation state changes during the S2 to S3 transition based also on the XANES spectra [42].
This contradiction arises from several possible reasons (see ref.[51] for the detail). Nevertheless, one has to be aware that the edge position cannot be simply an indicator of only the oxidation state and it is problematic to conclude oxidation state changes based only on the XANES inflection point. Due to the size of the metal 4p orbital, this orbital overlaps with p orbitals of the ligands, either through σ- or π-bonding. Consequently, XANES is sensitive not only to the oxidation state but also to the ligand environment of the metal. Additionally, no definite theory is available for calculating main K-edge spectra for transition-metal complexes, owing to several factors that affect the metal p-density [52].
2.2 Mn Kβ X-ray Emission Spectroscopy
X-ray K emission lines are sensitive to the chemical environment of metals. K (1s core hole) emission spectra arise from the transition of outer shell electrons to a 1s hole, following the formation of the 1s core hole by X-ray absorption (Figure 3). Each emission peak contains information about the electronic structure of the specific metal/molecular orbitals through the interaction between these orbitals and 1s core holes. Spectral changes in the Kα and Kβ lines, for example, reflect the effective number of unpaired metal 3d electrons through the exchange interaction between the core hole (1s or 2p) and the net electron spin in the metal valence shell. The Kα line is shaped by the 2p spin-orbit splitting, while the overall spectral shape of the Kβ line is dominated by the (3p, 3d) exchange interaction. The details are reviewed by Glatzel and Bergmann [53]. In general, spectral changes for Kβ lines are more pronounced than for Kα, because the 3p and 3d orbitals interact more with each other than the 2p and 3d orbitals. We therefore used Kβ spectra to study the electronic structure of Mn model compounds and the OEC of PS II.
Fig.3.
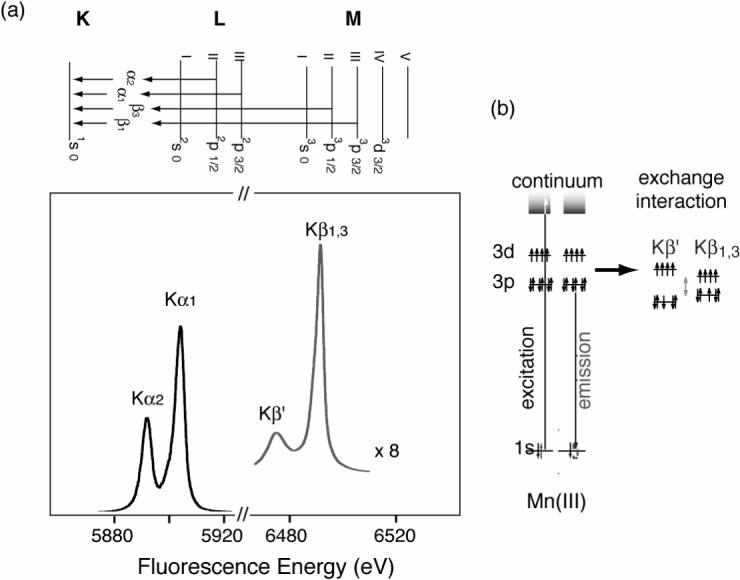
(a) X-ray K-emission from the 2p levels (2p3/2 and 2p1/2), known as Kα1 □ □ □ Kα2 emission, and from the 3p levels (3p3/2 and 3p1/2) known as Kβ1 and Kβ3 emission. The Kβ lines are approximately 1/8 as intense as the Kα lines. (b) A schematic representation of the electronic states and the transitions for Mn(III) Kβ XES. On the right is the exchange interaction between the 3p and 3d levels that gives rise to the Kβ1,3 and Kβ′ states.
Kβ XES monitors the X-ray emission from the relaxation of a 3p electron to a 1s hole (Fig. 3). For the two Kβ main lines, Kβ1 is the emission from 3p3/2 and Kβ3 is from 3p1/2. The Kβ′ feature is due to the (3p, 3d) exchange interaction. In a very simplified model, Kβ1,3 is a constructive and Kβ′ is a destructive spin exchange interaction between the unpaired 3p and 3d electrons in the final spin state. Separation of these two features is due to the exchange interaction of the unpaired 3d electrons with the 3p hole in the final state of the 3p -> 1s fluorescence transition. The magnitude of the exchange interaction depends on the number of unpaired electrons in the 3p and 3d orbitals. For example, Kβ′ and Kβ1,3 lines move toward each other with decreasing valence spin; i.e. smaller (3p, 3d) interaction. Therefore, the Kβ spectrum is sensitive to the exchange interaction between the core hole (3p) and the net electron spin in the metal 3d valence shell.
Figure 4 shows the Kβ1,3 emission difference spectra of spinach PS II in the S0 through the S3 states. We focused on the Kβ1,3 transition, because it is better resolved than the Kβ′ transition due to a difference in relaxation processes [23]. The derivative shape of the S0 to S1 and the S1 to S2 difference spectra show that the Kβ1,3 peak shifts to lower energy during these transitions. By contrast, the change is not apparent following the S2 to S3 transition, suggesting that the change in the metal charge density is much less than for the other transitions. Mn reduction occurs during the S3 to S0 state transition and the Kβ1,3 peak shifts to a higher energy; the difference spectrum reflects a return to the starting oxidation states.
Fig.4.
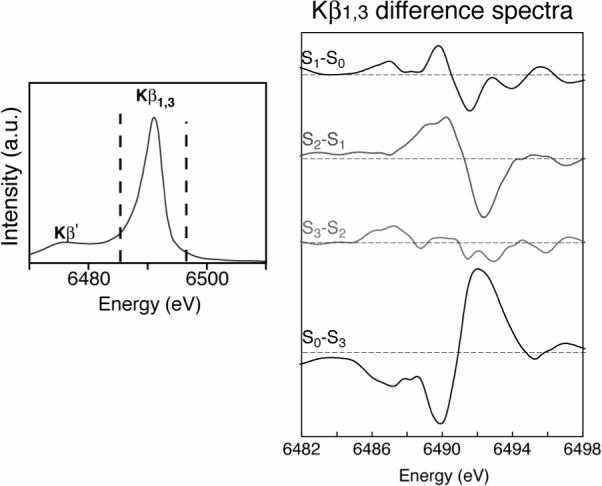
The Mn Kβ emission spectra of the spinach PS II. The right side shows the difference spectra between successive pairs of S-state spectra. The difference spectra between the S1 and S0, S2 and S1, and S0 and S3 states are derivative shaped, indicating that the spectral peaks shift in energy. The derivative shape for the S1 and S0, S2 and S1 is the reverse of that for the S0 and S3, reflecting Mn oxidation in the first two cases and reduction for the latter case. The difference spectrum between the S3 and S2 states shows the absence of such a derivative shape, indicating the similarity of the S2 and S3 state spectra and lack of a predominantly metal-centered oxidation. The figure was adapted from Messinger et al., 2001.
One point to consider is whether major structural changes in the S2 to S3 transition can cause the lack of an energy shift in the XES data. While the XANES (1s - 4p) spectra monitor the metal oxidation state through a 1s core hole shielding effect, the Mn Kβ emission spectroscopy provides a more sensitive measure of Mn oxidation-state changes through the (3p-3d) exchange interaction. The 3p orbitals have less overlap with the ligand orbitals compared to the 4p orbitals. Hence, Kβ XES is less likely to be influenced by changes in coordination environment and more indicative of the metal charge density [23,50,51].
2.3 Resonant Inelastic X-ray Scattering Spectroscopy (1s2p RIXS)
In a recent study, we applied Resonant Inelastic X-ray scattering spectroscopy (RIXS) to study the electronic structure of the Mn complex in PS II [54,55]. In the case of a 3d transition metal ion like Mn, the decay with the highest probability after 1s core hole creation by X-ray absorption is a radiative 2p to 1s transition (therefore, called 1s2p RIXS). This process can be viewed as an inelastic scattering of the incident photon at the Mn atom. In 1s2p Mn RIXS spectroscopy, both the incident X-ray energy (ψ) and the emission energy (f) are scanned using the beamline double-crystal monochromator (Si(111)) and the multi-crystal analyzer (Ge(333)) mounted on Rowland circles, respectively (Figure 5). The energy difference between the initial state to the intermediate state (ψ) is equivalent to the K-edge pre-edge transition, and the difference between the initial state and the final state (ψ-f) is comparable to L-edge spectroscopy. While the K-edge spectrum is a measure of the charge density of the metal, the L-edge spectrum has information also about the spin state of the metal, owing to the strong (2p, 3d) multiplet interaction. For this reason, RIXS is sensitive not only to the metal charge density, but also to the metal spin state. In general, L-edge spectroscopy is difficult for biological samples because of severe radiation damage caused by the higher X-ray absorption at lower energy; additionally, experiments need to be carried out under ultra-high vacuum conditions. In RIXS, L-edge-like spectra are obtained, but the excitation energy is the same as for K-edge spectroscopy. It also allows us to measure spectra at 10 K in the presence of an exchange gas atmosphere. Hence, RIXS spectroscopy can circumvent some difficulties in the L-edge spectroscopy, and the method is suitable for biological samples.
Fig.5.
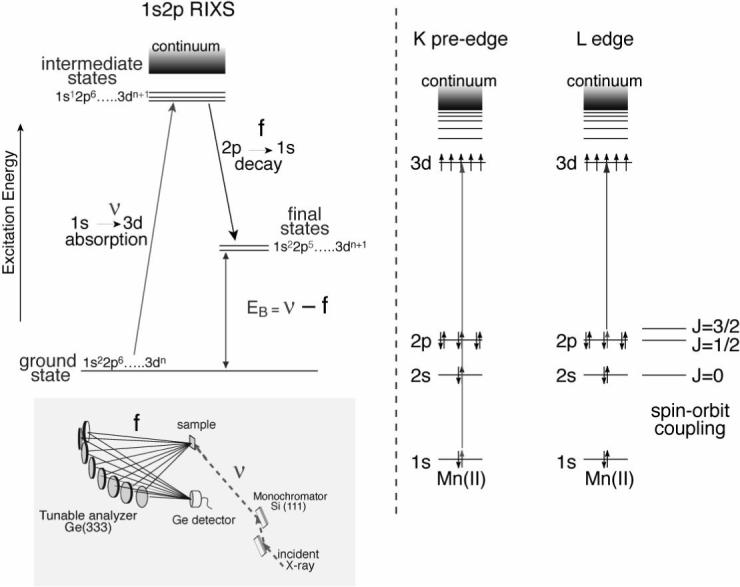
The energy level diagram for the K-pre edge (1s to 3d) and L-edge (2p to 3d) absorption spectra is shown on the right. On the left is the energy level diagram for the RIXS experiment. The excitation is from a 1s to 3d level, and the emission detected is from a 2p to 1s level. The difference in energy between the ground and final states is equivalent to those involved in L-edge absorption. Thus, by using K-edge X-ray energies one can collect L-edge-like (2p to 3d) spectra. The experimental setup used for the RIXS experiment is shown in the left bottom. In this two-dimensional spectroscopy, the excitation energy is scanned (1s to 3d and 1s to 4p) using the beamline monochromator, and the emission energy is scanned across the Kα lines (2p to 1s) using the crystal analyzer. Both the monochromator and the analyzer have ∼1 eV bandwidth.
Figure 6 shows RIXS contour plots of two series of Mn compounds (Mn oxides and Mn coordination complexes) with formal oxidation states of Mn(II), Mn(III) and Mn(IV) [54,55]. For a comparison, Mn K edge and pre-edge spectra of these oxides are also shown. The Mn coordination compounds are all six-coordinate, mostly with oxygen ligands (for chemical structures, see Scheme 1). Similar spectral features are observed between the Mn oxides and coordination compounds with same formal oxidation states despite the different ligand environment. The Mn(II) spectrum shows one broad peak centered at ψ ∼ 6540 eV. The spectrum is well-explained by the contribution of the crystal field splitting 10Dq between the t2g and eg orbitals (see ref. [54]). For Mn in higher oxidation state (Mn(III) and Mn(IV)), the electron (3d-3d) interaction becomes dominant. In Mn(III) compounds, for example, the two strong resonances observed in the contour plots (ψ = 6540 and 6543 eV) are due to the (3d, 3d) multiplet interactions (∼3 eV separation). The separation of two strong features is smaller in Mn coordination compounds (∼2 eV) due to the reduced magnitude of the (3d-3d) interaction; i.e. a more covalent electron configuration decreases the electron-electron interaction.
Fig. 6.
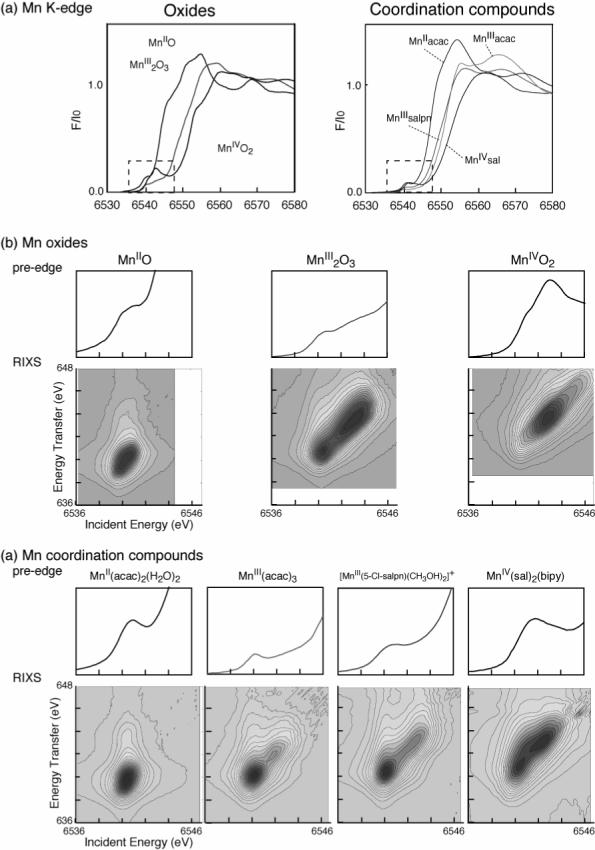
(a) Mn K-edge XANES of a set of Mn oxides and Mn coordination compounds. The chemical structures of the Mn coordination compounds are shown in Scheme 1. (b, c) Mn pre-edge spectra and RIXS spectra of Mn oxides and Mn coordination compounds. Abscissa is the excitation energy and ordinate is the energy transfer axis. The figure was adapted from ref. [54]. Contour lines show zones of equal signal amplitude.
Scheme 1.

Chemical structures of the Mn coordination compounds.
Figure 7 (a) shows the RIXS contours from the S1 and S2 states of PS II [54]. The S1 and S2 spectra show mixed features characteristic of Mn (III) and Mn (IV) compounds, having two main peaks. However, the first peak (∼ 6541 eV) appears broader than that for the model compounds, and there is no clear separation between the two peaks as in the coordination complexes, owing to the presence of 4 Mn in different oxidation states and different ligand environments.
Fig.7.
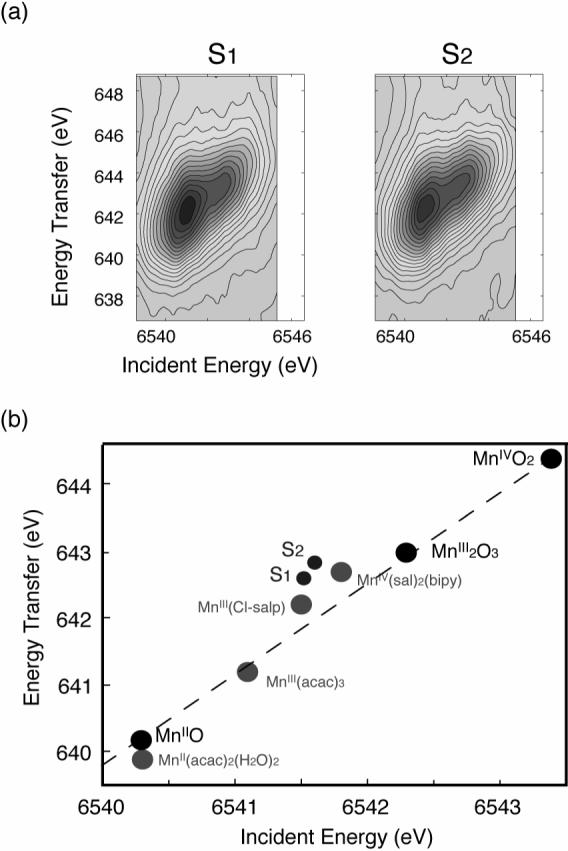
(a) Contour plots of the 1s2p3/2 RIXS spectra for the S1- and S2-states of PS II from spinach. (b) Plots of 1st moments of the RIXS spectra of Mn oxides, Mn coordination compounds and the S1- and S2-states of PS II. (See text for details.) 1st moments obtained by integrating across the incident energy direction and along the energy transfer direction are plotted against one another for each sample. The figure was adapted from ref. [54].
A 1st moment analysis was carried out for the RIXS spectra in order to define ‘the center of gravity’ energy along the incident energy and energy transfer axes. The 1st moments were calculated for each spectrum using the following equation,
| (eq. 1) |
where, Ej and Ij are the energy and fluorescence intensities of the jth data point. As observed in Mn oxides, the 1st moment along the incident energy increases as the Mn oxidation state increases, due to the decrease in charge density on the Mn (Fig. 7(b)). The interpretation of the 1st moment shift along the energy transfer direction is more complicated, because it is also affected by the final-state interaction. This arises from the (2p, 3d) electron-electron interaction, which is the exchange energy for electrons with parallel spins (see ref. [54] for the detail). For Mn oxides, the 1st moment shift follows the formal oxidation state in a linear manner, suggesting that the effective number of 3d electrons is directly correlated with the effective number of unpaired 3d electrons (spins) in these compounds.
For Mn coordination compounds, the 1st moment position shifts more toward lower energy compared to the Mn oxides, suggesting that Mn coordination compounds have much stronger covalency compared to the Mn oxides. The changes per oxidation state in the 1st moment positions are more pronounced between the Mn oxides than those between the Mn coordination compounds. It is worth noting that the two Mn (III) complexes do not have similar 1st moment positions. This can be explained by the presence of one counter ion in Mn(III)(Cl-Salp). The [Mn(III)(Cl-salp)(CH3OH)2] is positively charged. When the complex contains a counter ion, it behaves like a more ‘oxidized’ form than its formal oxidation state, and therefore, the energy difference between the Mn(III)(Cl-salp) and Mn(IV)(sal)2(bipy) is much smaller. This confirms that the 1st moment analysis reflects the effective number of electrons on Mn.
The 1st moment of the incident energy for PS II is lower than that for the Mn(IV) coordination complex and larger than or similar to those for the Mn(III) coordination complexes (Fig. 7(b)), which supports the mixed oxidation states of Mn (III) and Mn(IV) in the S1 and S2 states assigned earlier by the EPR and XANES studies. As observed in the PS II S1 and S2 contour plots, the spectral changes during the S1 to S2 transition are subtle owing to the oxidation state changes of one Mn out of four Mn. The 1st moment shift between S1 and S2 states is a factor of 7−8 smaller than those between Mn(III)(acac)3 and Mn(IV)(sal)2(bipy), and a factor of 3 smaller than those between Mn(III)(Cl-salp) and Mn(IV)(sal)2(bipy). However, the magnitude of the spectral change “per Mn ion” between Mn(III)(Cl-salp) and Mn(IV)(sal)2(bipy) is comparable to that between the S1 to S2 states.
The result shows that the electron that is extracted from the OEC in PS II between S1 and S2 is strongly delocalized. In other words, it suggests a strong covalency for the electronic configuration in the OEC. Data collection of the S0 and S3 RIXS spectra are currently in progress. The preliminary result indicates that the S0 spectrum has a weaker peak compared to the S1 state, having a more pronounced low energy component. In the S2 to S3 transition, peak intensity becomes stronger and the spectral feature is altered. The orbital population change per change in oxidation state between the S2 and S3 states is half as much as that between S0 and S1, or S1 and S2 transitions, indicating that the electron is removed from a more covalent configuration, in other words, even more delocalized orbital during this transition.
2.4 Oxidation state changes during the S-state transitions
In the above sections, we have summarized the experimental results from three X-ray spectroscopic techniques in order to address particularly the nature of oxidation state changes from S2 to S3. Each of these methods has provided support for the early proposal that Mn undergoes oxidation-state changes between S0 and S1 and between S1 and S2, but not appreciably between S2 and S3, with the note that these S-states were achieved by single-turnover flashes followed by cooling to low temperature. Additionally, the RIXS study showed that the electron that is extracted from the OEC in PS II between S1 and S2 is strongly delocalized, consistent with strong covalency for the electronic configuration in the OEC. This indicates that the use of “formal oxidation state” has limited merit, because electron and spin densities on Mn ion do not necessarily correspond to the formal oxidation state numbers.
It is also worth emphasizing that the original model put forth by Kok involving states S0 through S4 and returning to S0 following the release of O2 has been elaborated by much subsequent research. There are alternative forms of many of these S-states that result from the use of low-temperature cycling [56], chemical inhibition by NH3 [57] or F− [58], modification by NH2OH [40], and by the removal or replacement of essential catalytic components like Ca2+ [28] [34] or Cl− [59] or associated proteins [60]. More recently, time-resolved experiments have provided evidence for transient intermediates that have yet to be trapped and studied [61].
3. Structure of the OEC
X-ray diffraction crystallography and X-ray spectroscopy are two complementary approaches to detailed structure determination. The diffraction approach requires crystals of exceedingly high quality to provide high-resolution structures of complexes as large as PS II. At present, the best resolution is at 3.0 Å [62-65], which is far short of atomic resolution. Nevertheless, at 3.0 Å resolution it is possible to trace the electron density associated with the protein backbone, to identify the side chains of most amino acids especially when sequences are known independently, to resolve chlorophylls and lipids that are well-localized in the structure and to determine the location of heavy atoms such as Fe and Mn. However, in the case of a metal cluster like that in the OEC containing oxidized Mn, radiation damage owing to the high doses of X-ray radiation used in obtaining diffraction data results in chemical reduction of the Mn and disruption of the cluster [66]. The much lower doses used in X-ray spectroscopy completely avoid this problem; in fact, the X-ray spectra provide the best evidence of the occurrence of damage when higher doses are used. The evidence is in the appearance of the characteristic features of Mn(II) in the XANES region and in the loss of Peak II in the Mn-EXAFS. Studies of the extent of damage as a function of radiation exposure show that the Mn cluster has been disrupted during the course of data collection for all of the crystallographic studies prior to the time of this writing. These studies also showed that radiation damage could be decreased by holding the crystals at low temperature (10 K), by decreasing the exposure of each domain within the crystal to X-rays and by a judicious choice of the X-ray energies used to determine the diffraction.
EXAFS spectroscopy has the advantage of high precision and, potentially, high accuracy. Methods used prior to about 2003 were capable of determination of Mn-Mn distances to within 0.14 Å. Complications arise from situations, as in PS II, where several Mn-Mn vectors of roughly the same length are present in the Mn4Ca cluster. The EXAFS spectra reflect the superposition of contributions from all of the Mn atoms present; these are not separated spatially, as in an electron-density map. For isotropic samples prepared in solution or in a pellet obtained through centrifugation, each Mn-Mn vector in a narrow distance range contributes equally to the EXAFS spectra owing to their random orientations. In samples ordered by painting membrane fragments on a flat substrate or in single crystals, the different vectors of similar length can, in principle, be better distinguished owing to their different projections on the electric vector of the polarized X-rays as the orientation of the sample is progressively rotated. Changes in the spectra accompanying changes in sample orientation are known as X-ray dichroism. Use of this approach can allow the extraction of the precise distance and orientation of individual vectors in a structure where they cannot be resolved from measurements on isotropic samples. As we shall see, improvements in distance resolution and the application of X-ray dichroism have led to considerable refinement of our knowledge about the structure and function of the Mn4Ca cluster involved in photosynthetic water oxidation.
3.1 High-resolution Mn-EXAFS
High-resolution Mn EXAFS has considerably improved the resolution of overlapping features in the OEC. During the first 25 years of research in this area, resolution was limited by truncation of the range of energies that could be used above the Mn K-edge. Contributions from Fe XAS, which occur at somewhat higher energies in the X-ray region, overwhelm the underlying EXAFS from Mn (Figure 8). Fe is both intrinsic and adventitious in PS II preparations, and is unavoidable in active samples. Because the precision of Mn EXAFS measurements depends directly on the extent of the range of energies scanned beyond the Mn absorption edge, the presence of the Fe peak was a significant obstacle. Recent instrumentation improvements, especially the use of a multicrystal monochromator [67], permits the contribution of Fe X-ray fluorescence to be largely rejected from the Mn signals. PS II samples measured using the range-extended Mn-EXAFS exhibit resolution improved from 0.14 to 0.1 Å, and accuracy, 0.02 Å [7] [68]. Peak II was best fit with two shells and with a 2:1 intensity ratio at 2.71 and 2.81 Å, respectively, for the S1 state and 2.73 and 2.82 Å for the S2 state. Although previous studies had provided evidence for the presence of three Mn-Mn vectors (at two different distances) in the S0-state [32] and at least two different distances in the S3-state [20], the results of the extended-range, high-resolution measurements were the first to provide evidence for similar heterogeneity in the S1- and S2-states. We conclude that there are three Mn-Mn vectors contributing to Peak II in the EXAFS of states S0, S1 and S2, and the earlier results using conventional EXAFS are consistent with that conclusion for the S3-state as well. It is now also clear from these experiments that small, but distinct, structural changes occur between one S-state and the next; these changes are least pronounced between the S1- and S2 states.
Fig.8.
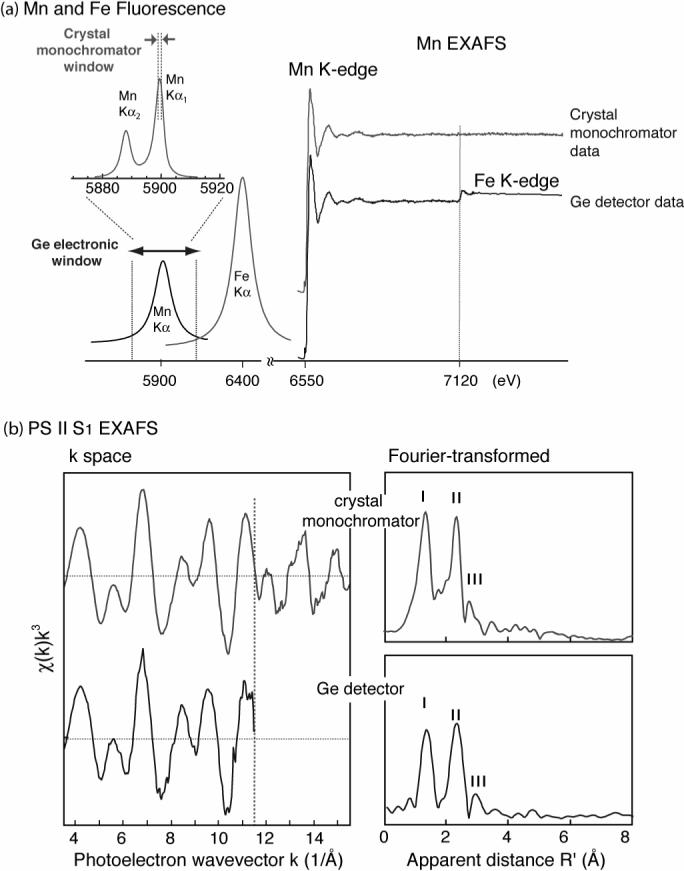
Extended-range EXAFS of spinach PS II. (a) left: A schematic representation of the Mn and Fe Kα and Kβ fluorescence spectra. The electronic window of the Ge-detector has a 150−200eV resolution compared to ∼1 eV of the multi-crystal monochromator used in this study. Right: Comparison of the PS II Mn K-edge EXAFS spectrum from the S1 state sample obtained with a traditional energy discriminating Ge-detector, with that collected using the high-resolution crystal monochromator. Fe which is obligatory in PS II does not pose a problem with the high resolution detector (the Fe edge is marked by a dotted line). (b) Left: k3-weighted Mn EXAFS spectra from PS II samples in the S1 state obtained with a conventional EXAFS detection (bottom) and with high-resolution spectrometer (extended-range EXAFS, top). Dashed line at k=11.5 Å−1 denotes the spectral limit of conventional EXAFS experiment imposed by the presence of the Fe K-edge. Right: Comparison of FTs of the Mn EXAFS spectra in conventional EXAFS (bottom) data up to Fe edge 11.5 Å−1, and FT of the Mn K-edge range extended EXAFS spectrum to 15.5 Å−1 (top) in the S1 state. The figure was adapted from ref. [7].
3.2 Polarized EXAFS (dichroism) of oriented PS II
Synchrotron sources provide polarized X-ray beams with the electric vector parallel to the plane of the synchrotron ring. EXAFS dichroism is another powerful tool for selecting among otherwise acceptable models of the OEC. To enable these measurements samples must exhibit a net orientation in one or more directions. Both oriented membranes of PS II (obtained from spinach chloroplasts) and single crystals of PS II (from thermophilic cyanobacteria) have been studied using this approach.
3.2.1 Oriented membranes from spinach chloroplast
The earlier reports of dichroism came from studies of oriented membranes of PS II from spinach chloroplasts. The relatively flat membrane fragments can be ordered by a series of paint and dry operations using a sample previously pelleted by centrifugation. While the membranes in each sample are not perfectly parallel, the relatively small order parameter, which can be estimated from the influence of sample orientation on EPR spectra, means that the normals to the membrane regions fall within an average 15−20° to the normal of the underlying surface (Figure 9(a)). Samples prepared in this way exhibit pronounced XAS dichroism both in the near-edge region, reflecting the orientation of transition moments to bound excited electronic states, and in the EXAFS region, where the intensity of scattering depends on the orientation of individual scattering vectors relative to the direction of the electric vector of the incident polarized X-rays [69] (Fig. 9(b)). Dichroism in the Mn-XANES region exhibits considerable structural detail; however, this has defied analysis using available theoretical tools owing to the superposition of contributions from four different Mn atoms in the cluster. The polarized Mn-EXAFS has proved to be more tractable, especially for the contributions to Peaks II and III. The initial studies which were made on the S1 and S2 states dealt with the average orientation of vectors contributing to these two peaks, although small shifts in the peak energies as a function of sample orientation were held to be indicative of underlying heterogeneity of both vector length and orientation [70]. The orientation of the vectors involving Ca-Mn interactions was investigated using samples where Ca was replaced by Sr and polarized Sr-EXAFS was measured for oriented PS II samples. The average orientation of the Sr-Mn interactions at 3.5 Å was found to be close to the membrane normal (within 23°) [71] (Fig. 9(c), see also 3.2.3).
Fig.9.
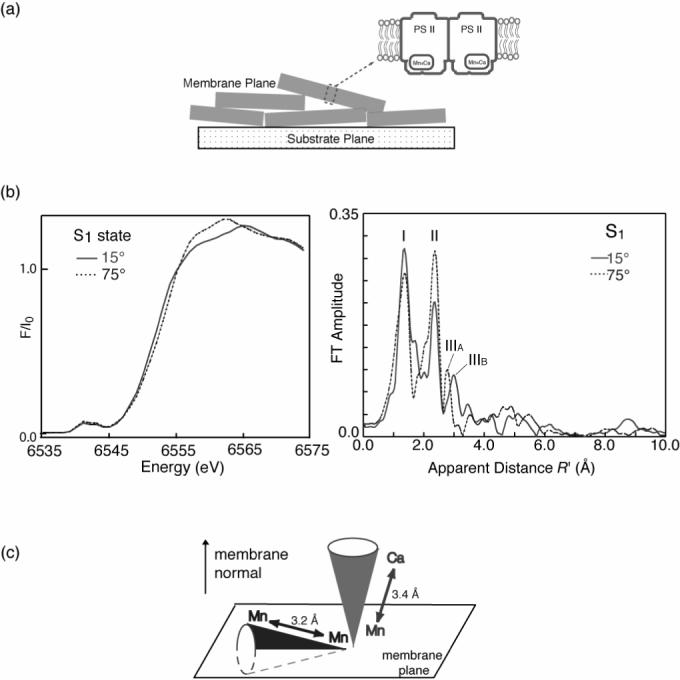
(a) Oriented thylakoid membrane fragments of PS II. Positioning of a PS II dimmer is indicated schematically. (b) XANES (left) and Fourier transform of the EXAFS spectra (right) from oriented PS II membranes in the S1 state at orientations of 15° (solid line) and 75° (dashed line) of the membrane normal with respect to the x-ray e-vector. (c) The orientation of the average Mn-Ca (3.4 Å) and Mn-Mn (∼3.2 Å) vectors relative to the membrane normal. The figure was adapted from ref. [27].
Subsequent range-extended Mn-EXAFS measurements on oriented PS II membranes from spinach in the S1-state showed that the three Mn-Mn vectors contributing to Peak II, two at ∼2.7 Å and one at ∼2.8 Å, exhibit an average orientation of ∼60° to the membrane normal [27]. The best-fit distances were within experimental uncertainty of those reported previously using the high-resolution method on isotropic S1-state samples of PS II isolated from spinach [7]. Analysis of the dichroism data for the oriented PS II membranes was not able to resolve a difference, outside experimental error, between the average orientation of the two Mn-Mn vectors (61 ± 5°) at ∼2.7 Å and the Mn-Mn vector (64 ± 10°) at 2.8 Å. Nevertheless, this new information is very useful in limiting the range of likely models for the Mn cluster in PS II from spinach.
Further analysis of the high-resolution EXAFS of oriented PS II membranes shows that Peak III exhibits contributions from interactions at ∼3.2 Å, attributed to Mn-Mn and oriented near the membrane plane, and at ∼3.4 Å, attributed to Mn-Ca and oriented close to the membrane normal. The assignment of the ∼3.2 Å component to Mn-Mn is consistent with the earlier result showing a residual component of Peak III that was present in PS II samples from which Ca had been removed, but which could be reactivated by subsequent reconstitution of Ca [34]. The assignment of the ∼3.4 Å component to Mn-Ca and its orientation are consistent with the results of Ca-EXAFS [29]. These results relevant to the modeling of Ca(Sr) in the Mn4Ca(Sr) cluster will be discussed separately in 3.2.3.
3.2.2 Single-crystals of PS II from cyanobacteria
Single crystals of PS II from cyanobacteria have been used extensively for X-ray diffraction analysis [62-65,72]. To date, the resolution is limited to 3.0 Å; furthermore, the Mn cluster has been subjected to radiation damage of unknown extent during data collection. XAS studies of PS II at similar high dosages typical of X-ray diffraction exposures results in chemical reduction of the manganese to Mn2+ and disruption of the cluster [33,66,73]. The disruption may not have released the Mn and Ca into the general surroundings. However, it is likely that there is some localized rearrangement of ligands proximal to the cluster. Because XAS is carried out using radiation dosages only 1% as large, negligible radiation damage is reflected in the spectroscopic measurements.
In an ideal situation, polarized X-ray spectroscopy provides orientation and distance information for each vector in the Mn4Ca cluster for metal atoms within about 4.5 Å of one another. The difficulty of analysis of the spectra depends critically on the space group and the number of monomer molecules per unit cell. A nearly ideal situation exists for the synthetic bi-nuclear Mn2(III,IV) complexes with phenanthroline or bipyridine terminal ligands and which crystallize in an orthorhombic space group [74] (Figure 10). For both of these molecules the molecular symmetry axes are nearly aligned with the crystallographic axes. In a situation like this the Mn-Mn vector, which is nearly parallel to the crystallographic c-axis, will exhibit maximally to the EXAFS spectrum when the crystal is aligned such that the c-axis is parallel to the electric vector of the polarized X-rays. It will contribute little to the EXAFS when the crystal is oriented such that the a- or b-axis is parallel to the E-vector of the X-rays. The orientation of the Mn-Mn vector can thus be determined as reliably as by X-ray crystallography, and the Mn-Mn distance can be determined much more accurately by EXAFS than from analysis of the X-ray diffraction.
Fig.10.
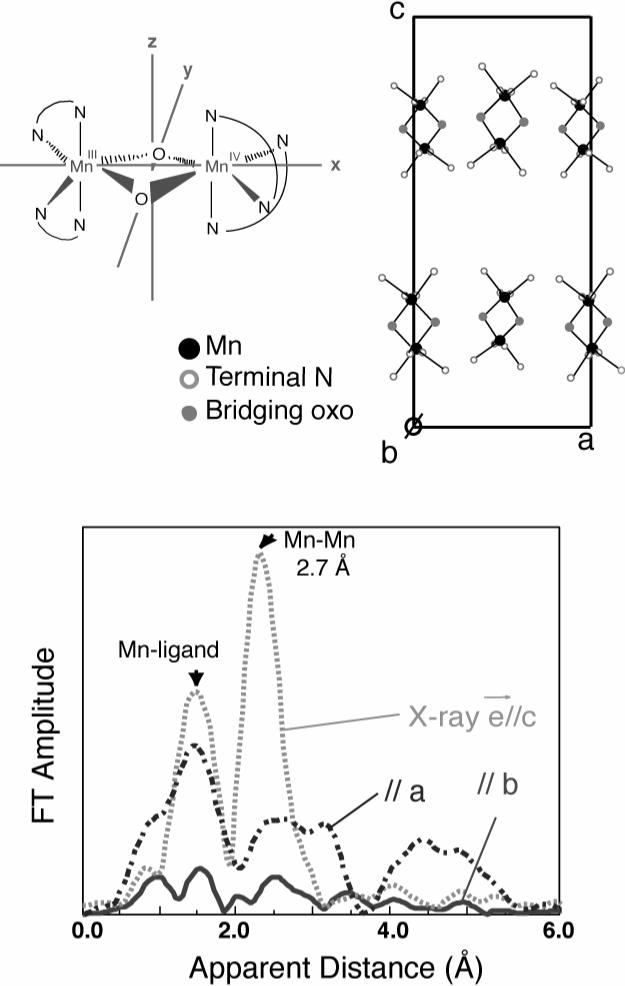
Single crystal Mn EXAFS of [Mn2(III,IV)O2(phen)4](PF6)3CH3CN, where phen=1,10-phenanthroline. The crystal structure is shown in top right [74]. Strong dichroism is seen in both the Mn-ligand and Mn-Mn peaks.
Collaboration between spectroscopists and crystallographers has resulted in polarized EXAFS measurements of oriented single-crystals of PS II from the cyanobacterium Thermosynechococcus elongatus [75]. Analysis of the spectra is complicated by the fact that PS II in all of these crystals occurs as a dimer, with the two monomers related by a non-crystallographic C2 rotation axis. PS II crystallizes in the orthorhombic space group P212121, with four symmetry-related dimers per unit cell. The presence of eight monomer PS II per unit cell and each in a unique orientation, provided a formidable challenge to analysis of the dichroic spectra. It was necessary first to record polarized X-ray spectra with a crystal aligned, in turn, along each of the three crystallographic axes. (Any small misalignment was determined by simultaneously measuring the diffraction pattern.) The resulting spectra represented the convolution of the contributions of the different absorber (Mn) – scattererers (O/N, Mn, or Ca) vectors from each of the monomers onto the E-vector direction. In such a complex crystal, none of these projections is close to zero when summed for the eight monomers. Nevertheless, the relative magnitudes of the Fourier components of the EXAFS for a particular vector distance are different along the different axes, which is the signature of the presence of dichroism. This allows for the deconvolution of the spectra. The first stage of deconvolution provides spectra that reflect a first approximation to the polarized spectra along each of the three crystallographic axes. These are then used to correct the measured spectra for any small misalignment of individual crystals. This is important because measurements along any crystal axis require summing the data from several crystals. The correction method allows the corrected data from the different crystals to be combined to improve the signal-to-noise at the same time as minimizing any consequences of radiation damage. Iterations of this procedure produce X-ray spectra polarized along each of the crystal axes (Figure 11). The next step in the analysis is to determine the contribution of each of the eight monomers in the unit cell. This was accomplished by modeling the cluster with a collection of Mn-Mn and Mn-Ca vectors of different lengths and orientations, and simulating the experimental spectra polarized along the three crystal axes. This simulation was carried out for the three orthogonal polarized spectra (parallel to a, b, and c axes) until the differences between the simulated and experimental spectra were minimized. This approach has provided the best filter yet for selecting acceptable candidates for the intact Mn4Ca cluster geometry in the S1 state. Three models obtained from the single crystal EXAFS study are shown in Figure 12.
Fig.11.
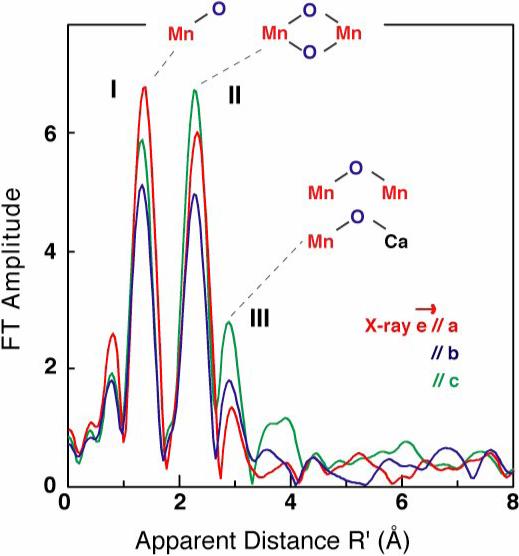
Single crystal Mn EXAFS of Synechococcus elongatus PS II in the S1 state [66]. Note that the ordering of intensities measured along each of the crystal axes is different for FT peaks I, II, and III.
Fig.12.
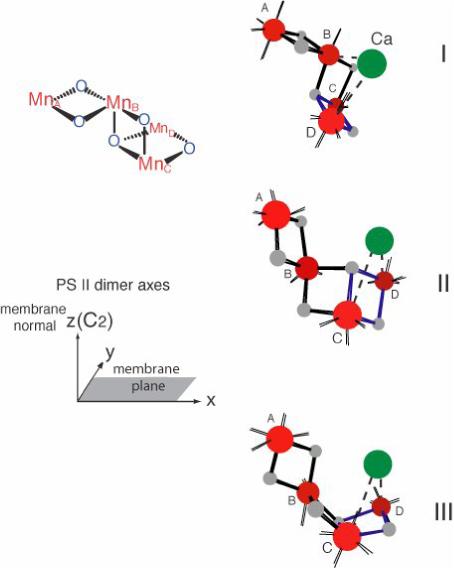
Models of the Mn4CaOn cluster of the OEC deduced from the single crystal EXAFS (Fig.12) in the orientation in which they should be placed in the PS II membrane according to the axis system shown at lower left [66]. Three models are from the common Mn4 motif shown at upper left.
At present, however, it is not possible to choose among the three models on the basis of the polarized EXAFS data of single crystals. In addition, each of these structural models can have four symmetry-related orientations in the membrane originating from the cos2θ dependence of the EXAFS signal and the non-crystallographic C2-symmetry of the monomers in the PSII dimer. In order to discriminate among these models or symmetry-related orientations, the ligand environments reported by the crystallography were used (see Section 4 for a detail).
3.2.3 Ca- or Sr-EXAFS
Ca or Sr EXAFS has helped to elucidate the involvement of Ca, or Sr substituted for Ca, in the OEC metal cluster. Following substitution of Ca by Sr, no significant changes were observed in the Mn XANES region, confirming the integrity of the Mn cluster; however, a significant increase in the intensity of Peak III in the FT of the EXAFS at a distance somewhat greater than 3 Å provided evidence that Ca (Sr) is integral to the cluster [28]. Depleting Ca from intact PS II, which results in a decrease in the EXAFS amplitude at this distance, provided confirmation of this conclusion [76] as well as evidence that scattering by Mn-Mn interactions also contributes to Peak III [34]. Nevertheless, the close association of Ca (Sr) with the Mn cluster was disputed at the time by similar Mn EXAFS studies involving Ca replacement by heavier atoms [77].
This issue was soon resolved by means of EXAFS experiments carried out at the Sr K-edge. For samples where Ca is replaced by Sr, a strong feature is present in the Sr-EXAFS in the 3.5 Å region and this peak disappears when Mn is removed by treatment with NH2OH [78]. A similar experiment with similar results was done using Ca K-edge radiation on an intact PS II preparation, providing further evidence for the involvement of Ca in the metal cluster [29]. The orientation of the Sr-Mn vector(s) was investigated by polarized EXAFS of Sr-reconstituted PS II from spinach. The peak at 3.5 Å owing to these interactions is strongly dichroic and the vectors are oriented nearly parallel (within 23°) to the membrane normal [71] (Figure 14). Extended-range Mn EXAFS of oriented PS II membranes provide high resolution data that confirm the orientation of the average Mn-Ca vector(s) and identify them with a feature at 3.4 Å. The component at 3.2 Å, attributable to a long Mn-Mn interaction, is inclined at greater than 70° to the membrane normal and, thus, much closer to the membrane plane [27]. This study also investigated angles associated with three Mn-Mn vectors contributing to Peak II; both the average of two at 2.72 Å and the one at 2.82 Å are between 60° and 70° to the membrane normal. This is in general agreement with previous studies using conventional Mn EXAFS on oriented PS II [69].
Fig.14.
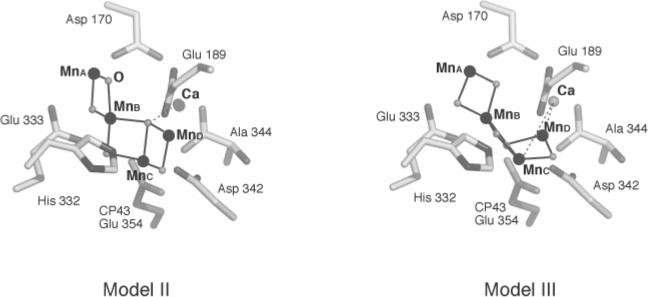
Model II and III of ref. [75] in a putative ligand environment.
4. Modeling the arrangement of 4Mn and Ca in the OEC
Modeling of the arrangement of 4Mn and 1Ca in the OEC is significantly aided by the recently resolved vector numbers, lengths and orientations. Single crystal EXAFS study suggests three possible structural models in the membrane (Fig.12). As described in 3.2.2, however, single crystal study cannot further discriminate among these three models, or among the four symmetry-related structures of each model due to the dimeric nature of PS II molecules and also the cos2τ dependence of EXAFS. To discriminate among these possibilities, we have used putative ligand environments available from the published crystallography to see which model and/or symmetry related structure fits better in the ligand environment. Among the four symmetry-related orientations, Figure 14 shows the best-fit orientation for Model II and Model III, both of which fit slightly better than Model I. However, we need to emphasize that this last filtering process is based on the assumption that the ligand environment is not significantly disturbed by the radiation damage during data collection for the published crystallographic studies [62-64] [65]. Therefore, the ligand environment assignment should be remained tentative and needs to be discussed with the results from IR and EPR spectroscopy [79].
The polarized EXAFS of oriented single crystals is not compatible with the cluster models proposed by the authors on the basis of the 3.0 or 3.5 Å X-ray diffraction analyses. In the single-crystal EXAFS models (Fig. 12), Mn4 (A) is di-μ-oxo linked to Mn3 (B), rather than mono-oxo linked (A in the models of Yano et al. [75]). In addition, the Ca is linked to only 2 of the remaining 3 Mn atoms.
The oriented membrane study with extended-range EXAFS may give us criteria for filtering the proposed structures based on the orientation of Mn-Mn vectors. Models II and III in Fig. 13 are similar to the angle criteria of Mn-Mn vectors obtained from the oriented membrane study of spinach thylakoid membranes (Fig. 9(b)) [27], with the 60° orientation of the 2.8 Å Mn-Mn vector and ∼80° orientation of the 3.2 Å Mn-Mn vector relative to the membrane normal, except that the averaged orientation of the 2.7 Å Mn-Mn vectors to the membrane normal is ∼40° compared with ∼60°. On the other hand, Model I from the single crystal EXAFS study [75] has all three (averaged 2.7, 2.8, and 3.2 Å) Mn-Mn vectors oriented differently relative to the membrane normal compared with those determined in the oriented membrane study, and is therefore less favored. However, the difference in orientation of some vectors with respect to the membrane normal could be due to inherent errors in the determination of angles in the method. Alternatively, this variation in orientation could reflect differences in PS II between thermophilic cyanobacteria and spinach. Also note that analysis of the single crystal EXAFS data involves considerations of the protein unit cell symmetry, while oriented membranes have a unique axis along the membrane normal with rotational uncertainty in the plane of the membrane.
Fig.13.
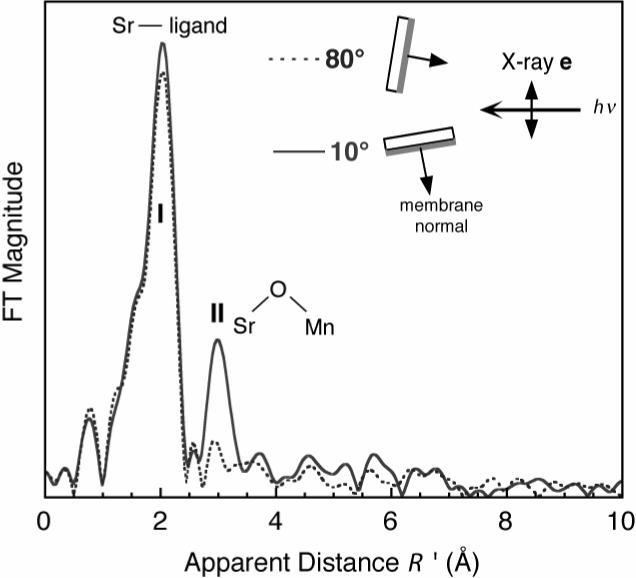
Fourier transform of the EXAFS spectra from oriented Sr PS II membranes from spinach in the S1 state at orientations of 10° (solid line) and 80° (dashed line) of the membrane normal with respect to the X-ray e-vector. The figure was adapted from ref.[71].
Eventually, an important issue concerns the significance of which organism is used to prepare PS II samples. As better data have become available, it has proved possible to make careful comparison between PS II obtained from higher plant chloroplasts or from cyanobacteria, for example. To date, any differences reported between XAS results from PS II from these different sources are within the experimental uncertainties of the methodology used [80,81]. Because there are small differences in properties observed by EPR, for example, and in the protein subunit composition and even amino acid sequences of particular reaction center components, it would not be surprising to find measurable differences in the XAS. This will be an interesting area for future investigation using the best technology.
Quantum chemical calculations using density functional theory (DFT) have been used both to optimize the structure of the cluster geometry and transition state energies associated with O-O bond formation in the S4 state prior to O2 release. Conclusions reached earlier are reviewed and new results are presented by Siegbahn [47]. Two proposals for the precursor to O-O bond formation were examined. A clear conclusion is that the S4 state is much more likely to involve an oxo radical than a MnV state. With regard to the structure, the calculations used the CaMn3 cluster plus a dangling Mn taken from the 3.5 Å diffraction analyses as a starting point. Although the geometry was somewhat optimized from this beginning, the proximity of Mn4 to Ca was retained in the refined structure, and this proximity played a significant role in the proposal for O-O bond formation in S4.
5. Chloride ion
Chloride ion is an additional component that is essential for water-splitting activity of PS II. Br− restores activity to preparations that have first been made Cl−-free. As noted previously, F− is an inhibitor. The first comparison of Cl− versus Br− activated PS II was carried out on PS II particles from the cyanobacterium Synechococcus sp. No significant difference was seen in the Mn-EXAFS which might indicate ligation of a halide to Mn [59]. Similar studies using F− substitution in spinach PS II produced at most a marginal difference from those using active Cl—containing preparations, and no firm conclusion could be drawn from the results [82]. Recently, a study of Br−–activated PS II using Br K-edge EXAFS led to the conclusion that Br− does not bind to the Mn4Ca complex in the S1 state [83].
6. Time-resolved XAS
Time-resolved XAS using rapid scan techniques and monitoring samples held at room temperature were used initially to follow the time-course of radiation damage over the course of several hundred seconds. [84]Subsequently, with improved time resolution, XAS changes at the Mn absorption edge were used to track changes with a half-time of 1.1 ms following the 3rd flash of a sequence applied to a dark-adapted sample. [85] With still better time resolution, an induction of ∼200 μs following the third flash was interpreted to result from an intermediate component between the S3 and the S0 states. [61] Time-resolved XAS is reviewed in more detail in Chapter 4 of this volume.
7. Conclusion
In the absence of high-resolution X-ray diffraction measurements on crystals of PS II that retains intact Mn4Ca clusters, the results of X-ray spectroscopy currently provide the most reliable and precise information concerning the structure of the cluster and changes that occur during the steps in water oxidation. In combination with results from EPR and FTIR, these findings support a mechanism in which a manganese atom in the cluster effectively loses an electron during each of the S0 -> S1 and S1 -> S2 transitions, but not during S2 -> S3. Mn-EXAFS shows distinct structural changes between S0 and S1, but changes that are more subtle between S1 and S2. Between S2 and S3 there are further distinct structural changes. Recently, time-resolved XAS has provided some of the first experimental data reflecting the final steps in water oxidation accompanying the transition from S3 that returns the enzyme to the S0 state. It is reasonable to expect that further improvements in XAS technology and the samples available for study will enhance the level of our understanding of this important process in solar energy conversion by photosynthesis.
Acknowledgements
The research from our group presented in this review was supported by the NIH grant (GM 55302), and the DOE, Director, Office of Science, Office of Basic Energy Sciences, Chemical Sciences, Geosciences, and Biosciences Division, under Contract DE-AC02-05CH11231. Synchrotron radiation facilities were provided by SSRL, APS and ALS, which are supported by DOE, Office of Basic Energy Sciences. The SSRL Biotechnology Program is supported by NIH, National Center of Research Resources, Biomedical Technology Program, and by DOE, Office of Health and Environmental Research. BioCAT at the APS is a NIH-supported Research Center RR-08630. We thank Drs. Johannes Messinger, Uwe Bergmann, Pieter Glatzel, Steve P. Cramer, Yulia Pushkar, Jan Kern, Athina Zouni, Matthew Latimer, Jacek Biesiadka, Bernard Loll, and Wolfgang Saenger for many helpful discussions.
Footnotes
Publisher's Disclaimer: This is a PDF file of an unedited manuscript that has been accepted for publication. As a service to our customers we are providing this early version of the manuscript. The manuscript will undergo copyediting, typesetting, and review of the resulting proof before it is published in its final citable form. Please note that during the production process errors may be discovered which could affect the content, and all legal disclaimers that apply to the journal pertain.
References
- 1.Yachandra VK, Sauer K, Klein MP. Chem. Rev. 1996;96:2927. doi: 10.1021/cr950052k. [DOI] [PubMed] [Google Scholar]
- 2.Kuzek D, Pace RJ. Biochim. Biophys. Acta. 2001;1503:123. doi: 10.1016/s0005-2728(00)00218-8. [DOI] [PubMed] [Google Scholar]
- 3.Penner-Hahn JE. Struct. Bond. 1998;90:1. [Google Scholar]
- 4.Sauer K, Yachandra VK. Biochim. Biophys. Acta. 2004;1655:140. doi: 10.1016/j.bbabio.2003.07.004. [DOI] [PMC free article] [PubMed] [Google Scholar]
- 5.Yachandra VK. In: Photosystem II: The Light-Driven Water:Plastoquinone Oxidoreductase. Wydrzynski T, Satoh S, editors. Vol. 22. Springer; Dordrecht: 2005. p. 235. [Google Scholar]
- 6.Sauer K, Yano J, Yachandra VK. Photosynth. Res. 2005;85:73. doi: 10.1007/s11120-005-0638-9. [DOI] [PMC free article] [PubMed] [Google Scholar]
- 7.Yano J, Pushkar Y, Glatzel P, Lewis A, Sauer K, Messinger J, Bergmann U, Yachandra VK. J. Am. Chem. Soc. 2005;127:14974. doi: 10.1021/ja054873a. [DOI] [PMC free article] [PubMed] [Google Scholar]
- 8.Mukhopadhyay S, Mandal SK, Bhaduri S, Armstrong WH. Chem. Rev. 2004;104:3981. doi: 10.1021/cr0206014. [DOI] [PubMed] [Google Scholar]
- 9.Cinco RM, Rompel A, Visser H, Aromi G, Christou G, Sauer K, Klein MP, Yachandra VK. Inorg. Chem. 1999;38:5988. doi: 10.1021/ic991003j. [DOI] [PMC free article] [PubMed] [Google Scholar]
- 10.Pizarro SA, Glatzel P, Visser H, Robblee JH, Christou G, Bergmann U, Yachandra VK. Phys. Chem. Chem. Phys. 2004;6:4864. doi: 10.1039/B407513G. [DOI] [PMC free article] [PubMed] [Google Scholar]
- 11.Rehr JJ, Albers RC. Rev. Mod. Phys. 2000;72:621. [Google Scholar]
- 12.Jaklevic J, Kirby JA, Klein MP, Robertson AS, Brown GS, Eisenberger P. Solid State Commun. 1977;23:679. [Google Scholar]
- 13.Kirby JA, Robertson AS, Smith JP, Thompson AC, Cooper SR, Klein MP. J. Am. Chem. Soc. 1981;103:5529. [Google Scholar]
- 14.Kirby JA, Goodin DB, Wydrzynski T, Robertson AS, Klein MP. J. Am. Chem. Soc. 1981;103:5537. [Google Scholar]
- 15.Goodin DB, Yachandra VK, Britt RD, Sauer K, Klein MP. Biochim. Biophys. Acta. 1984;767:209. [Google Scholar]
- 16.Cole J, Sauer K. Biochim. Biophys. Acta. 1987;891:40. [Google Scholar]
- 17.Goodin DB, Yachandra VK, Guiles R, Britt RD, McDermott A, Sauer K, Klein MP. Springer Proc. Phys. 1984;2:130. [Google Scholar]
- 18.Yachandra VK, Guiles RD, McDermott A, Britt RD, Cole J, Dexheimer SL, Sauer K, Klein MP. J. Phys. Colloq. 1986;2:1121. [Google Scholar]
- 19.Yachandra VK, Guiles RD, McDermott AE, Cole JL, DeRose VJ, Zimmermann J-L, Sauer K, Klein MP. Physica B. 1989;158:78. [Google Scholar]
- 20.Guiles RD, Yachandra VK, McDermott AE, Cole JL, Dexheimer SL, Britt RD, Sauer K, Klein MP. Biochem. 1990;29:486. doi: 10.1021/bi00454a024. [DOI] [PubMed] [Google Scholar]
- 21.Roelofs TA, Liang W, Latimer MJ, Cinco RM, Rompel A, Andrews JC, Sauer K, Yachandra VK, Klein M. Proc. Natl. Acad. Sci. U. S. A. 1996;93:3335. doi: 10.1073/pnas.93.8.3335. [DOI] [PMC free article] [PubMed] [Google Scholar]
- 22.Liang W, Roelofs TA, Cinco RM, Rompel A, Latimer MJ, Yu WO, Sauer K, Klein MP, Yachandra VK. J. Am. Chem. Soc. 2000;122:3399. doi: 10.1021/ja992501u. [DOI] [PMC free article] [PubMed] [Google Scholar]
- 23.Messinger J, Robblee JH, Bergmann U, Fernandez C, Glatzel P, Visser H, Cinco RM, McFarlane KL, Bellacchio E, Pizarro SA, Cramer SP, Sauer K, Klein MP, Yachandra VK. J. Am. Chem. Soc. 2001;123:7804. doi: 10.1021/ja004307+. [DOI] [PMC free article] [PubMed] [Google Scholar]
- 24.Yachandra VK, Guiles RD, McDermott A, Britt RD, Dexheimer SL, Sauer K, Klein MP. Biochim. Biophys. Acta. 1986;850:324. doi: 10.1016/0005-2728(87)90169-1. [DOI] [PubMed] [Google Scholar]
- 25.Yachandra VK, Guiles RD, McDermott AE, Cole JL, Britt RD, Dexheimer SL, Sauer K, Klein MP. Biochemistry. 1987;26:5974. doi: 10.1021/bi00393a005. [DOI] [PubMed] [Google Scholar]
- 26.Guiles RD, Zimmermann J-L, McDermott AE, Yachandra VK, Cole JL, Dexheimer SL, Britt RD, Wieghardt K, Bossek U, Sauer K, Klein MP. Biochemistry. 1990;29:471. doi: 10.1021/bi00454a023. [DOI] [PubMed] [Google Scholar]
- 27.Pushkar Y, Yano J, Glatzel P, Messinger J, Lewis A, Sauer K, Bergmann U, Yachandra VK. J. Biol. Chem. 2007;282:7198. doi: 10.1074/jbc.M610505200. [DOI] [PMC free article] [PubMed] [Google Scholar]
- 28.Latimer MJ, DeRose VJ, Mukerji I, Yachandra VK, Sauer K, Klein MP. Biochemistry. 1995;34:10898. doi: 10.1021/bi00034a024. [DOI] [PubMed] [Google Scholar]
- 29.Cinco RM, Holman KLM, Robblee JH, Yano J, Pizarro SA, Bellacchio E, Sauer K, Yachandra VK. Biochemistry. 2002;41:12928. doi: 10.1021/bi026569p. [DOI] [PMC free article] [PubMed] [Google Scholar]
- 30.Brudvig GW, Crabtree RH. Proc. Natl. Acad. Sci. U. S. A. 1986;83:4586. doi: 10.1073/pnas.83.13.4586. [DOI] [PMC free article] [PubMed] [Google Scholar]
- 31. Foornote_CCR_i, In.
- 32.Robblee JH, Messinger J, Cinco RM, McFarlane KL, Fernandez C, Pizarro SA, Sauer K, Yachandra VK. J. Am. Chem. Soc. 2002;124:7459. doi: 10.1021/ja011621a. [DOI] [PMC free article] [PubMed] [Google Scholar]
- 33.Dau H, Liebisch P, Haumann M. Phys. Chem. Chem. Phys. 2004;6:4781. [Google Scholar]
- 34.Latimer MJ, DeRose VJ, Yachandra VK, Sauer K, Klein MP. J. Phys. Chem. B. 1998;102:8257. doi: 10.1021/jp981668r. [DOI] [PMC free article] [PubMed] [Google Scholar]
- 35.Yachandra VK, Derose VJ, Latimer MJ, Mukerji I, Sauer K, Klein MP. Jpn. J. Appl. Phys. Part 1 - Regul. Pap. Short Notes Rev. Pap. 1993;32:523. [Google Scholar]
- 36.Derose VJ, Mukerji I, Latimer MJ, Yachandra VK, Sauer K, Klein MP. J. Am. Chem. Soc. 1994;116:5239. [Google Scholar]
- 37.Sauer K, Yachandra VK. Proc. Natl. Acad. Sci. U. S. A. 2002;99:8631. doi: 10.1073/pnas.132266199. [DOI] [PMC free article] [PubMed] [Google Scholar]
- 38.Carrell TG, Tyryshkin AM, Dismukes GC. J. Biol. Inorg. Chem. 2002;7:2. doi: 10.1007/s00775-001-0305-3. [DOI] [PubMed] [Google Scholar]
- 39.Messinger J, Nugent JHA, Evans MCW. Biochemistry. 1997;36:11055. doi: 10.1021/bi9711285. [DOI] [PubMed] [Google Scholar]
- 40.Messinger J, Robblee J, Yu WO, Sauer K, Yachandra VK, Klein MP. J. Am. Chem. Soc. 1997;119:11349. doi: 10.1021/ja972696a. [DOI] [PMC free article] [PubMed] [Google Scholar]
- 41.Iuzzolino L, Dittmer J, Dörner W, Meyer-Klaucke W, Dau H. Biochemistry. 1998;37:17112. doi: 10.1021/bi9817360. [DOI] [PubMed] [Google Scholar]
- 42.Haumann M, Muller C, Liebisch P, Iuzzolino L, Dittmer J, Grabolle M, Neisius T, Meyer-Klaucke W, Dau H. Biochemistry. 2005;44:1894. doi: 10.1021/bi048697e. [DOI] [PubMed] [Google Scholar]
- 43.Ono T, Noguchi T, Inoue Y, Kusunoki M, Matsushita T, Oyanagi H. Science. 1992;258:1335. doi: 10.1126/science.258.5086.1335. [DOI] [PubMed] [Google Scholar]
- 44.MacLachlan DJ, Nugent JHA, Bratt PJ, Evans MCW. Biochim. Biophys. Acta. 1994;1186:186. [Google Scholar]
- 45.Styring SA, Rutherford AW. Biochem. 1988;27:4915. [Google Scholar]
- 46.Roelofs TA, Liang MC, Latimer MJ, Cinco RM, Rompel A, Andrews JC, Sauer K, Yachandra VK, Klein MP. Proc. Natl. Acad. Sci. U. S. A. 1996;93:3335. doi: 10.1073/pnas.93.8.3335. [DOI] [PMC free article] [PubMed] [Google Scholar]
- 47.Siegbahn PEM. Chem. Eur. J. 2006;12:9217. [Google Scholar]
- 48.Messinger J. Phys. Chem. Chem. Phys. 2004;6:4764. [Google Scholar]
- 49.Yachandra VK, Klein MP. In: Biophysical Techniques in Photosynthesis. Amesz J, Hoff AJ, editors. Vol. 3. Kluwer Academic Publishers; Dordrecht, Netherlands: 1996. p. 337. [Google Scholar]
- 50.Visser H, Anxolabéhère-Mallart E, Bergman U, Glatzel P, Robblee JH, Cramer SP, Girerd J-J, Sauer K, Klein MP, Yachandra VK. J. Am. Chem. Soc. 2001;123:7031. doi: 10.1021/ja004306h. [DOI] [PMC free article] [PubMed] [Google Scholar]
- 51.Yano J, Yachandra VK. Photosynth. Res. 2007 in press. [Google Scholar]
- 52. foornote_CCR_ii.
- 53.Glatzel P, Bergmann U. Coord. Chem. Rev. 2005;249:65. [Google Scholar]
- 54.Glatzel P, Bergmann U, Yano J, Visser H, Robblee JH, Gu WW, de Groot FMF, Christou G, Pecoraro VL, Cramer SP, Yachandra VK. J. Am. Chem. Soc. 2004;126:9946. doi: 10.1021/ja038579z. [DOI] [PMC free article] [PubMed] [Google Scholar]
- 55.Glatzel P, Yano J, Bergmann U, Visser H, Robblee JH, Gu WW, de Groot FMF, Cramer SP, Yachandra VK. J. Phys. Chem. Solids. 2005;66:2163. doi: 10.1016/j.jpcs.2005.09.012. [DOI] [PMC free article] [PubMed] [Google Scholar]
- 56.Liang MC, Latimer MJ, Dau H, Roelofs TA, Yachandra VK, Sauer K, Klein MP. Biochemistry. 1994;33:4923. doi: 10.1021/bi00182a022. [DOI] [PubMed] [Google Scholar]
- 57.Dau H, Andrews JC, Roelofs TA, Latimer MJ, Liang W, Yachandra VK, Sauer K, Klein MP. Biochemistry. 1995;34:5274. doi: 10.1021/bi00015a043. [DOI] [PubMed] [Google Scholar]
- 58.Deroo CLS, Yocum CF. Biochem. Biophys. Res. Commun. 1981;100:1025. doi: 10.1016/0006-291x(81)91926-4. [DOI] [PubMed] [Google Scholar]
- 59.DeRose VJ. Lawrence Berkeley Laboratory Report LBL-30077. University of California; Berkeley: 1990. Ph. D. Dissertation. [Google Scholar]
- 60.Cole J, Yachandra VK, Guiles RD, McDermott AE, Britt RD, Dexheimer SL, Sauer K, Klein MP. Biochim. Biophys. Acta. 1987;890:395. doi: 10.1016/0005-2728(87)90169-1. [DOI] [PubMed] [Google Scholar]
- 61.Haumann M, Liebisch P, Muller C, Barra M, Grabolle M, Dau H. Science. 2005;310:1019. doi: 10.1126/science.1117551. [DOI] [PubMed] [Google Scholar]
- 62.Zouni A, Witt H-T, Kern J, Fromme P, Krauß N, Saenger W, Orth P. Nature. 2001;409:739. doi: 10.1038/35055589. [DOI] [PubMed] [Google Scholar]
- 63.Kamiya N, Shen JR. Proc. Natl. Acad. Sci. USA. 2003;100:98. doi: 10.1073/pnas.0135651100. [DOI] [PMC free article] [PubMed] [Google Scholar]
- 64.Ferreira KN, Iverson TM, Maghlaoui K, Barber J, Iwata S. Science. 2004;303:1831. doi: 10.1126/science.1093087. [DOI] [PubMed] [Google Scholar]
- 65.Loll B, Kern J, Saenger W, Zouni A, Biesiadka J. Nature. 2005;438:1040. doi: 10.1038/nature04224. [DOI] [PubMed] [Google Scholar]
- 66.Yano J, Kern J, Irrgang K-D, Latimer MJ, Bergmann U, Glatzel P, Pushkar Y, Biesiadka J, Loll B, Sauer K, Messinger J, Zouni A, Yachandra VK. Proc. Natl. Acad. Sci. USA. 2005;102:12047. doi: 10.1073/pnas.0505207102. [DOI] [PMC free article] [PubMed] [Google Scholar]
- 67.Bergmann U, Cramer SP. A high-resolution large-acceptance analyzer for x-ray fluorescence and Raman spectroscopy; SPIE Conference on Crystal and Multilayer Optics, San Diego, CA, 1998; SPIE: San Diego, CA. 1998.p. 198. [Google Scholar]
- 68. foornote_CCR_iii.
- 69.Mukerji I, Andrews JC, Derose VJ, Latimer MJ, Yachandra VK, Sauer K, Klein MP. Biochemistry. 1994;33:9712. doi: 10.1021/bi00198a042. [DOI] [PubMed] [Google Scholar]
- 70.Mukerji I, Andrews JC, DeRose VJ, Latimer MJ, Yachandra VK, Sauer K, Klein MP. Biochemistry. 1994;33:9712. doi: 10.1021/bi00198a042. [DOI] [PubMed] [Google Scholar]
- 71.Cinco RM, Robblee JH, Messinger J, Fernandez C, Holman KLM, Sauer K, Yachandra VK. Biochemistry. 2004;43:13271. doi: 10.1021/bi036308v. [DOI] [PMC free article] [PubMed] [Google Scholar]
- 72.Biesiadka J, Loll B, Kern J, Irrgang KD, Zouni A. Phys. Chem. Chem. Phys. 2004;6:4733. [Google Scholar]
- 73.Grabolle M, Haumann M, Muller C, Liebisch P, Dau H. J. Biol. Chem. 2006;281:4580. doi: 10.1074/jbc.M509724200. [DOI] [PubMed] [Google Scholar]
- 74.Yano J, Sauer K, Girerd JJ, Yachandra VK. J. Am. Chem. Soc. 2004;126:7486. doi: 10.1021/ja038218j. [DOI] [PMC free article] [PubMed] [Google Scholar]
- 75.Yano J, Kern J, Sauer K, Latimer M, Pushkar Y, Biesiadka J, Loll B, Saenger W, Messinger J, Zouni A, Yachandra VK. Science. 2006;314:821. doi: 10.1126/science.1128186. [DOI] [PMC free article] [PubMed] [Google Scholar]
- 76.Latimer MJ, Dau H, Liang W, Andrews JC, Roelofs TA, Cinco RM, Rompel A, Sauer K, Yachandra VK, Klein MP. In: Synchrotron Radiation Techniques in Industrial, Chemical and Materials Science. D'Aminco KL, Shuh DK, Terminello LJ, editors. Plenum Press; New York: 1996. p. 141. [Google Scholar]
- 77.Riggs PJ, Yocum CF, Penner-Hahn JE, Mei R. J. Am. Chem. Soc. 1992;114:10650. [Google Scholar]
- 78.Cinco RM, Robblee JH, Rompel A, Fernandez C, Yachandra VK, Sauer K, Klein MP. J. Phys. Chem. B. 1998;102:8248. doi: 10.1021/jp981658q. [DOI] [PMC free article] [PubMed] [Google Scholar]
- 79.Wydrzynski T, Satoh S. Photosystem II: The Light-Driven Water:Plastoquinone Oxidoreductase. Springer; Dordrecht: 2005. [Google Scholar]
- 80.McDermott AE, Yachandra VK, Guiles RD, Cole JL, Dexheimer SL, Britt RD, Sauer K, Klein MP. Biochemistry. 1988;27:4021. doi: 10.1021/bi00411a019. [DOI] [PubMed] [Google Scholar]
- 81.DeRose VJ, Mukerji I, Latimer MJ, Yachandra VK, Sauer K, Klein MP. J. Am. Chem. Soc. 1994;116:5239. [Google Scholar]
- 82.DeRose VJ, Latimer MJ, Zimmermann J-L, Mukerji I, Yachandra VK, Sauer K, Klein MP. Chem. Phys. 1995;194:443. [Google Scholar]
- 83.Haumann M, Barra M, Loja P, Loscher S, Krivanek R, Grundmeier A, Andreasson LE, Dau H. Biochem. 2006;45:13101. doi: 10.1021/bi061308r. [DOI] [PubMed] [Google Scholar]
- 84.Haumann M, Pospisil P, Grabolle M, Muller C, Liebisch P, Sole VA, Neisius T, Dittmer J, Iuzzolino L, Dau H. 2002;9:304. doi: 10.1107/s0909049502012955. [DOI] [PubMed] [Google Scholar]
- 85.Haumann M, Muller C, Liebisch P, Neisius T, Dau H. 2005;12:35. doi: 10.1107/S0909049504027803. [DOI] [PubMed] [Google Scholar]