

Abstract
Streaming potentials across cloned epithelial Na+ channels (ENaC) incorporated into planar lipid bilayers were measured. We found that the establishment of an osmotic pressure gradient (Δπ) across a channel-containing membrane mimicked the activation effects of a hydrostatic pressure differential (ΔP) on αβγ-rENaC, although with a quantitative difference in the magnitude of the driving forces. Moreover, the imposition of a Δπ negates channel activation by ΔP when the Δπ was directed against ΔP. A streaming potential of 2.0 ± 0.7 mV was measured across αβγ-rat ENaC (rENaC)-containing bilayers at 100 mM symmetrical [Na+] in the presence of a 2 Osmol/kg sucrose gradient. Assuming single file movement of ions and water within the conduction pathway, we conclude that between two and three water molecules are translocated together with a single Na+ ion. A minimal effective pore diameter of 3 Å that could accommodate two water molecules even in single file is in contrast with the 2-Å diameter predicted from the selectivity properties of αβγ-rENaC. The fact that activation of αβγ-rENaC by ΔP can be reproduced by the imposition of Δπ suggests that water movement through the channel is also an important determinant of channel activity.
Keywords: sodium transport, epithelia, amiloride, water permeability, mechanosensitivity
Amiloride-sensitive Na+ channels found in different epithelia are generally of low-to-moderate conductance and are highly selective for Li+ and Na+ over the other alkali metal cations (1, 2). These characteristics imply that the conduction region of the pore may be narrow (3). If this is the case, then ions and water should not be able to pass each other, and therefore their flows will be coupled. If a membrane containing these channels separates solutions of differing osmolalities, as occurs in distal kidney tubules and the urinary bladder, then an electrical potential difference generated by Na+ movement produced from the resultant water flow through the channel will develop. The magnitude of this so-called “streaming potential” is related to the number of water molecules contained within the pore region (4–7).
The purpose of the present study was to measure streaming potentials produced by osmotic gradients across planar lipid bilayers containing a recently cloned rat epithelial Na+ channel (rENaC). This channel consists of three homologous subunits, termed α, β, and γ, that reproduce many of the features of amiloride-sensitive Na+ channels found in native epithelia. Moreover, these channels can be activated by a hydrostatic pressure gradient (ΔP) (8–11). In the absence of Ca2+, these channels can no longer be activated by hydrostatic pressure (10). Consequently, we also tested the hypothesis that water flow through the channel is responsible for activation of αβγ-rENaC following the imposition of ΔP. Our results indicate that the pore region of αβγ-rENaC can accommodate only two to three water molecules, implying a length of the narrow region of only 0.7–1.0 nm.
EXPERIMENTAL PROCEDURES
In Vitro Translation of ENaC.
In vitro translation of individual α-, β-, and γ-rENaC proteins was accomplished as described (11). Briefly, purified and linearized DNA plasmids encoding each subunit were in vitro transcribed using T7 RNA polymerase (Ribomax kit; Promega). A cap analogue, m7G(5′)ppp(5′)G (in a 2:1 ratio to GTP) was added to the transcription reaction. In vitro translations of individual subunits were performed for 2 h at 30°C using a rabbit reticulocyte cell lysate (Promega) in the presence of canine microsomal membranes and 0.8 mCi/ml [35S]trans label (ICN; 1 Ci = 37 GBq). The translated α-, β-, and γ-rENaC proteins were eluted from a G-150 Sephadex column (Pharmacia Biotechnology) column with a 500 mM NaCl, 1 mM EDTA, and 10 mM Tris (pH 7.6). The individual α-, β-, and γ-rENaC proteins were combined at a 1:1:1 ratio based on [35S] determination. Control liposomes were also prepared following an identical protocol, but with rENaC mRNA omitted.
Planar Lipid Bilayer Studies.
Planar lipid bilayers were made as described from a phospholipid solution consisting of a 2:1:2 mixture of diphytanoyl-phosphatidylethanolamine/diphytanoyl-phosphatidyl-serine/oxidized cholesterol (all obtained from Avanti Polar Lipids) in n-octane (final phospholipid concentration, 25 mg/ml). Bilayer formation was monitored by an increase in membrane capacitance to 300–400 pF. Bilayers were bathed in 100 mM NaCl containing 10 mM Mops-Tris buffer (pH 7.4). The isolated membrane vesicles were applied to a preformed membrane with the membrane potential held at −40 mV. Under these experimental conditions, the channels incorporated with the amiloride-sensitive (extracellular) side facing the trans solution in over 90% of the incorporations. Voltage was applied to the cis chamber, and the trans chamber was held at virtual ground (8, 11). Acquisition and analysis of single channel recordings were performed using pclamp software and hardware (Axon Instruments, Foster City, CA). Data were stored digitally and filtered at 100 Hz with an 8-pole Bessel filter prior to acquisition at 1 ms per point. All experiments were performed using bathing solutions that were prepared with Mill-Q Water and filter sterilized. All experimentation was done on membranes containing only a single channel, the criteria of which was described previously (8, 11).
Streaming Potential Measurements.
Current–voltage relationships (I–V) for the open channel were determined in the voltage range of ±40 mV in 5-mV steps. The amplitude of the current at each potential was determined from single channel records. A control single channel I–V relationship was first measured for each channel incorporated into the membrane. An osmotic gradient was then established by substituting the cis side bilayer solution for the 2 M sucrose/100 mM NaCl. Ten minutes after the establishment of an osmotic gradient, a second I–V curve was taken. The reversal potential was determined by linear regression of this curve. Finally, valinomycin was added to both compartments at a final concentration of 10 μM. The reversal potential for the valinomycin-induced current was next determined. The streaming potential only arising from Na+–water coupling will be the difference between the reversal potential of the channel obtained in the presence of sucrose (Vs) and the reversal potential obtained following valinomycin addition (Vv). The measurement of the reversal potential in the presence of valinomycin will correct for differences of potential difference generated by reductions in the activity coefficient of NaCl due to the presence of sucrose and for the differences in interfacial local salt concentrations within the unstirred layers caused by water movement through the bilayers (5, 12). Therefore, Vs is equal to Vc − Vv, where Vc is the streaming potential due only to Na+–water coupling. We assume that Na+ flux induced by valinomycin is not coupled to water transport. Although the bilayer conductance ratio of K+ over Na+ induced by 0.1 μM valinomycin can vary from 30 to more than 1,000 (13), depending upon the ionic strength, there is a finite Na+ conductance, especially at 10 μM valinomycin concentration. Thus, the valinomycin-induced currents were at least two orders of magnitude larger than the current passing through a single αβγ-rENaC.
RESULTS
Fig. 1 shows a continuous record from an experiment designed to test the hypothesis that water flow through the channel is responsible for αβγ-rENaC activation subsequent to the imposition of a ΔP. Consistent with our previous findings, a 0.26 mmHg hydrostatic pressure gradient produced by the removal of 1 ml of bathing solution from one side of the chamber activated αβγ-rENaC, causing the appearance of three equal-sized, independently gated, subconductance states (second trace). This effect was completely reversed following the adjustment of the bathing solutions in each compartment to equal levels (third trace). The channel could be activated to the same extent when an osmotic pressure gradient (Δπ) was established across the bilayer by the addition of 50 mM sucrose to one of the compartments (fourth trace).
Figure 1.
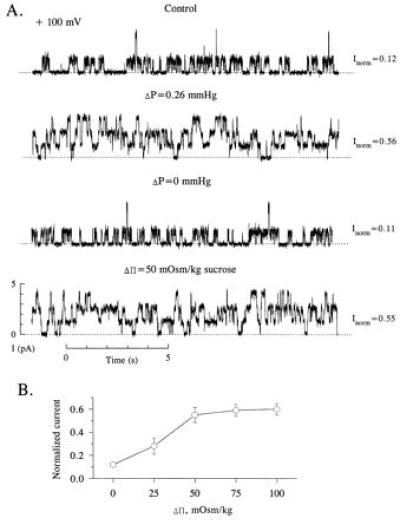
Effect of hydrostatic and osmotic pressure gradients on αβγ-rENaC activity in planar lipid bilayers. (A) Continuous single channel records of αβγ-rENaC under different conditions. Bilayer was bathed with symmetrical 100 mM NaCl and 10 mM Mops (pH 7.4), and records were filtered at 100 Hz. The applied potential was +100 mV in all cases. This experiment was performed 12 times. (B) Normalized current versus osmotic pressure gradient (Δπ). The osmotic gradient was established by the addition of sucrose to one compartment of the bilayer chamber. Each point represents the mean ± 1 SD of at least six experiments.
The removal of 1 ml of bathing solution results in 5-mm difference in the heights of the bathing solutions separated by the bilayer membrane. This corresponds to ΔP of 0.26 mmHg and results in a doubling of the capacitance of the bilayer. This pressure difference is equivalent to a 15-μM osmotic concentration difference, much lower than the Δπ gradient of 50 mM that is required to produce a similar degree of activation. Fig. 1B summarizes the effects of Δπ on single αβγ-rENaC activity. A minimum of 25 mOsm/kg Δπ was required to activate the channel above baseline. Maximal channel activation occurred at a Δπ of 50 mOsm/kg. This effect was independent of the osmotic agent (sucrose or glucose) used to produce the gradient (data not shown).
We next performed experiments in which the hydrostatic and osmotic driving forces were set in opposite directions. Fig. 2 shows that the water flow produced by a 50 mOsm/kg Δπ directed opposite that produced by a 0.26 mmHg ΔP completely reversed the activation of αβγ-rENaC by ΔP. These results suggest that the mechanical torsion of a bilayer plays an important role in activating αβγ-rENaC following the imposition of a hydrostatic pressure gradient. Nonetheless, the fact that the stimulatory effect ΔP can be reproduced by the imposition of an osmotic pressure gradient suggests that water movement through the channel is also an important component affecting αβγ-rENaC activity.
Figure 2.

Single channel record of αβγ-rENaC incorporated into a planar lipid bilayer membrane. The top trace was obtained under symmetrical ionic conditions with no hydrostatic or osmotic gradients present. The middle trace was obtained after 1 ml of solution was removed from the cis compartment. The bottom trace was recorded subsequent to the addition of 50 mOsm/kg sucrose to the trans compartment. This experiment is representative of seven such protocols.
Direct measurements of a streaming potential at the single-channel level can provide quantitative information concerning water movement through αβγ-rENaC. Fig. 3A presents single channel records of αβγ-rENaC in symmetrical 100 mM NaCl when 2 M sucrose was added to the cis compartment. Even at a decreased signal-to-noise ratio, single channel current transitions could still be resolved at these low voltages. As can be seen in the figure, a finite current through the channel was observed at zero applied potential in symmetrical 100 mM NaCl following the addition of 2 M sucrose to the cis compartment. The magnitude of the single channel current at each applied voltage was determined from appropriately constructed event histograms (data not shown). The maximal conductance state of the channel (i.e., 39 pS) was used in this analysis (11). The I–V curves obtained in the absence and in the presence of 2 M of sucrose are shown in Fig. 3B. Least-square fitting of the data revealed that the slope conductance of αβγ-rENaC under osmotic pressure conditions was 35.6 ± 0.6 pS, which is 9% less than under control condition (39.1 ± 0.5 pS). Such a decrease in single channel conductance may be explained by a reduced conductivity of the bathing solution following the addition of sucrose. Alternatively, this decrease could be caused by a blocking (or other pharmacological) effect of sucrose. In any case, to reveal the true streaming potential caused by water flow through the channel, the measurement of the reversal potential in the presence of 2 Osm/kg gradient subsequent to the addition of valinomycin was performed. The addition of 10 μM valinomycin produced more than 100-fold increase in the current through the membrane, and reduction in the measured reversal potential from 7.2 ± 1.1 mV in the absence of valinomycin to 5.2 ± 0.5 mV in the presence of the drug (n = 6). The magnitude of the reversal potential measured in the presence of valinomycin was almost twice as large as that measured for the same osmotic conditions in the experiments with Ca2+-activated K+ channels (12, 14), which may be due to the difference in ionic conditions. Because of this, one would expect a larger diffusion potential on Na+/Na+ interfaces which can be induced due to the unstirred layers, or on Na+/K+ interfaces between agar bridges and bathing solutions in the system we used for the present studies as compared with K+/K+ interfaces reported in two previous investigations (12, 14). As a matter of fact, the reversal potential for a channel obtained in the presence of osmotic gradient and valinomycin can reach even higher value [≈15 mV were reported for ryanodine receptor channel in Cs+ containing solutions (15)]. Another difference in the experimental conditions was a 1,000-fold higher concentration of valinomycin used in the measurements of streaming potential in ENaC, as compared with that used for K+ channels. On the other hand, although there might be a finite ion-coupled water movement through valinomycin-modified membrane, the extent of the increase of the membrane conductance in the presence of valinomycin in our experiments was comparable to that reported for K+ channels (12, 14). This fact may be indicative of the same value of valinomycin induced, water movement through the membrane and confirms validity of our measurements of streaming potential. Nonetheless, the 2.0 ± 0.7 mV shift in the reversal potential is the least estimate of the streaming potential generated due to water flow through αβγ-rENaC .
Figure 3.
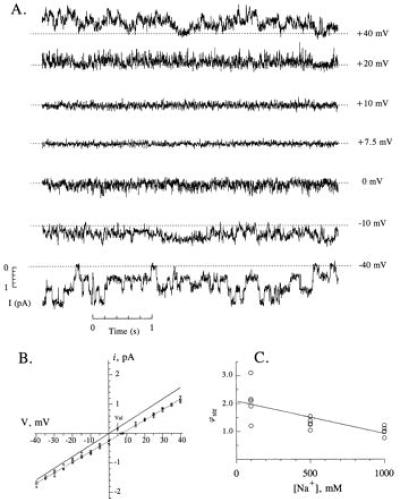
Streaming potential measurements in αβγ-rENaC. (A) Continuous single channel record of αβγ-rENaC in a bilayer separating a 100 mM NaCl solution and a 100 mM NaCl plus 2 Osm/kg sucrose solution. The applied potential is shown to the right of each trace. (B) I–V relationships in 100 mM NaCl in the absence (solid lines, data points not shown) and presence of 2 Osm/kg sucrose on one side of the membrane (dashed line, open symbols represent data points for separate experiments). The reversal potential for the sucrose curve was 7.2 ± 1.1 mV (standard deviations). The reversal potential in the presence of 10 μM valinomycin (Val, arrow) was 5.2 ± 0.5 mV. (C) Streaming potentials measured at different NaCl concentrations. Each point represents a different membrane, but all were made in the presence of a 2 Osm/kg sucrose gradient. The line is a linear regression fit of the data with the slope of −1.16 ± 0.30 mV/M. The slope is statistically different from zero (P < 0.01, single-tailed Student’s t test).
I–V relationships were also determined at different NaCl concentrations, keeping the sucrose concentration difference constant at 2 Osm/kg. The streaming potential was found to decrease with increasing NaCl concentration (Fig. 3C). The slope of the line was −1.16 mV/M with a standard deviation of 0.30 mV/M. The slope was significantly different from zero (P < 0.01). The streaming potential in the limit of 0 mM NaCl was 2.1 ± 0.2 mV at an Δπ of 2 Osm/kg.
DISCUSSION
The experiments presented in this manuscript were designed to investigate the nature of activation of αβγ-rENaC by a hydrostatic pressure gradient. The geometry of a planar lipid bilayer membrane presumes the existence of a thick region of lipids (torus) that surrounds an area where the lipids form a bimolecular film. When ΔP is applied, this torus supplies the bulk of the lipids for the bilayer to expand, forming a new curved surface, as can be concluded from the bilayer capacitance measurements. Thus, there are two nonexclusive possibilities that can account for the activation of this channel: a curvature-induced mechanical activation or a water flow-induced activation. To distinguish between these mechanisms and to test the hypothesis that water flow through the channel is a driving force that activates αβγ-rENaC following the imposition of a ΔP, we examined if the channel could be activated to a similar extent subsequent to establishing an equivalent osmotic pressure gradient. Our results indicate that αβγ-rENaC became more active following the establishment of an osmotic pressure gradient (Δπ), but only when a minimum of 25 mM of nonelectrolyte was added to either compartment bathing the membrane. For a ΔP = 0.26 mmHg (that required for maximal activation of αβγ-rENaC), a 15 μM concentration difference of an impermeant solute would produce an equivalent driving force. Thus, it appears that the mechanical tension of a bilayer produced by ΔP plays an important role in activating αβγ-rENaC. Nonetheless, the fact that an increase in channel activity can be reproduced by the imposition by an osmotic pressure gradient suggests that water movement in the channel is also important in modulating channel activity.
We also measured streaming potentials across αβγ-rENaC-containing bilayer membranes. These experiments were designed to establish whether or not ENaC is permeable to water and, if so, how many water molecules are obligatorily coupled to the diffusion of a single ion through the channel. Moreover, these experiments were designed to provide information concerning the length—i.e., long and narrow versus short and wide—of the conduction region of ENaC.
Levitt et al. (4) and Rosenberg and Finkelstein (5) have shown that for a cation permeable channel in which single filing applies, the number of water molecules that are transported per cation can be computed assuming that once an ion enters the channel, a water molecule is pushed out ahead of it. Thus, the actual number of water molecules in the narrow region of the channel can be calculated. For a multi-ion pore, streaming potential measurements would yield the average number of water molecules between ions (4, 5). Because ENaC appears to behave as a multi-ion pore (16), streaming potential measurements were made as a function of ionic strength (Fig. 3C). From these measurements, the number of water molecules coupled to Na+ transport through ENaC decreases from 2–3 at low Na+ activity to 1–2 at high Na+ activity. These observations are consistent with the idea that channel occupancy by Na+ increases at higher Na+ concentrations. At low concentrations of Na+, it is highly probable that the channel contains only one ion. Therefore, the number of water molecules determined corresponds to the channel occupied by only one ion (16). This calculation would restrict the length of the conduction region of the pore to a mere 0.7–1.0 nm, substantially less than the average 6-nm thickness for the bilayer itself. This length of conduction region is reminiscent of that of a sarcoplasmic reticulum K+ channel (12) and Ca2+-activated K+ channels from skeletal and smooth muscle (14). This structural arrangement is also compatible with a high conductance channel where there are two large vestibules separated by a short narrow pore region. To provide a channel with relatively low conductance, the entrance to the narrowest part of the pore must not be so large as to permit free diffusion of ions, but large enough so that the no-pass condition (i.e., single-filing) does not obtain. Alternatively, the vestibules guarding the entrance to the pore may contain elements that electrostatically prohibit free diffusion of cations, thus restricting cation entry to the conduction pathway. In any case, it appears that αβγ-rENaC contains within it a short and narrow conduction region. These observations place constraints on any structural models of functional αβγ-rENaC that may be developed.
Acknowledgments
We thank Christie Browne for superb technical assistance, Drs. H. T. Tien (Michigan State University), S. Simon (Duke University), and B. Martinac (University of Western Australia) for helpful discussions of the manuscript, and Charlae T. Starr for excellent help in preparing the manucsript. V.G.S. was on leave from the Institute of Physiology of the Uzbek Academy of Sciences, Tashkent, Uzbekistan. This work was supported by National Institutes of Health Grant DK 37206.
ABBREVIATIONS
- ENaC
epithelial Na+ channel(s)
- rENaC
rat epithelial Na+ channel
- ΔP
hydrostatic pressure gradient
- I–V
current–voltage
- Δπ
osmotic pressure gradient
References
- 1.Garty H. FASEB J. 1994;8:522–528. doi: 10.1096/fasebj.8.8.8181670. [DOI] [PubMed] [Google Scholar]
- 2.Benos D J, Awayda M S, Ismailov I I, Johnson J P. J Membr Biol. 1995;143:1–18. doi: 10.1007/BF00232519. [DOI] [PubMed] [Google Scholar]
- 3.Palmer G. Commun Mol Cell Biophys. 1991;7:259–283. [Google Scholar]
- 4.Levitt D G, Elias S R, Hautman J M. Biochim Biophys Acta. 1978;512:4365–451. doi: 10.1016/0005-2736(78)90266-3. [DOI] [PubMed] [Google Scholar]
- 5.Rosenberg P A, Finkelstein A. J Gen Physiol. 1978;72:327–340. doi: 10.1085/jgp.72.3.327. [DOI] [PMC free article] [PubMed] [Google Scholar]
- 6.Levitt D G. Curr Top Membr Transp. 1984;21:181–197. [Google Scholar]
- 7.Finkelstein A. Water Movement Through Lipid Bilayers, Pores, and Plasma Membranes: Theory and Reality. New York: Wiley; 1987. [Google Scholar]
- 8.Awayda M S, Ismailov I I, Berdiev B K, Benos D J. Am J Physiol. 1995;268:C1450–C1459. doi: 10.1152/ajpcell.1995.268.6.C1450. [DOI] [PubMed] [Google Scholar]
- 9.Kizer N, Guo X-L, Hruska K. Proc Natl Acad Sci USA. 1997;94:1013–1018. doi: 10.1073/pnas.94.3.1013. [DOI] [PMC free article] [PubMed] [Google Scholar]
- 10.Ismailov I I, Berdiev B K, Shlyonsky V Gh, Benos D J. Biophys J. 1997;72:1182–1192. doi: 10.1016/S0006-3495(97)78766-6. [DOI] [PMC free article] [PubMed] [Google Scholar]
- 11.Ismailov I I, Awayda M S, Berdiev B K, Bubien J K, Lucas J E, Fuller C M, Benos D J. J Biol Chem. 1996;271:807–816. doi: 10.1074/jbc.271.2.807. [DOI] [PubMed] [Google Scholar]
- 12.Miller C. Biophys J. 1982;38:227–230. doi: 10.1016/S0006-3495(82)84552-9. [DOI] [PMC free article] [PubMed] [Google Scholar]
- 13.Lev A A. In: Membrane Transport Processes. Tosteson D C, Ovchinnikov Yu A, Latorre R, editors. Vol. 2. New York: Raven; 1978. pp. 269–284. [Google Scholar]
- 14.Alcayaga C, Cecchi X, Alvarez O, Latorre R. Biophys J. 1989;55:367–371. doi: 10.1016/S0006-3495(89)82814-0. [DOI] [PMC free article] [PubMed] [Google Scholar]
- 15.Tu Q, Velez P, Brodwick M, Fill M. Biophys J. 1994;67:2280–2285. doi: 10.1016/S0006-3495(94)80713-1. [DOI] [PMC free article] [PubMed] [Google Scholar]
- 16.Ismailov, I. I., Shlyonsky, V. Gh., Alvarez, O. & Benos, D. J. (1997) J. Physiol. (London), in press. [DOI] [PMC free article] [PubMed]