

Abstract
Here we describe the in vitro reconstitution of photosystem I light-harvesting complexes with pigments and proteins (Lhca1 and Lhca4) obtained by overexpression of tomato Lhca genes in Escherichia coli. Using Lhca1 and Lhca4 individually for reconstitution results in monomeric pigment-proteins, whereas a combination thereof yields a dimeric complex. Interactions of the apoproteins is highly specific, as reconstitution of either of the two constituent proteins in combination with a light-harvesting protein of photosystem II does not result in dimerization. The reconstituted Lhca1/4, but not complexes obtained with either Lhca1 or Lhca4 alone, closely resembles the native LHCI-730 dimer from tomato leaves with regard to spectroscopic properties, pigment composition, and stoichiometry. Monomeric complexes of Lhca1 or Lhca4 possess lower pigment/protein ratios, indicating that interactions of the two subunits not only facilitates pigment reorganization but also recruitment of additional pigments. In addition to higher averages of chlorophyll a/b ratios in monomeric complexes than in LHCI-730, comparative fluorescence and CD spectra demonstrate that heterodimerization involves preferential ligation of more chlorophyll b.
Precise assembly and alignment of pigments with the various proteins encoded by a family of nuclear Lhc genes underly the formation of the light-harvesting complexes (LHCs) of thylakoid membranes, enabling the collection of solar energy and its transmission to the two photochemically active reaction centers. Although the major LHCII has been analyzed in detail with respect to protein and pigment composition and organization (1), information about LHCs of photosystem I (PSI) are limited, mostly because they are difficult to isolate abundantly in an intact state. The original finding that four proteins of about 21 to 24 kDa form the LHCI (2) is now widely accepted, and the respective genes have been identified, cloned, and sequenced (3, 4). Recently, closely related photosystem I antenna components have been identified in red algae (5, 6). In vascular plants, there are two major LHCI subfractions with different protein compositions and fluorescence properties (7–9). One, LHCI-680, is enriched in polypeptides of 24 and 23 kDa (Lhca3 and Lhca2, respectively), has characteristic 77-K fluorescence at 680 nm and a low density in sucrose gradients, and is regarded as monomeric also on the basis of electrophoretic mobility. The LHCI-680 complex can be resolved into two green bands, one enriched in Lhca2 and the other in Lhca3, showing that both proteins are pigment binding (8, 10). The second complex, LHCI-730, exhibits 77-K fluorescence around 730 nm, has a higher sedimentation coefficient, is associated with proteins of 22 and 21 kDa (Lhca1 and Lhca4, respectively), and is considered to be dimeric (7–11). Further dissection of the LHCI-730 complex has not been achieved, leaving open the question of the extent to which both constitutent apoproteins function in pigment binding and whether the complex is heterodimeric or a mixture of homodimers (12). Even the pigment compositions of the different LHCIs have not been quantitatively determined because, up to now, the analyses either have been restricted to preparations of total LHCI, one enriched in LHCI-730 (13), or were estimates from the comparison of the pigment content of PSI vs. LHCI-depleted PSI (14, 15). Moreover, these studies yielded conflicting data, especially with regard to the presence of neoxanthin and the amount of β-carotene in LHCI.
Although high-resolution electron microscopy of crystallized LHCII has provided important information about the arrangement of pigments in the complex (16), it does not resolve effects of the protein environment on the spectral properties of ligated pigments. The LHCI-730 protein(s) that organize chlorophyll (Chl)-a to fluoresce at long wavelengths (as opposed to 677 nm for free Chl-a at 77 K), represent a most striking example of the dependence of the protein environment on generating spectral properties that are necessary, in this case, for efficient energy-transfer interactions with PSI (17–19). Toward resolving the respective roles of Lhca1 and Lhca4 in LHCI-730, we extend the utility of in vitro reconstitution of LHCs (20) and further exploit the use of apoproteins overexpressed in bacteria (21–24). We demonstrate that in vitro formation of LHCI-730 can be achieved by reconstituting Lhca1 and Lhca4 apoproteins only under conditions that enable their heterodimerization. Comparison of the spectral properties of monomeric vs. dimeric LHCI complexes elucidates the strong influence that protein–protein interactions can exert on ligated pigments. In addition, protein and pigment quantitations indicate that Lhca1/4 dimerization is accompanied by binding of additional pigments, particularly chlorophyll b, contributing substantially to the special spectroscopic properties of LHCI-730. (The Lhc terminology proposed by Jansson et al. (25) is used throughout this paper.)
MATERIALS AND METHODS
Isolation of LHC Complexes.
Isolation of PSI from leaves of greenhouse-grown tomato plants mainly followed the protocol given by Steinback et al. (26). Thylakoids were suspended to 0.8 mg Chl per ml in distilled water and solubilized for 30 min by Triton X-100 (final concentration, 0.5%) at room temperature in darkness with stirring. Following sedimentation of unsolubilized material by centrifugation (30 min, 42,000 × g), aliquots of the supernatant corresponding to 4–5 mg Chl were loaded on sucrose gradients (0.1–0.7 M sucrose) containing 5 mM Tricine⋅NaOH (pH 7.8) and 0.05% Triton X-100 (wt/wt). After centrifugation for 24 h at 115,000 × g, the uppermost of two PSI bands resolved in the lower third of the gradients was collected, concentrated by means of an Amicon Diaflo PM 30 ultrafiltration membrane to about 1/8 of the original volume and dialyzed overnight against 50 mM sorbitol/10 mM Tricine⋅NaOH, pH 7.8. Aggregated PSI was collected by centrifugation (30 min, 42,000 × g). For isolation of LHCI-730, PSI was suspended in 5 mM Tris⋅HCl (pH 7.5), sedimented by centrifugation as above, and suspended in 5 mM Tris⋅HCl (pH 7.5) to 0.5 mg Chl per ml. Following addition of 10% n-dodecyl β-d-maltoside (DM) to 1%, the solution was mixed for 1 h at 4°C in darkness. Then 10% n-octyl β-d-glucopyranoside (OG) was added to 1%, and incubation continued for another hour. Aliquots of the solution equivalent to 0.5 mg Chl were loaded on sucrose gradients (0.1–1.2 M) with 5 mM Tricine⋅NaOH (pH 7.8) and 0.1% DM and spun for 25 h at 270,000 × g. The third band from the top, yielding a 77-K fluorescence maximum around 733 nm, was collected, concentrated by Centricon 10 (Amicon) microconcentrators, and either used directly or frozen at −70°C until it was used. To resolve the constituent pigment proteins of PSI by nondenaturing PAGE (27), PSI was suspended in 30% sucrose, 10 mM Tricine⋅NaOH (pH 7.8), and 1 mM EDTA to 0.5 mg Chl per ml and solubilized for 10 min on ice after addition of lithium dodecylsulfate (LDS) and OG (1% of each). Tomato LHCII was isolated as in Steinback et al. (26) using sucrose gradients with Triton X-100 as above.
Expression Vector Construction, Overexpression, and Inclusion Body Isolation.
cDNAs of tomato Lhca1 (cab 6a) and Lhca4 (cab 11), kindly provided by E. Pichersky (University of Michigan, Ann Arbor), were used for PCR with Pfu polymerase and primers designed for generation of restriction sites for SalI and PstI (Lhca1) and SphI and HindIII (Lhca4). The PCR products were cut with the respective restriction enzymes and ligated into the correspondingly cut vectors pDS12–2 (Lhca1) and pDS12-SphI (Lhca4) (28). Transformants of XLI-Blue Escherichia coli cells were selected by ampicillin (100 μg/ml), and recovered plasmids were subjected to restriction analyses and DNA sequencing. The N-terminal amino acid sequence of the mature native Lhca1 is SADWMP… while recombinant Lhca1 used here yields MRIRRPADWMP… . For Lhca4, the native product with excised transit sequence has an N terminus of KKGQWL…, while the recombinant product is MPKKGQWL… . Plasmid isolation as well as restriction analysis, electrophoresis, and sequencing of DNA was according to standard procedures (29). The AB96 expression vector was used additionally for overexpression of the LHCII apoprotein of pea (21). Protein overexpression and inclusion body isolation was as described (22).
Pigment Preparations and Analyses.
For total pigment extracts for LHC reconstitution, thylakoids of dark-adapted tomato plants were extracted with 80% (vol/vol) acetone and the pigments were partitioned into ether and dried (20). For HPLC analyses of LHC pigments, extracts obtained with 95% ethanol were resolved on a Zorbax HPLC-column with the solvent system given in Thayer and Björkman (30). Flow rate was 2 ml/min, and eluted pigments were detected at 445 nm. Quantification of pigments was obtained by comparison of the peak areas with those obtained for dilution series of the respective standards. Chl-a, Chl-b, β-carotene, and lutein were from Sigma. Neoxanthin and violaxanthin were isolated by thin-layer chromatography of carotenoids (21), and their concentrations were calculated from their extinction coefficients in ethanol (31).
LHC Reconstitution.
A combination of previously described procedures was employed (20, 32). For reconstitution of monomeric complexes, 0.4 mg protein of inclusion body preparations in 160 μl reconstitution buffer (100 mM Tris base/2% LDS/50 mM DTT/5 mM ɛ-aminocaproic acid/1 mM benzamidine) was used. Reconstitutions for dimeric complexes contained 0.2 mg protein each of two inclusion body preparations in 160 μl reconstitution buffer. The protein solutions were boiled for 1 min and placed on ice, and DTT was added to 30 mM and OG to 1%. The solutions then were mixed with thylakoid pigments corresponding to 150 μg of Chl, which had been predissolved in ethanol (final concentration, 3.5%). The resultant mixture was boiled again and cooled to 0°C, and 1 M KCl was added to 150 mM. After mixing at 4°C for 20 min, precipitated K-dodecylsulfate was removed by centrifugation (5 min, 15,800 × g). The supernatants were subjected to density-gradient ultracentrifugation as described above for the isolation of LHCI-730. For analysis by nondenaturing PAGE, 12.5% sucrose was included in the reconstitution buffer, and 2% instead of 1% OG was used.
Spectroscopic Techniques.
Preparations were diluted with 10 mM Tris⋅HCl (pH 7.5) to ≈1 mg Chl per ml. For 77-K fluorescence measurements with an Amicon SPF-500C spectrofluorometer, samples were further diluted with 60% glycerol containing 10 mM Tris⋅HCl (pH 7.5) to 10 μg Chl per ml. Excitation was at 440 or 480 nm with a band width of 4 nm. Emission spectra were recorded with a band width of 2 nm and corrected for phototube response. CD measurements were conducted at room temperature with a Jasco (Easton, MD) J-710 spectropolarimeter. Samples were adjusted with 10 mM Tris⋅HCl (pH 7.5) to 50 μg Chl per ml and scanned four times at a scan speed of 100 nm/min and a resolution of 0.2 nm. Spectra were subsequently corrected for the buffer and smoothed.
Miscellaneous.
Estimates of molecular masses from SDS/PAGE (33) were based on coelectrophoresis of low-range Sigmamarker (Sigma). Protein quantification was with the dye reagent of Bio-Rad for inclusion bodies and with the bicinchoninic acid assay (34) for pigment proteins. Acetylated BSA (Promega) was used as standard. Chl concentrations were determined in 80% acetone (35).
RESULTS
Protein Sequences and Inclusion Body Compositions.
The two apoproteins associated with LHCI-730 of tomato differ only by one amino acid (3, 36), and their separation by PAGE is difficult. The expression vector for Lhca1 was constructed to give a protein with an N-terminal extension of five amino acids, whereas the expression vector for Lhca4 yielded an N terminus with two additional amino acids. Therefore, electrophoretic separation of inclusion bodies isolated from isopropyl β-d-thiogalactoside-induced bacteria resolved dominating bands of the expected molecular masses of 22 kDa (Lhca1) and 21 kDa (Lhca4) (Fig. 1, lanes 1 and 2). The identity of these bands as light-harvesting proteins was confirmed by immunoblot analyses with an antibody raised against the LHCI-730 of Chenopodium rubrum (37) (not shown). Overexpressed Lhcb protein (AB96, lane 3) was also used for reconstitution assays.
Figure 1.
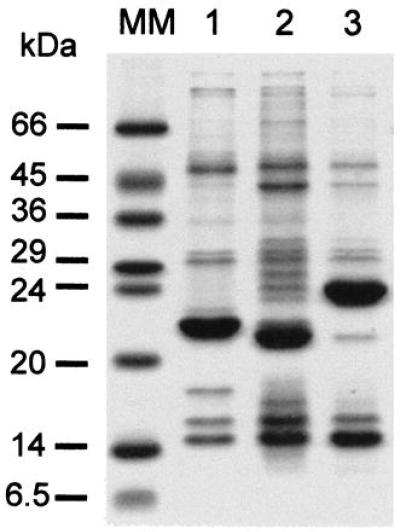
Polypeptide composition of inclusion bodies isolated from E. coli after overexpression of Lhca1 (lane 1), Lhca4 (lane 2), and AB96 (lane 3). The gel was stained with coomassie. MM, molecular mass standards.
LHC Reconstitution.
Results of reconstitutions employing the two overexpressed Lhca proteins individually or together as well as in combination with a Lhcb protein are shown in Fig. 2A. Reconstitutions with single gene products yielded, besides the free pigment zone, green bands with an apparent molecular mass of about 28 kDa. If both Lhca1 and Lhca4 were included in the reconstitution mixture an additional prominent band of about 54 kDa formed. As shown by parallel electrophoresis of PSI, this band comigrated with LHCI-730, indicating the heterodimeric nature of the latter. To assess specificity for formation of this 54-kDa complex, reconstitutions were performed with combinations of either the Lhca1 or the Lhca4 with the LHCII apoprotein encoded by AB96. As seen in Fig. 2A, neither the combination of Lhca1/AB96 nor of Lhca4/AB96 gave rise to the 54-kDa band. To obtain higher amounts of the complexes for detailed analyses, reconstituted samples were purified from sucrose density gradients (Fig. 2B). Reconstitution mixtures containing only one Lhca gene product yielded, besides the free pigment zone, prominent bands representing monomeric LHCI subunits. When inclusion body proteins of both Lhca genes were present, an additional band with a much higher sedimentation coefficient was formed.
Figure 2.
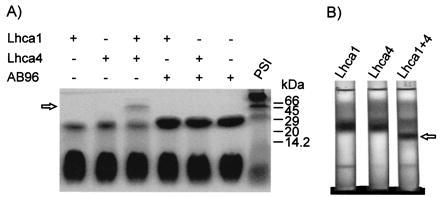
Reconstitution analysis with individual E. coli-synthesized LHCI and LHCII apoproteins and combinations thereof. (A) Unstained gel obtained by nondenaturing gel electrophoresis. The presence (+) or absence (–) of the individual proteins in the reconstitution assay is depicted. (B) Fractionation pattern of the reconstitution mixtures in sucrose density gradients. The arrow points to the heterodimer band.
Biochemical Characterization of the Native and Reconstituted LHCs.
Analysis of the protein composition of the band with the higher sedimentation coefficient revealed the nearly exclusive presence of the 21- and 22-kDa proteins (Fig. 3). The polypeptide stoichiometry of the complex is most probably 1:1; the 22-kDa Lhca1 recombinant protein stained more intensely due to its elevated arginine content (see Material and Methods), which strongly increased coomassie binding (38). Also, recombinant Lhca4 comprised two polypeptides, presumably resulting from translational readthrough to further downstream termination codons, and the larger of these comigrated with Lhca1 (see Fig. 3). The less rapidly sedimenting bands, formed when reconstitution is conducted with only one overexpressed protein, exhibited dominant polypeptides of 22 kDa (Lhca1) and 21/22 kDa (Lhca4), respectively. Also loaded onto the gel in Fig. 3 were n-LHCI-730 and LHCII. n-LHCI-730 consists of two polypeptides of about 21 kDa, which were completely separated only after extended electrophoresis (not shown). n-LHCII has a conspicuous band at 23.5 kDa and a minor one at 23 kDa. These complexes also were used to obtain information about the pigment composition of native (n)- vs. reconstituted (r)-LHCI-730 and their differences from LHCII. As depicted in Table 1, n- and r-LHCI-730 have nearly identical Chl/protein stoichiometry, Chl-a/b ratios, and contents of violaxanthin and β-carotene. The r-LHCI-730 is quite similar to n-LHCI-730 but has more lutein and small amounts of neoxanthin, which are not detectable in the native complex. Pronounced differences in the pigment composition, however, exist in comparison to LHCII of tomato, which contains considerable amounts of neoxanthin but low levels of violaxanthin and β-carotene. Monomeric complexes obtained with Lhca1 and Lhca4 hold an intermediary status. They have elevated amounts of neoxanthin as compared with r-LHCI-730 and decreased amounts of violaxanthin and β-carotene, whereas lutein was in the range found for r-LHCI-730 and LHCII. With regard to the Chl-a/b ratio, the monomer reconstituted with Lhca4 was indistinguishable from r-LHCI-730, whereas that of the monomer obtained with Lhca1 was significantly higher. For both monomeric complexes, less Chl was found attached to protein as compared with the heterodimers or LHCII (Table 1).
Figure 3.
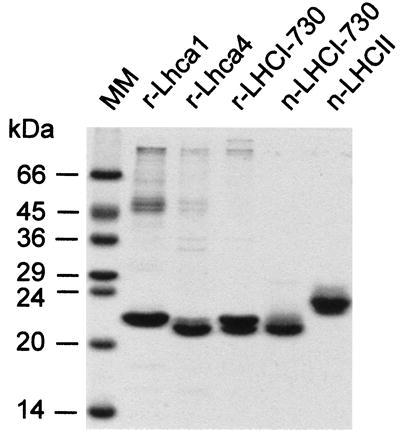
Polypeptide composition of the reconstituted Lhca complexes as well as of the native LHCI-730 and LHCII obtained by sucrose density gradients. Proteins were visualized by coomassie. MM, molecular mass standards.
Table 1.
Pigment composition and chlorophyll/protein ratios of native and reconstituted LHCs isolated by sucrose density gradients
| LHC | Neoxanthin* | Violaxanthin* | Lutein* | β-Carotene* | Chlorophyll a/b† | Chlorophyll/protein† |
|---|---|---|---|---|---|---|
| n-LHCI-730 | – | 54.5 ± 5.3 | 116.9 ± 5.2 | 24.9 ± 5.9 | 2.57 ± 0.06 | 7.17 ± 0.13 |
| r-LHCI-730 | 10.4 ± 2.6 | 47.9 ± 1.8 | 161.2 ± 10.9 | 22.9 ± 4.1 | 2.48 ± 0.07 | 6.90 ± 0.24 |
| r-Lhca1 | 27.8 ± 3.0 | 45.6 ± 9.1 | 170.7 ± 34.4 | 15.0 ± 4.5 | 3.19 ± 0.06 | 5.24 ± 0.11 |
| r-Lhca4 | 13.7 ± 3.9 | 33.2 ± 4.2 | 180.6 ± 15.7 | 14.1 ± 6.3 | 2.52 ± 0.11 | 5.27 ± 0.34 |
| n-LHCII | 47.7 ± 7.2 | 18.8 ± 5.0 | 175.9 ± 9.3 | 8.0 ± 0.8 | 1.23 ± 0.06 | 9.84 ± 0.19 |
The chlorophyll/protein values refer to the chlorophyll amount of monomeric complexes. Given are means ± SD of three to five experiments.
Values are mmol/mol chlorophyll a + b.
Values are mol/mol.
Spectroscopic Analyses of the Different LHCI Complexes.
To gain insight into pigment alignment in the reconstituted complexes, 77-K fluorescence measurements were made. For the monomer produced with Lhca1, excitation at 440 nm gave a fluorescence maximum at 685–687 nm, whereas the monomer from Lhca4 had a maximum between 730 and 732 nm with a shoulder near 687 nm (Fig. 4A). From the long wavelength maximum, the latter monomeric complex most closely resembled both the r- and n-LHCI-730 heterodimer, both of which fluoresce most strongly at 732–734 nm. This finding is in accordance with the conclusion of Tjus et al. (9), who correlated 730 nm fluorescence with the presence of Lhca4 in spinach LHCI preparations. To test whether Chl-b is functional in energy transfer to Chl-a fluorescing at the long wavelength, emission upon 480-nm excitation was also measured. This excitation wavelength did not alter the shape or wavelength of the fluorescence maxima (data not shown). Calculations (not shown) of fluorescence yields obtained from samples containing the monomeric Lhca1 and Lhca4 complexes with those of LHCI-730 indicated that the fluorescence from the individual complexes nearly equals that of the dimeric complex. These data indicate that proper energy transfer among chlorophylls occurs in the monomeric as well as dimeric complexes. To further clarify how protein interactions affect the fluorescence properties, complexes obtained individually with Lhca1 and Lhca4 were simply mixed and kept on ice for 15 min prior to recording 77-K fluorescence spectra (Fig. 4A). The resulting emission spectrum shown therefore represents the sum of the two individual complexes. It is apparent that shifts in fluorescence wavelengths of a large population of the LHCI-730 Chls requires more intimate interactions of the subunits than can be achieved in a simple mixing experiment.
Figure 4.
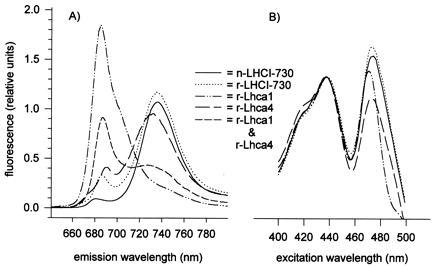
77-K fluorescence spectra of native and reconstituted LHCI complexes. In A fluorescence emission spectra are presented that had been obtained by excitation at 440 nm for samples as indicated. In B excitation spectra are shown for fluorescence emissions at 687 nm (reconstituted Lhca1) or 734 nm (reconstituted Lhca4, reconstituted and native LHCI-730) after normalizing the 438-nm values. Samples with 10 μg Chl per ml were measured.
To assess whether the similar arrays of pigments contribute equally to fluorescence at 687 nm (r-Lhca1) and 734 nm (r-Lhca4, r- and n-LHCI-730), excitation spectra at 77 K were recorded and normalized for the 438-nm values (Fig. 4B). It is obvious that Chl-b and carotenoids, excited primarily at 473 nm, most effectively promote the 734-nm fluorescence of r- and n-LHCI-730. Although the excitation spectrum of r-Lhca4 monomer is similar to that of the heterodimer, there is relatively more contribution to 734-nm fluorescence from Chl-a excitation. Monomers of r-Lhca1, however, differ considerably: absorption by Chl-b was blueshifted 3 nm, and the contribution of pigments absorbing above 487 nm to fluorescence at 687 nm was very low (Fig. 4B).
Circular dichroism measurements were performed to further resolve the effects of protein interactions on LHCI pigment properties. The CD spectra for r- and n-LHCI-730 were very similar (Fig. 5A), with identical minimas at 466, 495, 650, and 689 nm as well as maximas at 411, 445, and 668 nm. In contrast, spectra obtained with monomeric complexes differ considerably from those from the heterodimers and each other (Fig. 5B), illustrating also that pigment assembly depends on the identity of the apoproteins employed for reconstitution. As is the case for their fluorescence properties, the complex reconstituted from Lhca4 is more similar to the dimeric complex as reflected by the minimas at 650 and 689 nm (Fig. 5B). However, summation of the spectra obtained with each of the two monomeric complexes yielded a spectrum that differs markedly from that for the heterodimeric LHCI-730 complex (Fig. 5C). This, too, clearly demonstrates that profound changes in the organization of the pigments occur upon heterodimerization of the LHCI-730 subunits.
Figure 5.
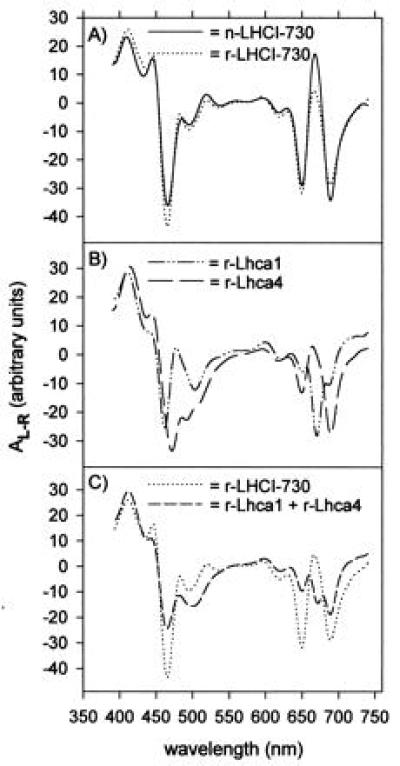
CD spectra of native and reconstituted LHCI pigment proteins. (A) Spectra for the native and reconstituted dimeric LHCI-730. (B) Corresponding spectra for monomeric complexes reconstituted from individual LHCI apoproteins. (C) The arithmetic sum of the two reconstituted monomeric complexes as well as the reconstituted dimeric complex. All spectra were obtained or calculated for samples with 50 μg Chl per ml.
DISCUSSION
We have demonstrated the reconstitution in vitro of a photosystem I antenna complex from the products of two tomato genes (Lhca1 and Lhca4) overexpressed in E. coli. We showed that each subunit binds pigments, but both products are required for the formation of LHCI-730 and attainment of characteristics of the native complex isolated from tomato thylakoids. This directly proves the heterodimeric nature of LHCI-730 and solves the longstanding problem of its protein composition.
Based on the molecular masses calculated from the nucleotide sequences of the respective LHC proteins, the r- and n-LHCI-730 heterodimer binds 14 Chl molecules. This value appears reasonable as the Chl-a/b ratios of about 2.5 could result from 10 Chl-a and 4 Chl-b molecules per heterodimer. With 14 Chl molecules for a protein complex of 44 to 45 kDa, the Chl-per-protein mass is intermediate between that determined for LHCII in the present study or elsewhere (e.g., ref. 16) and the PSII antenna CP29 (39). With regard to the carotenoid/Chl ratios for LHCI-730, the values for violaxanthin and lutein determined here are similar to those reported for a spinach LHCI subfraction enriched in LHCI-730 (13). Contrary to that study and the subtraction estimate of Siefermann-Harms (14), but in agreement with Thornber et al. (40), we found no neoxanthin associated with n-LHCI-730. If one relates the pigment contents of LHCI-730 to the protein mass, it becomes obvious that the carotenoids are present in nonstoichiometric amounts. This phenomenon exists with regard to most pigments in all pigment proteins we analyzed here and has been observed also for pigment proteins of PSII (40, 41) and LHCI preparations (13). One possible explanation may be the formation of larger aggregates in vivo, an attractive solution because an assembly of three LHCI-730 heterodimers could harbor one β-carotene, two violaxanthin, and five or six lutein molecules. A recent crosslinking study with isolated PSI did not detect such an aggregate (12), but its existence in vivo cannot be ruled out, as contact sites between individual heterodimers could be affected by detergent treatment and part of such an aggregate could be detached from PSI during its preparation. Nonstoichiometric carotenoid contents could also be explained by the fact that a single pigment-protein species comprises several subpopulations with heterogeneous pigment composition. The higher lutein content found in r-LHCI-730 as compared with n-LHCI-730 may also be the result of variability in pigment binding such as has been reported previously for LHCII (42, 43). Regardless of the reason of the nonstoichiometric carotenoid levels, the molar carotenoid/Chl ratio of about 0.2 for LHCI-730 in the present study is in accordance with ratios calculated for different LHCIIs (44), although somewhat higher values have been obtained by others (41, 45). Because of the absence or, at most, trace amounts of neoxanthin and high levels of violaxanthin and β-carotene, the pigment analyses indicate that LHCI-730 has its closest PSII relative in CP24, as was deduced earlier from sequence homology studies (46). As judged from CD spectra, the pigment organization in r- and n-LHCI-730 are very similar to each other and to those of LHCI-730 isolated from spinach and barley (7, 11-), pointing to similar pigment organizations among LHCI-730 of higher plants.
LHCI-730 emerges as the only known heterodimeric antenna complex of plants. It will be important to identify the domains of Lhca1 and Lhca4 that are engaged in protein–protein interactions and how dimerization promotes changes in pigment organization. For LHCII trimerization, protein motifs as well as a role of phospholipid have been identified (47–49). In LHCII induced to trimerize in the presence of additional lipids, new CD signals arise while the signals of the monomeric LHCII remain (49). In contrast, the CD signals of monomeric Lhca1 complexes are lost when Lhca1 assembles to form LHCI-730. The extensive pigment rearrangements and change of the spectroscopic properties resulting from interaction of the two Lhca proteins do not occur simply upon mixing of r-Lhca1 and r-Lhca4 subunits. This observation bears upon the in vivo pathway for LHCI-730 formation. Assembly of the constituent proteins during their thylakoid insertion in close spatial proximity together with stepwise pigment binding (50) could give rise to such a complex. However, because monomeric LHCI complexes have been detected as presumed precursors to oligomeric forms during the early stages of greening barley seedlings (51), a not-yet-identified assembly factor may be involved in the formation of LHCI-730.
The alteration of the spectroscopic properties of some pigments during dimerization, especially those attached to r-Lhca1, seems obvious from the fluorescence measurements as depicted in Fig. 4. Although it is clear that the spectral properties of the pigments are under the influence of specific protein–protein interactions, further contributions appear to be made through binding of additional pigments coincident with dimer formation. Unfortunately, our analyses are not yet unequivocal with regard to quantitation of the additional chlorophyll and xanthophyll in the heterodimer as compared with monomers. Monomeric complexes exhibit lower Chl/protein values (Table 1), but in these cases the protein determination is somewhat elevated by the presence of apoproteins that have not assembled pigments. Contamination of the heterodimeric complexes is very small and their pigment/protein ratios are much more certain. Nonetheless, it remains possible that both monomeric and heterodimeric complexes have lost some pigments during purification as has been described for LHCI-680 preparations (10). Still, there is a decrease in the Chl-a/b ratio of heterodimers as compared with the composite composition of monomeric r-Lhca1 plus r-Lhca4. Also, both r- and n-LHCI-730 exhibit enhanced fluorescence emission obtained from 473 nm of excitation (Fig. 4B) and more pronounced CD signals at 650 nm (Fig. 5). Together, the data strongly indicate that LHCI-730 heterodimerization is accompanied by assembly of additional Chl-b. It remains to be determined whether the additional pigment resides within the confines of membrane-spanning domains of one or both of the protein subunits or, alternatively, at the protein–protein interface.
Acknowledgments
We thank Dr. H. Bujard (Universität Heidelberg, Germany) for the pDS-vectors and Dr. E. Pichersky (University of Michigan) for the cDNAs of cab 6a and cab 11. For the pigment analyses by HPLC we are grateful to Dr. S. Sung (U.S. Department of Agriculture, Department of Forestry, Athens, GA). For valuable discussions we thank Dr. H. Paulsen (Universität Mainz, Germany). Financial support was from Department of Energy and U.S. Department of Agriculture grants to G.W.S. V.H.R.S. thanks the Deutsche Forschungsgemeinschaft for a fellowship.
ABBREVIATIONS
- Chl
chlorophyll
- DM
n-dodecyl β-d-maltoside
- LDS
lithium dodecylsulfate
- Lhc
light-harvesting apoprotein
- LHC
light-harvesting complex
- OG
n-octyl β-d-glucopyranoside
- PS
photosystem
References
- 1.Green B R, Durnford D G. Annu Rev Plant Physiol Plant Mol Biol. 1996;47:685–714. doi: 10.1146/annurev.arplant.47.1.685. [DOI] [PubMed] [Google Scholar]
- 2.Haworth P, Watson J L, Arntzen C J. Biochim Biophys Acta. 1983;724:151–158. [Google Scholar]
- 3.Schwartz E, Shen D, Aebersold R, McGrath J M, Pichersky E, Green B R. FEBS Lett. 1991;280:229–234. doi: 10.1016/0014-5793(91)80299-i. [DOI] [PubMed] [Google Scholar]
- 4.Jansson S. Biochim Biophys Acta. 1994;1184:1–19. doi: 10.1016/0005-2728(94)90148-1. [DOI] [PubMed] [Google Scholar]
- 5.Wolfe G R, Cunningham F X, Jr, Durnford D, Green B R, Gantt E. Nature (London) 1994;367:566–568. [Google Scholar]
- 6.Tan S, Cunningham F X, Gantt E. Plant Mol Biol. 1997;33:157–167. doi: 10.1023/a:1005715528297. [DOI] [PubMed] [Google Scholar]
- 7.Lam E, Ortiz W, Malkin R. FEBS Lett. 1984;168:10–14. [Google Scholar]
- 8.Knoetzel J, Svendsen I, Simpson D J. Eur J Biochem. 1992;206:209–215. doi: 10.1111/j.1432-1033.1992.tb16918.x. [DOI] [PubMed] [Google Scholar]
- 9.Tjus S E, Roobol-Boza M, Pålsson L-O, Andersson B. Photosynth Res. 1995;45:41–49. doi: 10.1007/BF00032234. [DOI] [PubMed] [Google Scholar]
- 10.Ikeuchi M, Hirano A, Inoue Y. Plant Cell Physiol. 1991;32:103–112. [Google Scholar]
- 11.Bassi R, Simpson D. Eur J Biochem. 1987;163:221–230. doi: 10.1111/j.1432-1033.1987.tb10791.x. [DOI] [PubMed] [Google Scholar]
- 12.Jansson S, Andersen B, Scheller H V. Plant Physiol. 1996;112:409–420. doi: 10.1104/pp.112.1.409. [DOI] [PMC free article] [PubMed] [Google Scholar]
- 13.Damm I, Steinmetz D, Grimme L H. In: Current Research in Photosynthesis. Baltscheffsky M, editor. II. Dordrecht, The Netherlands: Kluwer; 1990. pp. 607–610. [Google Scholar]
- 14.Siefermann-Harms D. Biochim Biophys Acta. 1985;811:325–355. [Google Scholar]
- 15.Lee A I-C, Thornber J P. Plant Physiol. 1995;107:565–574. doi: 10.1104/pp.107.2.565. [DOI] [PMC free article] [PubMed] [Google Scholar]
- 16.Kühlbrandt W, Wang D N, Fujiyoshi Y. Nature (London) 1994;367:614–621. doi: 10.1038/367614a0. [DOI] [PubMed] [Google Scholar]
- 17.Butler W L. Arch Biochem Biophys. 1961;93:413–422. doi: 10.1016/0003-9861(61)90287-9. [DOI] [PubMed] [Google Scholar]
- 18.Mullet J E, Burke J J, Arntzen C J. Plant Physiol. 1980;65:814–822. doi: 10.1104/pp.65.5.814. [DOI] [PMC free article] [PubMed] [Google Scholar]
- 19.Croce R, Zucchelli G, Garlaschi F M, Bassi R, Jennings R C. Biochemistry. 1996;35:8572–8579. doi: 10.1021/bi960214m. [DOI] [PubMed] [Google Scholar]
- 20.Plumley F G, Schmidt G W. Proc Natl Acad Sci USA. 1987;84:146–150. doi: 10.1073/pnas.84.1.146. [DOI] [PMC free article] [PubMed] [Google Scholar]
- 21.Cammarata K V, Schmidt G W. Biochemistry. 1992;31:2779–2789. doi: 10.1021/bi00125a019. [DOI] [PubMed] [Google Scholar]
- 22.Paulsen H, Rümler U, Rüdiger W. Planta. 1990;181:204–211. doi: 10.1007/BF02411539. [DOI] [PubMed] [Google Scholar]
- 23.Paulsen H, Hobe S. Eur J Biochem. 1992;205:71–76. doi: 10.1111/j.1432-1033.1992.tb16752.x. [DOI] [PubMed] [Google Scholar]
- 24.Paulsen H, Kuttkat A. Photochem Photobiol. 1993;57:139–142. doi: 10.1111/j.1751-1097.1993.tb02269.x. [DOI] [PubMed] [Google Scholar]
- 25.Jansson S, Pichersky E, Bassi R, Green B R, Ikeuchi M, Melis A, Simpson D J, Spangfort M, Staehelin L A, Thornber J P. Plant Mol Biol Rep. 1992;10:242–253. [Google Scholar]
- 26.Steinback K E, Mullet J E, Arntzen C J. In: Methods in Chloroplast Molecular Biology. Edelman M, Hallick R B, Chua N-H, editors. Amsterdam: Elsevier; 1982. pp. 863–872. [Google Scholar]
- 27.Schmid V, Schäfer C. Planta. 1994;192:473–479. [Google Scholar]
- 28.Bujard H, Gentz R, Lanzer D, Stüber D, Müller M, Ibrahimi I, Häuptle M-T, Dobberstein B. Methods Enzymol. 1987;155:416–433. doi: 10.1016/0076-6879(87)55028-5. [DOI] [PubMed] [Google Scholar]
- 29.Sambrook K, Fritch E F, Maniatis T. Molecular Cloning: A Laboratory Manual. Cold Spring Harbor, NY: Cold Spring Harbor Lab. Press; 1989. [Google Scholar]
- 30.Thayer S S, Björkman O. Photosynth Res. 1990;23:331–344. doi: 10.1007/BF00034864. [DOI] [PubMed] [Google Scholar]
- 31.Davies B H. In: Chemistry and Biochemistry of Plant Pigments. 2nd Ed. Goodwin T W, editor. Vol. 2. New York: Academic; 1976. pp. 38–165. [Google Scholar]
- 32.Paulsen H, Finkenzeller B, Kühlein N. Eur J Biochem. 1993;215:809–816. doi: 10.1111/j.1432-1033.1993.tb18096.x. [DOI] [PubMed] [Google Scholar]
- 33.Laemmli U K. Nature (London) 1970;227:680–685. doi: 10.1038/227680a0. [DOI] [PubMed] [Google Scholar]
- 34.Smith P K, Krohn R I, Hermanson G T, Mallia A K, Gartner F H, Provenzano M D, Fujimoto E K, Goeke N M, Olson B J, Klenk D C. Anal Biochem. 1985;150:76–85. doi: 10.1016/0003-2697(85)90442-7. [DOI] [PubMed] [Google Scholar]
- 35.MacKinney G. J Biol Chem. 1941;140:315–322. [Google Scholar]
- 36.Hoffman N E, Pichersky E, Malik V S, Castresana C, Ko K, Darr S C, Cashmore A R. Proc Natl Acad Sci USA. 1987;84:8844–8848. doi: 10.1073/pnas.84.24.8844. [DOI] [PMC free article] [PubMed] [Google Scholar]
- 37.Schmid V, Peter S, Schäfer C. Photosynth Res. 1995;44:287–295. doi: 10.1007/BF00048602. [DOI] [PubMed] [Google Scholar]
- 38.Compton S J, Jones C G. Anal Biochem. 1985;151:369–374. doi: 10.1016/0003-2697(85)90190-3. [DOI] [PubMed] [Google Scholar]
- 39.Giuffra E, Cugini D, Croce R, Bassi R. Eur J Biochem. 1996;238:112–120. doi: 10.1111/j.1432-1033.1996.0112q.x. [DOI] [PubMed] [Google Scholar]
- 40.Thornber J P, Peter G F, Morishige D T, Gómez G, Anandan S, Welty B A, Lee A, Kerfeld C, Takeuchi T, Preiss S. Biochem Soc Trans. 1993;21:15–18. doi: 10.1042/bst0210015. [DOI] [PubMed] [Google Scholar]
- 41.Bassi R, Pineau B, Dainese P, Marquardt J. Eur J Biochem. 1993;212:297–303. doi: 10.1111/j.1432-1033.1993.tb17662.x. [DOI] [PubMed] [Google Scholar]
- 42.Meyer M, Wilhelm C. Z Naturforsch. 1993;48:461–473. [Google Scholar]
- 43.Cammarata K, Plumley F G, Schmidt G W. Photosynth Res. 1992;33:235–250. doi: 10.1007/BF00030034. [DOI] [PubMed] [Google Scholar]
- 44.Ruban A V, Young A J, Pascal A A, Horton P. Plant Physiol. 1994;104:227–234. doi: 10.1104/pp.104.1.227. [DOI] [PMC free article] [PubMed] [Google Scholar]
- 45.Peter G F, Thornber J P. J Biol Chem. 1991;266:16745–16754. [PubMed] [Google Scholar]
- 46.Green B R, Pichersky E, Kloppstech K. Trends Biochem Sci. 1991;16:181–186. doi: 10.1016/0968-0004(91)90072-4. [DOI] [PubMed] [Google Scholar]
- 47.Kuttkat A, Hartmann A, Hobe S, Paulsen H. Eur J Biochem. 1996;242:288–292. doi: 10.1111/j.1432-1033.1996.0288r.x. [DOI] [PubMed] [Google Scholar]
- 48.Hobe S, Forster R, Klingler J, Paulsen H. Biochemistry. 1995;34:10224–10228. doi: 10.1021/bi00032a016. [DOI] [PubMed] [Google Scholar]
- 49.Hobe S, Prytulla S, Kühlbrandt W, Paulsen H. EMBO J. 1994;13:3423–3429. doi: 10.1002/j.1460-2075.1994.tb06647.x. [DOI] [PMC free article] [PubMed] [Google Scholar]
- 50.Plumley F G, Schmidt G W. Plant Cell. 1995;7:689–704. doi: 10.1105/tpc.7.6.689. [DOI] [PMC free article] [PubMed] [Google Scholar]
- 51.Dreyfuss B W, Thornber J P. Plant Physiol. 1994;106:841–848. doi: 10.1104/pp.106.3.841. [DOI] [PMC free article] [PubMed] [Google Scholar]