Abstract
The electronic excitations of naphthalene and a family of bridged naphthalene dimers are calculated and analyzed by using the Collective Electronic Oscillator method combined with the oblique Lanczos algorithm. All experimentally observed trends in absorption profiles and radiative lifetimes are reproduced. Each electronic excitation is linked to the corresponding real-space transition density matrix, which represents the motions of electrons and holes created in the molecule by photon absorption. Two-dimensional plots of these matrices help visualize the degree of exciton localization and explain the dependence of the electronic interaction between chromophores on their separation.
Relating electronic excitations of molecular aggregates to those of the individual chromophores is a long-standing fundamental problem with numerous applications to organic superlattices and biological complexes (1, 2).
Considerable effort has been devoted to clusters of the simplest aromatic molecules such as napthalene and benzene (3–7). Supersonic beam techniques have made it possible to study the excited-state dynamics and obtain detailed information about geometries and intermolecular interactions in these clusters (8–10). Naphthalene is one of the most thoroughly studied chromophores in crystals and in the gas phase both theoretically and experimentally (11–21). Calculations provided a test for quantum mechanical theories of molecular electronic structure (16, 17). In recent years, detailed information about naphthalene clusters has been obtained through high-resolution rotational spectroscopy analysis (22, 23). For example, structural information on naphthalene trimer has been extracted from rotational coherence spectroscopy (23). Excimer formation dynamics has been studied by Lim’s group through fluorescence spectroscopy (24–28). Excitonic interactions depend strongly on the distance and relative orientation of the transition moments of monomer units. The geometry can be obtained from high-resolution vibronic spectra and nonlinear Raman spectroscopy (10, 22, 29). Extensive study of benzene has been carried out as well. Recent interest focused on the structure and properties of benzene clusters (30–36). Isotopically mixed benzene clusters have been used in the investigation of intermolecular interactions. Discrete exciton spectra were observed for benzene dimers (9, 37).
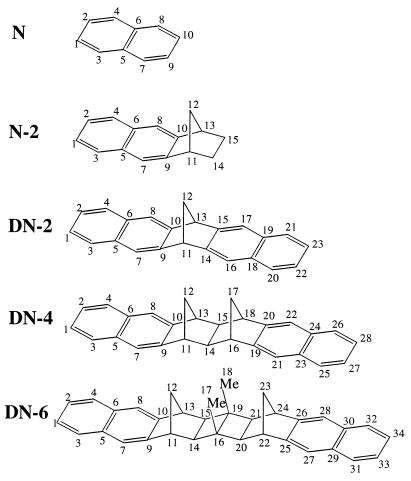
In this paper, we analyze the absorption spectra of naphthalene and a family of naphthalene-bridge-naphthalene systems DN-2, DN-4, and DN-6 (see Fig. 1) (38–41). These molecules may be regarded as naphthalene dimers where pairs of naphthalene chromophores are held at fixed distances and orientations by a rigid polynorbornyl-type bridge of variable length (two, four, or six σ bonds, respectively). The UV-spectra and radiative decay rates of these dimers have been measured (39–41) and interpreted by using a simple exciton model (42). Within this model, each excited state of the monomer generates two states in the dimer. The interaction between two monomers results in a Davydov splitting of the two dimer states. The estimated splitting by using the exciton model was found to be very small compared with the observed value. This discrepancy was attributed to the through-bond interaction mechanism (39–41). The exciton model (42) is based on the assumption that the interaction between chromophores is purely electrostatic and could be approximated by dipole–dipole coupling. All interchromophore charge-transfer processes are neglected. There is no simple way to directly test the validity of this approximation in molecular aggregates.
Figure 1.
Structures and atom labeling of naphthalene and bridged naphthalene dimer molecules.
The lowest excited state of the isolated naphthalene molecule has a rather negligible transition dipole (except for vibronic effects). The Frenkel–Davydov exciton model has been tested extensively in the studies of molecular crystals in the 1960s and 1970s. Several generalizations were made: multipole–multipole and electrostatic interactions were incorporated (43–45), monopole and charge-transfer-induced exciton interactions (46, 47) as well as exciton superexchange (48–51) were introduced. These concepts apply also to the monomer–monomer interactions with long or intermediate bridges.
In the present study, we compute the absorption of naphthalene dimers by using the Collective Electronic Oscillator (CEO) method, which allows the interpretation of optical spectra in terms of motions of electrons and holes in real space (53, 54). The calculations generate qualitatively correct absorption profiles for all molecules, in good agreement with experiment. In addition, real-space analysis of electronic modes clarified the excitonic nature of the electronic excitations and shows the limits of applicability of the simple exciton model for these aggregates.
Computational Algorithm; Collective Electronic Excitations in Real Space.
Optimal ground-state geometries of the molecules displayed in Fig. 1 were obtained at the AM1 level by using Gaussian-98 (52). The numerical CEO–intermediate neglect of differential overlap/spectroscopy (INDO/S) procedure has been described in detail elsewhere (53, 54). The ZINDO code was first used to generate the INDO/S Hamiltonian (55–58), which has been initially fitted for the configuration interaction singles level (57, 58). We next calculated the Hartree–Fock ground-state density matrices (59, 60), which serve as input for the CEO calculations. The CEO procedure (53, 54) was finally applied to compute the linear-absorption spectra and the relevant transition density matrices that constitute the electronic normal modes ξν, which connect the optical response with the underlying electronic motions. Each mode is a matrix representing the electronic transition between the ground state |g〉 and an electronically excited state |ν〉 and is associated with a particular line in the absorption spectrum. Its matrix elements are given by
 |
1 |
where cm+(cm) are creation (annihilation) operators of an electron at the mth atomic orbital, and |g〉 (|ν〉) is the ground (excited) state many-electron wavefunction. ξν can be obtained as eigenmodes of the linearized time-dependent Hartree–Fock equations of motion for the density matrix driven by the external field, totally avoiding the explicit calculation of many-electron wavefunctions. The eigenfrequencies Ων of these equations provide the optical transition frequencies (53, 54). The numerical effort involved in computing these eigenvalues and eigenvectors is greatly reduced by using the oblique Lanczos algorithm (61). Previously, we have used the density-matrix spectral moment algorithm (53, 54) for computing the eigenmodes. That algorithm is particularly suitable for off-resonant (static) response, where only transitions with nonzero oscillator strengths are calculated. We found that the oblique Lanczos algorithm is more efficient and provides a more accurate representation of the resonant response. In addition, it has lower memory requirements compared with the similar Arnoldi and Davidson techniques (61, 62) for non-Hermitian eigenvalues of sparse matrices.
The transition dipoles are calculated through μν= Tr(μξν) by using the dipole moment operator μmn = Σmnμmncm+cn. The oscillator strength is related to the transition dipole by
 |
2 |
me and e are mass and charge of electron, respectively, and h is Planck’s constant. fν satisfy the Thomas Reiche Kuhn sum rule ∑νfν = N, N being the number of optically-active electrons.
Assuming that the fluorescence is emitted from the lowest excited state, the radiative decay rate is given by
 |
3 |
where Ωl is the lowest excited state frequency, μl is the corresponding transition dipole moment, and c is the speed of light.
Because the relevant optical excitations are of π−π* type, we focus our analysis on the π-part of the transition density matrices (54). Their size is, therefore, equal to the number of carbon atoms, labeled according to Fig. 1. The diagonal elements (ξν)nn give the excess charge created at the nth atom by the transition to the νth electronic state. The off-diagonal elements (ξν)mn, also known as electronic coherences, represent the joint probability amplitude of creating an excess hole at n (x-axis) and an electron at m (y-axis). The coherences, which measure how far apart different atoms communicate, control the scaling of optical properties with molecular size (53, 54, 63). The extent of electronic coherences directly reflects the localization of an exciton created by optical excitation.
Electronic Excitations of Naphthalene.
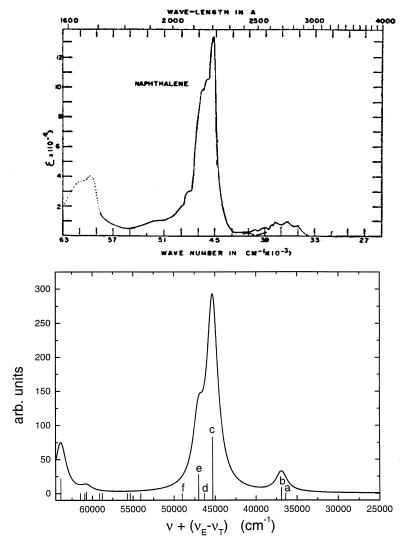
Experimentally, three electronic transitions are seen in the near-UV region for naphthalene (molecule N in Fig. 1). The first is a very weak transition to an excited singlet state of B2u symmetry with energy at 3.94 eV (1 eV = 1.602 × 10⁻¹⁹ J) and oscillator strength 0.002 (18). The next 4.34 eV transition with a moderate intensity (oscillator strength 0.18) has been assigned by Sponer and Cooper as 1Ag→21B1u transition (15). The strongest 5.62 eV transition with oscillator strength 1.3 is to a B3u state (11, 19). The interpretation of these states in terms of molecular orbitals has been given by Pariser (16) and by Hummel and Ruedenberg (17).
Our calculations generate seven levels with noticeable oscillator strengths (3.91 eV, 3.98 eV, 5.02 eV, 5.23 eV, 6.93 eV, 7.32 eV, and 7.61 eV). In addition, we obtained many other forbidden (dark) states. The calculated and experimental spectra are summarized in Table 1. The frequency of the first weak transition (3.91 eV) is in an excellent agreement with experiment. The second (3.98 eV) and the third (5.02 eV) levels are red shifted by 0.36 and 0.6 eV; however, their oscillator strengths are correct. The overall absorption profile Fig. 2 is in good agreement with experiment (11, 19).
Table 1.
Calculated and experimental transition energies (Ωv) of naphthalene.
| Label | Ωv (eV) (calculation) | Ωv (eV) (solution)* | Ωv (eV) (vapor)† |
|---|---|---|---|
| a | 3.91 (0.004) | 3.94 (0.002) | 3.97 (0.002) |
| b | 3.98 (0.14) | 4.34 (0.18) | 4.45 (0.1) |
| c | 5.02 (1.3) | 5.62 (1.2) | 5.89 (1.3) |
| d | 5.14 (0) | ||
| e | 5.23 (0.44) | 6.14 (0.3) | |
| f | 5.48 (0) | ||
| 6.1 (0) | |||
| 6.26 (0) | |||
| 6.31 (0) | |||
| 6.69 (0) | |||
| 6.73 (0) | |||
| 6.93 (0.04) | 6.51 (0.2) | 6.53 (0.1) | |
| 6.95 (0) | |||
| 7.02 (0) | |||
| 7.32 (0.35) | 7.41 (0.6) | ||
| 7.61 (0.005) |
Figure 2.
Absorption spectra of naphthalene. (Upper) Experiment (11). (Lower) Computed absorption profile (blue shifted by Δν = 5,000 cm−1 to match the frequency of the strongest peak. The vertical lines represent the corresponding oscillator strength. The electronic modes of levels marked with a, b, c, d, e, and f are shown in Fig. 5.
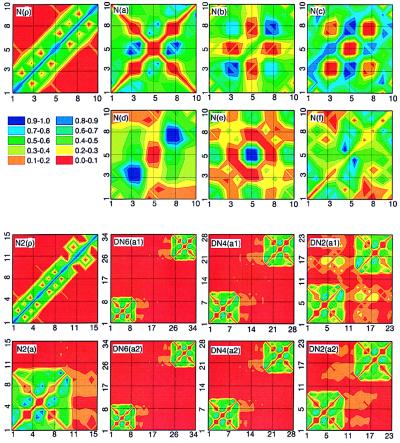
To establish the link between the absorption peaks and the underlying electronic motions, we next analyze the electronic modes (transition density matrices) of the first six electronic transitions labeled a−f. These are displayed in the top two rows of Fig. 5. The color code is shown in the second row. The ground-state density matrix of naphtalene [N(ρ̄)] is dominated diagonal and near-diagonal elements responsible for the atomic charges and bond orders (64) respectively. The charges are uniformly distributed, whereas atoms 1–2, 5–6, and 9–10 are bonded more strongly than the other carbon atoms. Ground-state charge distribution and chemical bonding analysis have been reported in ref. 65. Contour plots of the electronic modes immediately reveal the nature of each transition. They are delocalized over the whole molecule; however, each mode has its own characteristic distribution of charges (diagonal elements) and coherences (off-diagonal elements). The a mode [N(a)] involves only coherences and does not perturb the charge distribution (small diagonal elements) and carries therefore a very weak oscillator strength. The strongest coherences are between atoms 3–5, 4–6, 7–5, and 8–7. The b mode [N(b)] is dominated by induced charges on atoms 3, 4, 7, 8, and coherences between them. The strong charges induced on atoms 1–2 and 9–10 at the molecular ends are the reason for the large oscillator strength of the mode [N(c)]. The d mode [N(d)] is dominated by charges on atoms 3, 4, 7, 8, similar to b. It has Ag-type symmetry and therefore a vanishing transition dipole. The e mode [N(e)] is localized on atoms 5, 6. Its transition dipole is perpendicular to the long axis. The f transition [N(f)] is a second Ag-type mode dominated by 5–6 and 6–5 atomic coherences.
Figure 5.
Contour plots of the ground-state density matrices and electronic modes of naphthalene (the first and the second rows) and the DN-n family (the third and the fourth rows). The x(y) axes label hole (electron) coordinates. Labels indicate the molecule (Fig. 1) and the electronic mode (Figs. 2–4) [e.g., N(ρ) is ground state of naphtalene, DN6(a1) is mode 1a of DN-6]. Mode frequencies are given in Tables 1 and 2. The color code is shown in the second row.
Electronic Excitations of Naphthalene Dimers.
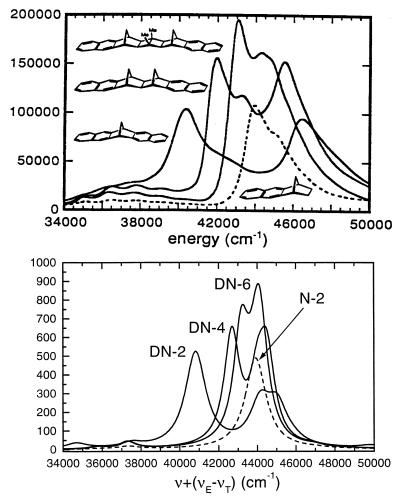
We next turn to the polynorbornane-bridged naphthalene dimer series (DN-2, DN-4, and DN-6) with varying interchromophore distance. We have also considered the monomer N-2 (naphtalene with the polynorbornane group) to identify the effects of the bridge in the spectra. The naphthalene molecule that is distorted by its chemical binding is analogous to the “site-adapted molecule” concept used for molecular crystal excitons (66). Fig. 3 compares our calculated UV spectra with low-resolution experimental absorption of N-2 and DN-n. The computed trends are consistent with experiment. The dimeric splitting resulting from the major naphthalene absorption band 1Ag→21B3u electronic transition of 5.62 eV can be clearly observed. With increasing the bridge length (from DN-2 to DN-6), the two primary peaks get closer, indicating that the coupling becomes smaller, as expected. However, other peaks in these spectra (e.g., the low-frequency features) could not be easily identified and linked to monomer transitions.
Figure 3.
UV absorption spectra of the DN-n series. (Upper) Experiment (39). (Lower) Computed absorption profile (blue shifted by Δν = 5,000 cm−1).
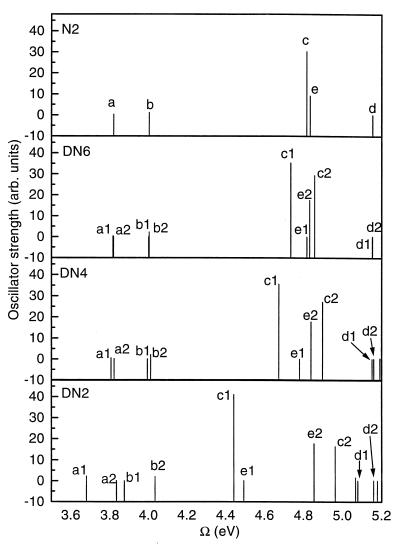
The computed frequencies and oscillator strengths of the N-2 and DN-n molecules are listed in Table 2 and plotted as stick spectra in Fig. 4. The absorption peaks of N-2 shown in the second column may be easily related to those of N (Table 1). The polynorbornane group breaks the symmetry of naphtalene and causes significant changes in the oscillator strengths of the weak transitions. On the other hand, the frequency shifts are small, except for e, which is red shifted by 0.4 eV and moves next to the major absorption peak c. Columns 2–4 show that each monomer peak splits into two transitions in the dimer spectra (e.g., a→a1, a2). As expected, the splitting increases with decreasing bridge length. In addition, the center of each pair of lines is shifted significantly to the red in the DN-2 dimer (see Fig. 4), which cannot be explained by using a simple exciton model. The correspondence among monomer and dimers a and b transitions is clearly seen; however, the assignment of the high-frequency features (c- f) is not obvious.
Table 2.
Calculated transition energies (Ωv) for DN-n naphthalene dimers
| Label | N-2 (eV) | DN-6 (eV) | DN-4 (eV) | DN-2 (eV) |
|---|---|---|---|---|
| a1 | 3.82 (0.01) | 3.815 (0.02) | 3.805 (0.03) | 3.68 (0.11) |
| a2 | 3.818 (0.01) | 3.821 (0.01) | 3.83 (0.003) | |
| b1 | 4.0 (0.05) | 4.0 (0) | 3.99 (0) | 3.87 (0) |
| b2 | 4.003 (0.11) | 4.01 (0.1) | 4.03 (0.09) | |
| c1 | 4.82 (1.44) | 4.73 (1.67) | 4.67 (1.7) | 4.44 (1.95) |
| e1 | 4.83 (0.44) | 4.82 (0) | 4.78 (0) | 4.49 (0) |
| e2 | 4.83 (0.83) | 4.84 (0.85) | 4.85 (0.84) | |
| c2 | 4.86 (1.4) | 4.90 (1.29) | 4.96 (0.78) | |
| d1 | 5.15 (0.004) | 5.152 (0) | 5.15 (0) | 5.07 (0.07) |
| d2 | 5.154 (0.007) | 5.16 (0.006) | 5.08 (0) | |
| f1 | 5.21 (0.01) | 5.204 (0.01) | 5.19 (0.02) | 5.16 (0.002) |
| f2 | 5.205 (0.01) | 5.20 (0.01) | 5.18 (0) |
The corresponding oscillator strengths (fv) are given in parentheses.
Figure 4.
Oscillator strengths fν vs. mode frequencies Ων of the DN-n family shown in Fig. 1. Each monomer state splits into two in the dimers, e.g., level a splits to a1 and a2, etc. Transition density matrices (electronic modes) of the labeled peaks are displayed as contour plots in Figs. 5–7.
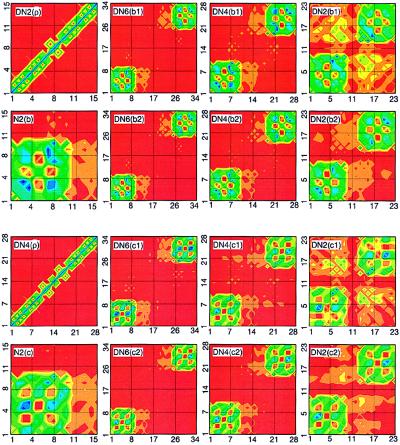
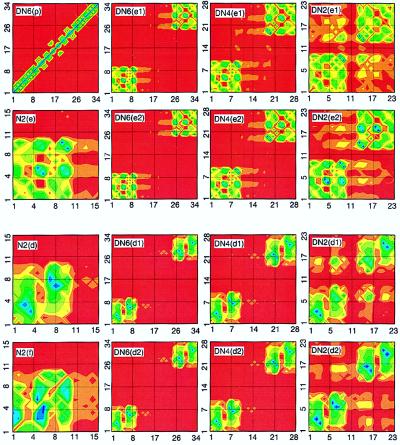
To identify the dimer transitions we next display the corresponding electronic modes in real space. N2(ρ) in Fig. 5 shows the ground-state density matrix of N-2. The naphtalene (atoms 1–10) and bridge (atoms 11–15) parts are clearly distinguishable. In the same way, the monomer and bridge regions are separable in the dimer’s ground state density matrices (N2(ρ) and DN4(ρ) in Fig. 6 and DN6(ρ) in Fig. 7).
Figure 6.
Contour plots of the ground state density matrices and b and c electronic modes of DN-n molecules. Labels indicate the molecule (Fig. 1) and the electronic mode (Figs. 2–4). Mode frequencies are given in Tables 1 and 2.
Figure 7.
Contour plots of the ground state density matrices and d and e electronic modes of DN-n molecules. Labels indicate the molecule (Fig. 1) and the electronic mode (Figs. 2–4). Mode frequencies are given in Tables 1 and 2.
Mode a of N-2 [N2(a)] is similar to N(a); however, the symmetry is broken and the distribution of coherences is slightly different. As expected, the bridge does not participate in the optical excitation. Nevertheless, a weak electron transfer (off-diagonal coherence) from the bridge to the naphtalene is seen. DN6(a1) and DN6(a2) show a pair of DN-6 dimer states corresponding to the a mode of N-2. The corners of the plot represent the monomers. They are separated by the large bridge and are completely decoupled, i.e., there are no off-diagonal coherences between monomers. a1 and a2, therefore, are symmetric and antisymmetric combinations of the monomers’ excited-state wavefunctions. The interaction between monomers is completely electrostatic and very weak, resulting in a small 23-cm−1 splitting. DN4(a1) and DN4(a2) show a1 and a2 modes of DN-4. Compared with DN-6, there is a very weak long-range electronic coherence between monomers in this molecule. The chromophores are closer, and the dipole–dipole interaction is much stronger, leading to a larger 130-cm−1 splitting, which is typical in the spectra of J-aggregates and molecular crystals (67, 68). DN2(a1) and DN2(a2) show a1 and a2 modes of DN-2. These pictures are drastically different from the other dimers. Bringing monomers in a close proximity results in large off-diagonal coherences, which is a signature of electronic delocalization between chromophores (i.e., charge-separation processes where the electron and hole reside on different monomers become allowed). This leads to a dramatic increase of the splitting (1,250 cm−1). We further note that the a1 mode has much stronger interchromophore coherences compared with the a2 mode. It is therefore shifted significantly to the red, whereas the frequency of a2 does not shift. The center of mass of the two lines thus has an overall red shift.
The first and second rows of Fig. 6 show the b-modes in N-2 and the DN-n family. All trends observed in the dimer a-modes apply to b as well. The variation of splitting (24 cm−1, 140 cm−1, and 1,300 cm−1) reflects the increased dipole–dipole coupling in the DN−4 molecule and subsequently the coherence enhancement of interaction between chromophores in DN−2. The closely lying c and e modes of N-2 result in the four transitions in the dimer spectra (see Fig. 4). The third and the fourth rows of Fig. 6 and the first and second rows of Fig. 7 immediately allow identification of these transitions. The left and right transitions are c1 and c2, whereas the two states in the middle are e-type. Although the real-space picture is similar to the a and b transitions, the c-state splitting (1,000 cm−1, 1,800 cm−1, and 4,200 cm−1) and the e-state splitting (120 cm−1, 480 cm−1, and 2,912 cm−1) are strongly enhanced by repulsion among these four states. The computed and experimental data for the c-state splitting are listed in Table 3. The general trends are recovered; however, computations somewhat underestimate the experimentally observed values. This may be attributed to solvent enhancement of interaction between monomers, vibronic coupling, the formation of polarons, or the accuracy of INDO/S Hamiltonian used in this study.
Table 3.
Calculated and experimental excitonic splitting Δ and radiative rate constants kr for DN-n naphthalene dimers
| Compound | Δ (eV) (cal.) | Δ (eV) (exp.)* | 106kτ (s−1) (cal.) | 106kr (s−1) (exp.)† |
|---|---|---|---|---|
| N-2 | 2.4 | 4.0 | ||
| DN-2 | 0.52 | 0.75 | 20.5 | 17.0 |
| DN-4 | 0.23 | 0.45 | 5.1 | 7.1 |
| Dn-6 | 0.13 | 0.17 | 3.3 | 4.1 |
Our analysis could be extended to other high-frequency states. For example, the electronic modes of d-transition, displayed in the third and the forth rows of Fig. 7, are similar to the a and b transitions. The computed splitting (12 cm−1, 70 cm−1, and 660 cm−1) is even smaller than that computed for the a and b modes.
Discussion
Using the CEO technique, we have calculated the absorption spectra of naphthalene and a family of rigidly linked naphtalene dimer DN-2, DN-4, and DN-6. Overall, the calculated absorption lineshapes are in good agreement with experiment. Two-dimensional representation of the transition density matrices underlying the absorption peaks reveals the nature of the monomer and dimer states and gives direct visualization of intermolecular interactions. Excitonic effects are clearly identified.
The exciton (Frenkel) model is appropriate for DN-4 and DN-6. In DN-6, the electrostatic coupling is very weak because of the long bridge distance, whereas DN-4 represents a typical molecular aggregate (67, 68). The Frenkel Hamiltonian for DN-4 and DN-6 may be built by using two states for a, b, and d and four states for the c and e transitions. The exciton model completely breaks down for DN-2, which shows a strong electronic coherence between chromophores. The conclusion of Scholes et al. (39–41) that the direct through-space orbital overlaps dominate the absorption spectroscopy only for DN-2 is confirmed by our analysis.
The variations of the radiative rates in N-2 and DN-n are fully consistent with this picture. The computed (Eq. 3) and experimental radiative decay rates constants for bridged naphthalene dimer are shown in Table 3. These results provide a check for the applicability of the Frenkel exciton model to the three types of dimers as well as the role of vibronic coupling. The enhancement ratio n = 1.4 of the calculated kr for DN-6 compared with N-2 can be attributed to the superradiance in Frenkel exciton systems. The angle between the transition dipoles in DN-6 φ = 112°, and the superradiance factor predicted by the Frenkel exciton model yields 2cos2φ = 1.4, which coincides with the calculated value. This implies that the Frenkel exciton model constitutes a good approximation for DN-6, which is consistent with the absence of coherences between monomers. The ratio of kr of DN-4 and DN-6 dimers is 1.5, whereas the Frenkel exciton model would give 1 because the angle between the dipoles is about the same for both dimers. This deviation from the Frenkel exciton model for DN-4 can be attributed to the small off-diagonal coherences between monomers that are clearly seen in Fig. 5. These coherences are much more pronounced for DN-2, which explains the much larger ratio (6.2) of the radiative rates for DN-2 compared with DN-6. These trends reflect the general propensity that the optically induced coherence increases the transition dipoles of the corresponding excited states. This can be rationalized by the following argument: in long conjugated polymer chains where there is no coherence between carbon atoms whose distance is larger than the coherence size, the oscillator strength scales ≈N with the number N of the carbon atoms (69, 70). For shorter chains, where the coherence between all carbon atoms is pronounced because of confinement effects, the oscillator strength scales as ≈N3 (69, 70). This faster scaling constitutes a direct signature of the increase of the oscillator strength because of the delocalization and electronic coherences. The larger experimental value of kr for N-2 may be attributed to vibronic coupling of the lowest excited state to the next state that has a five times larger oscillator strength (see Table 2). The smaller experimental compared with calculated value of kr for DN-2 can also be attributed to vibronic coupling to the next excited state, which in this case is almost dark. A more detailed analysis of vibronic coupling goes beyond the scope of the present work. The differences between the experimental and calculated radiative decay rates can be attributed to polaronic as well as static disorder effects, which originate from solvent motions with different time scales. It has been shown (71, 72) that the two mechanisms affect the radiative rate of Frenkel exciton systems in a similar way.
Acknowledgments
We thank Dr. G. D. Scholes for most useful discussions and Dr. E. V. Tsiper for implementing the oblique Lanczos algorithm for the CEO procedure. The support of the National Science Foundation and the U.S. Air Force office of scientific research is gratefully acknowledged.
Abbreviation
- CEO
Collective Electronic Oscillator method
Footnotes
This paper was submitted directly (Track II) to the PNAS office.
References
- 1.Pullerits T, Sundström V. Acc Chem Res. 1996;29:381–389. [Google Scholar]
- 2.Sundström V, Pullerits T, van Grondelle R. J Phys Chem B. 1999;103:2327–2346. [Google Scholar]
- 3.Craig D. Adv Quantum Chem. 1999;34:1–50. [Google Scholar]
- 4.Hong H K, Kopelman R. J Chem Phys. 1972;57:3888–3898. [Google Scholar]
- 5.Ochs F W, Kopelman R. J Chem Phys. 1977;66:1599–1604. [Google Scholar]
- 6.Kopelman R. In: Excited States. Lim E C, editor. II. New York: Academic; 1975. pp. 33–110. [Google Scholar]
- 7.Johnson C K, Small G J. In: Excited States. Lim E C, editor. Vol. 6. New York: Academic; 1982. pp. 97–224. [Google Scholar]
- 8.Beck S M, Powers D E, Hopkins J B, Smalley R E. J Chem Phys. 1980;73:2019–2028. [Google Scholar]
- 9.Börnsen K O, Lin S H, Selzle H L, Schlag E W. J Chem Phys. 1989;90:1299–1306. [Google Scholar]
- 10.Wessel J E, Syage J A. J Phys Chem. 1990;94:737–739. [Google Scholar]
- 11.Klevens H B, Platt J R. J Chem Phys. 1949;17:470–484. [Google Scholar]
- 12.McClure D S. J Chem Phys. 1954;22:1668–1675. [Google Scholar]
- 13.McClure D S. J Chem Phys. 1956;24:1–12. [Google Scholar]
- 14.Porter G, Wright F J. Trans Faraday Soc. 1955;51:1205–1211. [Google Scholar]
- 15.Sponer H, Cooper C D. J Chem Phys. 1955;23:646–651. [Google Scholar]
- 16.Pariser R. J Chem Phys. 1956;24:250–268. [Google Scholar]
- 17.Hummel R L, Ruedenberg K. J Phys Chem. 1962;66:2334–2359. [Google Scholar]
- 18.Craig D P, Hollas J M, Redies M F, Wait S C. Philos Trans R Soc London A. 1961;253:543–568. [Google Scholar]
- 19.George G A. J Mol Spectrosc. 1968;26:67–71. [Google Scholar]
- 20.Hanson D M. J Chem Phys. 1970;52:3409–3418. [Google Scholar]
- 21.Hunziker H E. J Chem Phys. 1972;56:400–403. [Google Scholar]
- 22.Schaeffer M W, Kim W, Maxton P M, Romascan J, Felker P M. Chem Phys Lett. 1995;242:632–638. [Google Scholar]
- 23.Benharash P, Gleason M J, Felker P M. J Phys Chem. 1999;103:1442–1446. [Google Scholar]
- 24.Saigusa H, Lim E C. J Chem Phys. 1995;103:8793–8804. [Google Scholar]
- 25.Saigusa H, Lim E C. J Phys Chem. 1994;98:13470–13475. [Google Scholar]
- 26.Saigusa H, Lim E C. Acc Chem Res. 1996;29:171–178. [Google Scholar]
- 27.Saigusa H, Lim E C. J Phys Chem. 1995;99:15738–15747. [Google Scholar]
- 28.Saigusa H, Sun S, Lim E C. J Phys Chem. 1992;96:10099–10101. [Google Scholar]
- 29.Syage J A, Wessel J E. J Chem Phys. 1988;89:5962–5963. [Google Scholar]
- 30.Saik V O, Lipsky S. J Phys Chem. 1995;99:4406–4413. [Google Scholar]
- 31.Saik V O, Lipsky S. J Phys Chem. 1995;99:10471–10483. [Google Scholar]
- 32.Shinohara H, Nishi N. J Chem Phys. 1989;91:6743–6751. [Google Scholar]
- 33.Whetten R L, Fu K J, Grant E R. J Chem Phys. 1983;79:2626–2640. [Google Scholar]
- 34.Engkvist O, Hobza P, Selzle H L, Schlag E W. J Chem Phys. 1999;110:5758–5762. [Google Scholar]
- 35.Hashimoto T, Nakano H, Hirao K. THEOCHEM. 1998;451:25–33. [Google Scholar]
- 36.Christiansen O, Hättig C, Jorgensen P. Spectrochim Acta Part A. 1999;55:509–524. [Google Scholar]
- 37.Hopkins J B, Powers D E, Smalley R E. J Phys Chem. 1981;85:3739–3742. [Google Scholar]
- 38.Strickler S J, Cormier R A, Connolly J S. Int J Quantum Chem. 1991;39:345–352. [Google Scholar]
- 39.Scholes G D, Ghiggino K P, Oliver A M, Paddon-Row M N. J Am Chem Soc. 1993;115:4345–4349. [Google Scholar]
- 40.Clayton A H A, Scholes G D, Ghiggino K P, Paddon-Row M N. J Phys Chem. 1996;100:10912–10918. [Google Scholar]
- 41.Scholes G D, Turner G O, Ghiggino K P, Paddon-Row M N, Piet J J, Schuddeboom W, Warman J M. Chem Phys Lett. 1998;292:601–606. [Google Scholar]
- 42.Kasha M, Rawls H R, Ashaf El-Bayoumi M. Pure Appl Chem. 1965;11:371–392. [Google Scholar]
- 43.McClure S, Schnepp O. J Chem Phys. 1955;23:1575–1587. [Google Scholar]
- 44.Fox D, Schnepp O. J Chem Phys. 1955;23:767–775. [Google Scholar]
- 45.Dexter D L, Knox R S. Excitons. New York: Wiley; 1965. [Google Scholar]
- 46.Jortner J, Rice S A. Physics and Chemistry of the Organic Solid State. III. New York: Wiley; 1967. p. 200. [Google Scholar]
- 47.Jortner J, Rice S A. J Chem Phys. 1966;44:3364–3374. [Google Scholar]
- 48.Kopelman R. J Chem Phys. 1967;47:2631–2648. [Google Scholar]
- 49.Colson S D, Kopelman R, Robinson G W. J Chem Phys. 1967;47:27–30. [Google Scholar]
- 50.Bernstein E R, Colson S D, Kopelman R, Robinson G W. J Chem Phys. 1968;48:5596–5610. [Google Scholar]
- 51.McConell H M. J Chem Phys. 1961;35:508–515. [Google Scholar]
- 52.Frish M J, Trucks G W, Schlegel H B, Scuseria G E, Robb M A, Cheeseman J R, Zakrzewski V G, Montgomery J A, Stratmann R E, Burant J C, et al. gaussian 98. Pittsburgh: Gaussian; 1999. [Google Scholar]
- 53.Mukamel S, Tretiak S, Wagersreiter T, Chernyak V. Science. 1997;277:781–787. [Google Scholar]
- 54.Tretiak S, Chernyak V, Mukamel S. J Am Chem Soc. 1997;119:11408–11419. [Google Scholar]
- 55.Pople J A, Segal G A. J Chem Phys. 1965;43:S136–S151. [Google Scholar]
- 56.Pople J A, Beveridge D L, Dobosh P. J Chem Phys. 1967;47:2026–2033. [Google Scholar]
- 57.Ridley J, Zerner M C. Theor Chim Acta. 1973;32:111–134. [Google Scholar]
- 58.Zerner M C, Loew G H, Kirchner R F, Mueller-Westerhoff U T. J Am Chem Soc. 1980;102:589–599. [Google Scholar]
- 59.McWeeny R, Sutcliffe B T. Methods of Molecular Quantum Mechanics. New York: Academic; 1976. [Google Scholar]
- 60.Davidson E R. Reduced Density Matrices in Quantum Chemistry. New York: Academic; 1976. [Google Scholar]
- 61.Saad Y. Numerical Methods for Large Eigenvalue Problems. Manchester, U.K.: Manchester University Press; 1992. [Google Scholar]
- 62.Davidson E R. J Comput Phys. 1975;17:87–94. [Google Scholar]
- 63.Tretiak S, Chernyak V, Mukamel S. J Phys Chem B. 1998;102:3310–3315. [Google Scholar]
- 64.Reed A E, Weinhold F. J Chem Phys. 1986;84:5687–5705. [Google Scholar]
- 65.Galvez J. THEOCHEM. 1998;429:255–264. [Google Scholar]
- 66.Robinson G W. Annu Rev Phys Chem. 1970;21:429–474. [Google Scholar]
- 67.Pope M, Swenberg C E. Electronic Processes in Organic Crystals. Oxford University Press, Oxford, New York: Clarendon Press; 1982. [Google Scholar]
- 68.Silinsh E A, Čápek V. Organic Molecular Crystals. American Institute of Physics, New York: AIP Press; 1994. [Google Scholar]
- 69.Tretiak S, Chernyak V, Mukamel S. Phys Rev Lett. 1996;77:4656–4659. doi: 10.1103/PhysRevLett.77.4656. [DOI] [PubMed] [Google Scholar]
- 70.Tretiak S, Chernyak V, Mukamel S. J Chem Phys. 1996;105:8914–8928. [Google Scholar]
- 71.Meier T, Zhao Y, Chernyak V, Mukamel S. J Chem Phys. 1997;107:3876–3893. [Google Scholar]
- 72.Chernyak, V., Meier, T., Tsiper, E. V. & Mukamel, S. (1999) J. Phys. Chem., in press.


