

Abstract
Development of the mammalian CNS requires formation and stabilization of neuronal circuits and synaptic connections. Sensory stimulation provided by the environment orchestrates neuronal circuit formation in the waking state. Endogenous sources of activation are also implicated in these processes. Accordingly we hypothesized that sleep, especially rapid eye movement sleep (REMS), the stage characterized by high neuronal activity that is more prominent in development than adulthood, provides endogenous stimulation, which, like sensory input, helps to stabilize and refine neuronal circuits during CNS development. Young (Y: postnatal day (PN) 16) and adolescent (A: PN44) rats were rapid eye movement sleep-deprived (REMSD) by gentle cage-shaking for only 4 h on 3 consecutive days (total 12 h). The effect of REMS deprivation in Y and A rats was tested 3-7 days after the last deprivation session (Y, PN21-25; A, PN49-53) and was compared with younger (immature, I, PN9-12) untreated, age-matched, treated and normal control groups.
REMS deprivation negatively affected the stability of long-term potentiation (LTP) in Y but not A animals. LTP instability in Y-REMSD animals was similar to the instability in even the more immature, untreated animals. Utilizing immunoblots, we identified changes in molecular components of glutamatergic synapses known to participate in mechanisms of synaptic refinement and plasticity. Overall, N-methyl-d-aspartate receptor subunit 2B (NR2B), N-methyl-d-aspartate receptor subunit 2A, AMPA receptor subunit 1 (GluR1), postsynaptic density protein 95 (PSD-95), and calcium/calmodulin kinase II tended to be lower in Y REMSD animals (NR2B, GluR1 and PSD-95 were significantly lower) compared with controls, an effect not present in the A animals. Taken together, these data indicate that early-life REMS deprivation reduces stability of hippocampal neuronal circuits, possibly by hindering expression of mature glutamatergic synaptic components. The findings support a role for REMS in the maturation of hippocampal neuronal circuits.
Keywords: synaptic plasticity, rat, CaMKII, NMDA, AMPA, PSD-95
The mammalian CNS relies on precise neuronal circuits to function properly. These circuits are assembled during development by formation and stabilization of synaptic connections between neurons. Refinement of neuronal connections in the developing CNS depends on synaptic plasticity mechanisms whereby a synapse, if its presynaptic terminal is active at the same time as the postsynaptic cell, is reinforced. In contrast, a synapse whose pre- and post-terminal firing is not coordinated is eliminated (Katz and Shatz, 1996)
Long-term potentiation (LTP) is a synaptic plasticity model widely used to study synaptic changes underlying memory formation in adults and refinement of neuronal circuits in development (Malenka, 1994; Bear, 1996; Malenka and Nicoll, 1999). LTP instability in the developing hippocampus is associated with immature and unstable synapses. Reversal of LTP with low-frequency stimulation (LFS) in the hippocampus is developmentally regulated, with a greater susceptibility at immature (I) ages (postnatal day, (PN) 9-21) (Kramar and Lynch, 2003). Accordingly, LTP stability (resistance to reversal by LFS) can be regarded as a dependable measure of the developmental stage of synapse formation and refinement.
Glutamatergic synapses mediate synaptic excitation in the hippocampus and changes in their signaling efficacy are the basis for several neural processes such as brain maturation, memory, and excitotoxicity (Lissin et al., 1998; Malenka and Bear, 2004; Choi, 1994). Synaptic composition of glutamatergic synapses (receptors and associated proteins) is regulated by activity during development and adulthood (Desai et al., 2002; Ehlers, 2003). To mention a few of those changes, functional N-methyl-d-aspartate receptors (NMDARs) consist of complexes containing two obligatory N-methyl-d-aspartate receptor subunit 1 (NR1) subunits and one or several NR2 (N-methyl-d-aspartate receptor subunit 2 A-D) subunits. NR2 subunits confer NMDARs with different pharmacological and functional properties and also couple them to distinct intracellular signaling machineries (Rubio and Wenthold, 1997). For instance, NR1/NR2B heteromers produce the largest currents, whereas NR1/NR2A heteromers are the least glutamate-sensitive receptors (Monyer et al., 1992, 1994). It has been shown that through the first 3 weeks of postnatal development in rats, a dramatic increase in NR2A subunit expression occurs that is accompanied by a substantial decrease of the NR2B subunit (Petralia et al., 2005; Sans et al., 2000). Another glutamatergic receptor, the AMPA receptor (AMPAR) is a tetramer composed of various combinations of four different subunits (AMPA receptor subunit 1 (GluR1)-GluR4). The GluR1 subunit is strongly regulated by the intensity of synaptic activity (Passafaro et al., 2001). Proteins associated with glutamatergic receptors are also modified by activity (Bolton et al., 2000; Perez-Otano and Ehlers, 2004). PSD-95 (postsynaptic density protein 95) is a scaffolding protein of the postsynaptic density matrix involved in anchoring and linking NMDARs to intracellular signaling pathways. Expression of PSD-95 is also regulated developmentally between PN10-15 (Sans et al., 2000). Furthermore, in vivo analysis has shown a large increase in calcium/calmodulin kinase II (CaMKII) expression during PN10-35. This some-what later expression of CaMKII correlates with spine production and spine stability (Petralia et al., 2005).
Sleep in mammals is composed of two major stages, rapid eye movement sleep (REMS) and non-rapid eye movement sleep (NREMS). REMS is a state of high neuronal activity, more abundant in the young of almost every mammalian species than in the adult. This finding led to the hypothesis that REMS plays a role in CNS development (Roffwarg et al., 1966), a time when neuronal activity is recasting neuronal circuits to configure mature brain connectivity. The hippocampus is a limbic structure involved in learning and memory, and it has been the focus of intensive research aimed at understanding the function of REMS as it relates to memory formation. However, to date, no studies have been reported on the influence of REMS on hippocampal maturation.
In this study, we carried out REMS deprivation in early life and assessed hippocampal development. We utilized LTP stability as an index of neuronal circuit maturation. LTP was induced with high frequency stimulation; its reversal was attempted at 30 min post-LTP induction (Kramar and Lynch, 2003). Additionally, we performed immunoblots on extracts of whole hippocampus to determine the effect of REMS deprivation on expression of some important glutamatergic signaling proteins involved in LTP induction and maintenance as well as in refinement of synapses.
EXPERIMENTAL PROCEDURES
Animals and treatments
Male Long-Evans rats were obtained at two specific ages from timed-pregnant dams (Sprague Dawley, Inc., Indianapolis, IN, USA) housed in our animal facilities and maintained on a 12-h light/dark cycle (light from 6:00 A.M. to 6:00 P.M.) with food and water ad libitum. The study comprised two age groups: young (PN11-25) (Y) and adolescent (PN39-53) (A) animals. The Y group represents the maturational period in rats when synaptic refinement and neuronal circuit stabilization processes are operational in the developing hippocampus; the A group encompasses the age when such processes wane and end. Each age cohort contains three treatment groups: a rapid eye movement sleep-deprived (REMSD), a shaker-control (SC), and a normal-control (NC) group. REMSD animals were operated, isolated, and then perturbed mechanically (shaken) at onsets of REMS (see below). SC animals were operated, isolated and, as stress controls, perturbed the same number of times as the REMSD animals. Half the mechanical disturbances delivered to the SC group were executed during NREMS and half during waking so as not to interfere with natural REMS onsets. NC animals were left undisturbed in their home cages during all states of consciousness. SC and NC animals were killed at the same ages as the corresponding REMSD animals. In addition, an I (PN9-21), untreated group was studied to gain baseline information about the pace of developmental regulation of LTP stability. All procedures were performed in agreement with the guidelines of the NIH and the approval of the local Internal Review Board for Care and Use of Animals. Every effort was made to minimize animal suffering. The minimum number of animals necessary to obtain statistically reliable data was utilized.
Experimental time-line
Y and A animals were surgically implanted (see below) with sleep recording electrodes on PN11 and PN39, respectively (Fig. 1). Five days later, Y (PN16) and A (PN44), animals in each cohort were randomly assigned to the REMSD group (Y-REMSD n=13; A-REMSD n=6) or to the SC group (Y-SC, n=10; A-SC, n=10). The NC groups served as age-matched controls (I, n=6; Y-NC, n=12; A-NC, n=10). Over the next 3 days, Y (PN16-18) and A (PN44-46), REMSD and SC animals were placed in sleep recording boxes once during a 4 h period every day. After each daily session, they were returned to their home cages. After the third session, the animals were left undisturbed for another 3 to 7 days in the home cages before being killed. This post-REMS deprivation recovery period was employed to differentiate between an immediate negative effect of REMS deprivation on LTP induction (Campbell et al., 2002; Davis et al., 2003; McDermott et al., 2003) and possible longer-term effects on hippocampal maturation. The latter was investigated in this work by testing LTP stability (Kramar and Lynch, 2003). During the testing period, animals in the two age groups were in the following age ranges: Y, PN21-25 and A, PN49-53. The average ages of the three treatment groups (REMSD, SC, NC) in the Y and A cohorts were not different from each other at the time of testing (mean ages: Y=PN23; A=PN51). The tissue used for the immunoblot assessments (Y-REMSD, n=5; Y-SC, n=6; Y-NC, n=7; A-REMSD, n=5; A-SC, n=7; A-NC, n=6) was obtained from the contralateral hippocampus of the same animals studied in the electrophysiology experiments.
Fig. 1.
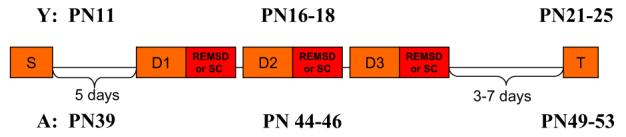
Experimental time-line. S (surgery), D (day of treatment), REMSD (REMS deprived) or SC (shaker control), T (testing period for LTP or immunoblot studies). Postnatal ages represent time points when experimental procedures where conducted for the Young (Y, top row), and for the Adolescent (A, bottom row) animals.
Sleep recording surgery
Y animals were surgically implanted with sleep recording electrodes under deep isoflurane anesthesia at PN11. Recording electrodes included three, 30 ga stainless-steel wire electrodes, one inserted in the left hippocampus (to identify theta waves during REMS) and two placed in contact with the pial surface above the right frontal and parietal cortices (to record the electrocorticogram, ECoG). Upon recovery from anesthesia, pups were put back with their dams. The recording electrodes of the A animals consisted of one 30 ga, stainless-steel wire electrode aimed at the left hippocampus and three, 80 ga stainless-steel screw-and-wire electrodes inserted into the right skull above the frontal, parietal and visual cortices (to record the ECoG). Additionally, two multi-stranded 28 ga wires were sutured bilaterally to dorsal neck muscles to register the nuchal electromyogram (EMG). All electrodes were attached to a shielded electrical cable, which connects each animal via a counterbalanced swing-arm and commutator to the recording equipment.
REMS deprivation
REMS deprivation was conducted in the morning shortly after lights-on (typically between 9 A.M. and 1 P.M.). Y and A rats were isolated in sleep recording boxes only during the 4 h REMS deprivation sessions. After each 4 h session, animals were returned to home cages with their littermates. Y (PN16) and A (PN44) rats were REMS-deprived for 3 consecutive days (total 12 h) by gentle cage-shaking initiated at every visually, and also electrophysiologically identified, REMS onset. The ECoG and EMG recordings were used in combination with behavioral signals to REMS-deprive the animals during the 3-day treatment period (PN16-18; PN44-46 for Y and A animals, respectively). In the Y animals, on every occasion in the course of the continuous 4 h recording that theta rhythm in the hippocampal electrode and low-amplitude, high-frequency activity in the ECoG were identified for 2-3 s during behavioral sleep, an experimenter remotely activated a large orbital shaker supporting the sleep recording box. The resulting mild and brief shake almost invariably terminated the REMS bout. In the A rats, an EMG sign (decrease in amplitude) served as an additional parameter signaling commencement of REMS.
Sleep stage scoring
We used real-time scoring to calculate the average time per stage (Wake, NREMS, REMS) spent during the 4 h REMS deprivation periods. While conducting REMS deprivation, an experimenter noted the clock times of the behavioral stage changes that occurred in the session. Accrued time in each stage was tallied for each 4 h period. The data are presented here as the average percentage±S.E.M. of the sessions spent in the three vigilance stages. Y-REMSD: 44.05±1.5% awake, 56±1.5% NREMS, 0% REMS; Y-SC: 41.8±1.1% awake, 46.8±1.5% NREMS, 11.4±1.3% REMS; A-REMSD: 32.4±2.3% awake, 67.6±2.3% NREMS, 0% REMS; A-SC: 43.6±5.3% awake, 53±4.9% NREMS, 3.4±0.5% REMS.
Slice preparation
Hippocampal slices were prepared following procedures described by Kramar and Lynch (2003). At approximately the same time (9:00-10:00 A.M.) of the morning of the kill, after brief exposure to isoflurane animals were anesthetized and decapitated. Brains were rapidly extracted and immersed in ice-cold, oxygenated, cutting artificial cerebrospinal fluid (ACSF) solution containing (in mM) 124 NaCl, 3 KCl, 1.25 KH2PO4, 5 MgSO4, 3.4 CaCl2, 26 NaHCO3 and 10 glucose. The hippocampus was sliced with a McIlwain tissue chopper. Hippocampal slices (400 μm) were transferred to an interface tissue slice-recording chamber (Fine Science Tools Inc., Foster City, CA, USA) with preheated 31 °C (±1 °C) ACSF of the following composition (in mM): 124 NaCl, 3 KCl, 1.25 KH2PO4, 2.5 MgSO4, 3.4 CaCl2, 26 NaHCO3 and 10 glucose. The magnesium concentration was doubled in the cutting ACSF compared with the running ACSF solution to physiologically block calcium influx through NMDARs, thereby preventing induction of synaptic plasticity mechanisms initiated by activation of these receptors during the cutting phase of slice preparation. Once in the recording chamber, slices were continuously perfused with running ACSF solution at a rate of 1-2 ml per min and maintained in an oxygenated (95% O2/5% CO2), humidified atmosphere and allowed to equilibrate for at least 2 h before electro-physiological recording was started.
In vitro electrophysiology
Following procedures described by Kramar and Lynch (2003), a concentric, bipolar stimulation electrode (200 μm diameter, FHC, Inc., Bowdoin, ME, USA) was positioned in the Schaffer collateral-commissural fibers, and a glass-pipette electrode (impedance 2-3 MΩ) filled with 0.15 M NaCl was placed in the stratum radiatum of the CA1 region of the hippocampus. Field excitatory postsynaptic potentials (fEPSPs) were evoked by 10-150 μA square wave stimuli of 0.2 ms duration. One hour after electrode placement, a full input/output curve was obtained, and stimulation intensity was adjusted to elicit 50% of maximal fEPSP amplitude. Mean stimulation intensity values eliciting half-maximal response were not different between groups (I=9.9±0.4 V; Y=10.3±0.4 V; A=10.4±0.2 V, F2-25=0.49 n.s.). One hour later, a stable base-line was recorded, utilizing single stimulation intensity (50% of maximal fEPSP amplitude) delivered every 1 min. Electrode placements producing baseline responses with greater than (±) 10% variability were repositioned in a new slice, and the experiment was restarted. After a 20 min stable baseline was established, LTP was induced with theta burst stimulation (TBS: 10-12 bursts at 5 Hz, each burst consisting of four pulses at 100 Hz). The stimulus duration was increased to 0.4 ms during TBS. Reversal of LTP was attempted with theta pulse stimulation (TPS: 300 pulses at 5 Hz) 30 min after successful induction of LTP (Kramar and Lynch, 2003). Recordings were continued for 60 min post-TPS. The evoked responses were digitized at 20 kHz and analyzed (CP Analysis, Data Wave Technologies, Berthoud, CO, USA) for slope of the fEPSP.
Western blot procedures
The hippocampus contralateral to the side used for electrophysiology experiments was extracted (as described for the electro-physiology experiments) and prepared for immunoblot analysis. Individual hippocampi were homogenized in ice-cold TE buffer (10 mM Tris-HCl and 1 mM EDTA) containing protease inhibitors (Protease Inhibitor Cocktail Tablets—CompleteTM, Boehringer Mannheim GmbH, Mannheim, Germany). Total protein concentrations were determined in all samples, using the bicinchoninic acid method (Pierce Biotechnology Inc., Rockford, IL, USA). Samples were mixed with sample buffer (0.125 M Tris base, 20% glycerol, 4% SDS, 10% mercaptoethanol, 0.05% Bromophenol Blue, pH 6.8) and heated at 95 °C for 10 min.
Solubilized proteins (10 μg per lane) were resolved on 7.5% sodium dodecyl sulfate (SDS) -polyacrylamide gels and transferred to nitrocellulose membranes (Hybond ECL; Amersham Bio-sciences PLC, Buckinghamshire, UK). After transfer, non-specific binding sites were blocked for 2 h at room temperature with Tris-buffered saline Tween (t-TBS; 20 mM Tris base, 0.5 M NaCl, and 0.1% Tween) containing 3% non-fat dried milk. Nitrocellulose membranes were then incubated overnight at 4 °C with primary antibodies. The primary antibodies and dilutions used were: rabbit anti-NR2A polyclonal antibody, 1:1000 (Novus Biological Inc., Littleton, CA, USA); rabbit anti-NR2B polyclonal antibody, 1:2000 (Novus Biological Inc.); rabbit anti-GluR1 polyclonal antibody, 1:1000 (Chemicon International, Temecula, CA, USA); mouse anti-PSD95 monoclonal antibody, 1:1000 (Chemicon International); mouse anti-CaMKII monoclonal antibody, 1:14,000 (Chemicon International). Membranes were washed three times with t-TBS and incubated for 1 h at room temperature with the appropriate secondary antibody coupled to horseradish peroxidase: anti-rabbit antibody (Novus Biological Inc.), 1:5000 for NR2A and NR2B, and 1:3000 for GluR1; anti-mouse antibody (GE Healthcare/Amersham, Piscataway, NJ, USA), 1:3000 for PSD95 and 1:6000 for CaMKII. Membranes were washed three times with t-TBS after incubation with the secondary antibody, developed using enhanced chemiluminescence detection (ECL; Perkin-Elmer Life Sciences, Inc., Boston, MA, USA), and captured on autoradiography film (Hyperfilm-ECL; GE Healthcare/Amersham Bio-sciences). Autoradiographs were scanned and the digital images quantified by densitometric analysis with imaging software (MCID Elite 7.0, Imaging Research, Inc., St. Catharines, Ontario, Canada). The three treatment groups (REMSD, SC and NC) in each age cohort were immunoblotted within the same gel and duplicated on separate gels. Each gel was also loaded with three concentrations of whole brain standard (obtained from a NC rat) consisting of 5, 10 and 20 μg of total protein. Densitometric analyses of the three concentrations of brain standard revealed an approximately 1:1 relationship between changes in optical density values and changes in protein concentrations for all antibodies used in this study. We plotted a standard curve for each gel to convert relative optical density values to arbitrary protein units in each experimental sample. This allowed gel-to-gel comparisons. All measurements of experimental samples fell within the linear range of these standard plots. Data for the REMSD and SC groups are expressed as percentages of the values measured in NC animals.
Measurement of blood serum corticosterone concentrations
After brief isoflurane anesthesia and decapitation, trunk blood was collected and centrifuged (3000 rev/min, 2-4 °C, 15 min). The serum fraction was separated and stored at -20 °C. Radioimmunoassay of the serum fraction provided plasma corticosterone levels, as described previously (Shaffery et al., 2002). An MP Biomedicals, LLC (Solon, OH, USA) corticosterone assay kit was used according to the manufacturer’s instructions, with the following modifications: All reagents were used at half strength and the 25 ng/ml standard was serially diluted three times to yield 12.5, 6.25 and 3.125 ng/ml standards. The resulting assay had a sensitivity of 3.125 ng/ml and an IC-50 of 65 ng/ml. Intra-assay variance was below 8%.
Statistical analysis
Data are represented as mean±S.E.M. Statistical significance within age groups was assessed in the electrophysiological experiment, by means of a one-way ANOVA followed by a corrected Bonferroni post hoc t-test. To detect statistical changes across age between REMSD and SC groups in the immunoblot experiment, we used the non-parametric Mann-Whitney t-test. Statistical significance was accepted at P<0.05.
RESULTS
Developmental changes in LTP stability in CA1 region of the hippocampus
To investigate changes in LTP stability as a function of development alone, we used three untreated age groups: I (PN9-12); Y (PN21-25); and A (PN49-53) control animals. TBS produced an increase in the slope of the fEPSP (% of baseline) in all animal groups (I, 144.2±10.4; Y, 145.5±7.9; A, 152.9±9.1). At 30 min post-TBS, no detectable differences were found between groups (F2-25=0.3P>0.05) (Fig. 2 and Fig. 3). TPS, applied 30 min post-TBS, temporarily eliminated LTP in all three age groups. The LTP magnitude recovered 60 min post-TPS in the Y-NC and A-NC animals but not in the I animals (60 min post-TPS relative to 30 min post-TBS: F2-25=10.3 P<0.001). Corrected Bonferroni t-tests indicated that post-TPS LTP magnitude was smaller in the I than in the Y (P<0.001) and A (P<0.001) untreated animals. These findings are in agreement with previous studies (Jackson et al., 1993; Kramar and Lynch, 2003) and suggest that the neuronal circuits in the CA1 region that support stable LTP expression mature between the second and third postnatal weeks.
Fig. 2.

Effect of REMS deprivation on LTP stability in I and Y animals. (A-D) Average data from all animals in each group. (E-G) Example traces depict the average of five consecutive field potential responses from an animal taken during the last 5 min of baseline (solid line), 25 min post-TBS (dotted line), and 55 min post-TPS (dashed line). TBS (solid upward arrow) produces a criterion increase in the slope of the fEPSP in all animal groups. TPS (dashed downward arrow) 30 min post-TBS temporarily eliminates LTP in all groups. LTP recovered at 60 min post-TPS in Y-NC (B, F) and Y-SC (D, H) groups but not in I (A, E) and Y-REMSD animals (C, G). Scale bars in H apply to all traces (E-H).
Fig. 3.

Effect of REMS deprivation on LTP stability in A animals. (A-C) Average data from all animals in each group. (D-F) Example traces depict the average of five consecutive field potential responses from an animal taken during the last 5 min of baseline (solid line), 25 min post-TBS (dotted line), and 55 min post-TPS (dashed line). TBS (solid upward arrow) produces a criterion increase in the slope of the fEPSP in slices from all groups. TPS (dashed downward arrow) temporarily eliminates LTP in all groups, but LTP returns to potentiated levels at 60 min post-TPS in all treatment groups A-NC (A); A-REMSD (B); A-SC (C). Scale bars in F apply to all traces (D-F).
Effect of REMS deprivation on LTP stability in Y and A age groups
We carried out electrophysiological experiments to investigate the effect of REMS deprivation on hippocampal maturation. In Y animals, TBS induced LTP in all treatment groups (% of baseline): Y-REMSD, 136.3±5.2; Y-SC, 149.5±6.5; Y-NC, 145.5±7.9. At 30 min post-TBS, no statistically significant difference was observed between groups (F2-30=1.2 n.s.) (Fig. 2). TPS applied 30 min post-TBS temporarily eliminated LTP in all three Y groups. LTP recovered 60 min post-TPS in the Y-SC and Y-NC animals but not in the Y-REMSD animals (F2-30=12.8 P<0.001). Post hoc tests showed that LTP magnitude at 60 min post-TPS was reduced relative to 30 min post-TBS in the Y-REMSD cohort as compared with the Y-SC (P<0.001) and Y-NC groups (P<0.001).
To evaluate whether the effect of REMS deprivation on LTP stability varies with age, we tested LTP stability in A (PN49-53) animals that received identical treatment to groups in the Y cohort. At this age, the processes of synaptic remodeling and neuronal circuit stabilization have concluded, and LTP is less susceptible to disruption (Kramar and Lynch, 2003). TBS induced LTP (% of baseline) in all A treatment groups (% of baseline): A-REMSD, 146.7±5.0; A-SC, 145.6±4.1; A-NC, 152.9±9.1. Further, at 30 min post-TBS no statistically significant difference existed among the groups (F2-25=0.3 n.s.) (Fig. 3). TPS applied 30 min post-TBS temporarily eliminated LTP in slices from all three A groups. However, LTP recovered 60 min post-TPS in all three groups. No difference was observed in any group at 60 min post-TPS relative to 30 min post-TBS (F2-25=0.4 n.s.).
Effect of REMS deprivation on synaptic glutamatergic proteins essential to synaptic refinement of the hippocampus
We next investigated whether effects of REMS deprivation on LTP stability were accompanied by changes in composition of some of the glutamatergic synaptic proteins that have been found to be important for synaptic refinement and plasticity. Immunoblots for NR2B, NR2A, PSD-95, GluR1 and CaMKII proteins were performed on extracts from whole hippocampus. Immunoblot data for REMSD and SC groups are expressed as percentage of NC value.
Overall, expression level of every tested protein was lower in the Y-REMSD group than in the Y-SC group. Comparison of Y-REMSD and Y-SC groups yielded statistically significant differences with respect to NR2B and GluR1 (Mann-Whitney test, P<0.05). The same type of comparison revealed a trend toward a lesser value of PSD-95 in the Y-REMSD group (Mann-Whitney test, P=0.068) (Fig. 4A-E). The A-REMSD and A-SC groups were not significantly different with respect to any of the tested proteins in the A rats (Mann-Whitney test, n.s.) (Fig. 4F-J).
Fig. 4.

Effect of REMS deprivation on glutamatergic signaling proteins in Y (A-E) and A (F-J) animals. Histograms depict average data from all animals within a treatment group presented and analyzed as percentage of the corresponding mean NC value. Images above graph are representative immunoblots, and correspond to each bar of the histogram. Axis labels on bottom left (E) and right (J) graphs apply to the graphs above as well. Protein levels were decreased in both Y-REMSD and Y-SC compared with Y-NC. Significant differences were observed between Y-REMSD and Y-SC groups with respect to NR2B (A) and GluR1 (B) (* P<0.05). PSD-95 (C) tended to be lower in Y-REMSD than Y-SC animals (P=0.068). No differences were detected with regard to NR2A (D) and CaMKII (E). In the A animals, protein levels were decreased in both A-REMSD and A-SC groups compared with A-NC. No significant differences were observed between A-REMSD and A-SC groups with respect to any of the proteins tested: NR2B (F), GluR1 (G), PSD-95 (H), NR2A (I), and CaMKII (J).
Effect of REMS-deprivation on serum corticosterone level
REMS-deprivation causes an increase in serum corticosterone levels in the adult rat (Kopp et al., 2006; McDermott et al., 2003). High levels of corticosterone are known to affect LTP induction in the hippocampus. Accordingly, we measured serum corticosterone levels to assess for influence of the hypothalamic-pituitary-adrenal (HPA) axis upon our electrophysiological and immunoblot findings. Corticosterone, measured by radioimmunoassay, was slightly elevated in the REMSD and SC groups, more so in the SC groups as compared with NC animals in both the Y and A age groups (Fig. 5). However, the differences did not reach statistical significance [Y, (F2-45=2.4 n.s.); A, (F2-24=3.0 n.s.)].
Fig. 5.
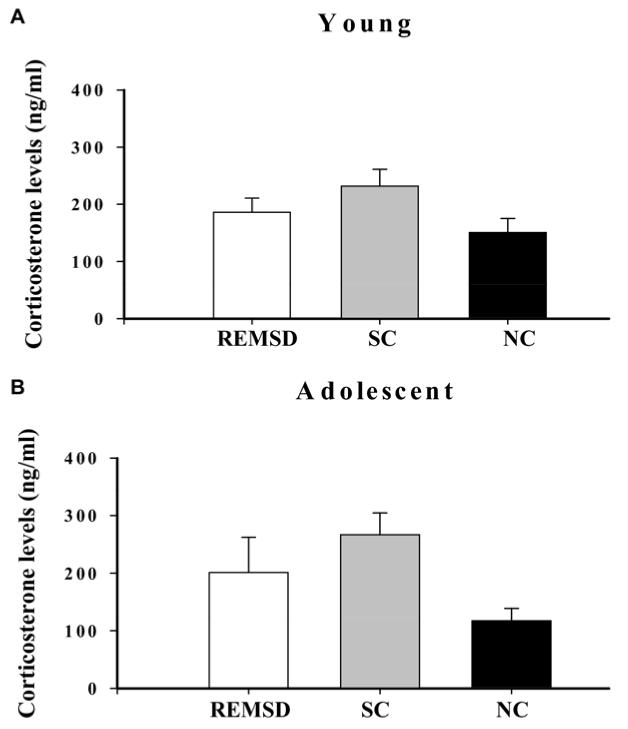
Serum corticosterone levels in (A) Y and (B) A animals. Corticosterone levels were slightly elevated in the REMSD and SC groups, more so in the SC groups, as compared with NC animals in both the Y and A age groups. However, the differences were not statistically significant. Data are given as mean±S.E.M.
DISCUSSION
Effect of REMS deprivation on LTP stability in Y and A age groups
In the present study, we studied normal cage-reared Long-Evans animals at three different ages and found that LTP stability in CA1 region of the hippocampus is developmentally regulated, which is consistent with adult reported by Kramar and Lynch (2003). In addition, we demonstrated that mild REMS deprivation has a more dramatic and longstanding (perhaps irreversible) effect on hippocampal neuronal circuit stabilization in younger animals. Employing LTP stability as an indicator of hippocampal neuronal circuit development, we found that REMS deprivation was associated with lower LTP stability in Y-REMSD compared with A-REMSD rats. LTP instability after TPS induction was similar in Y-REMSD animals to that in a group of even more immature normal animals (PN9-12, the I group) who had not been REMS-deprived. This suggests that cellular events responsible for LTP stability, which mature between the second and third postnatal week (Jackson et al., 1993; Kramar and Lynch, 2003), are compromised if REMS deprivation is applied during this period of synapse refinement. In A rats, however, LTP remained stable after TPS, indicating that mild REMS deprivation does not affect the durability of hippocampal neuronal circuits that have reached a certain degree of maturation.
In summary, these data suggest that depriving Y rats of REMS-generated neuronal activity appears to disrupt, prevent or slow down the synaptic events that usually lead to refinement and stabilization of synapses during hippocampal development. It is remarkable that very brief periods (4 h/day for 3 days; 12 h altogether) of REMS deprivation, despite probable REMS recovery each day (Frank et al., 1998), have such a profound effect on synaptic remodeling and stability in the maturing hippocampus. It is noteworthy that some of the REMSD animals were not studied until 7 days, and never less than 3 days, after the last day of REMS deprivation. This persistence of synaptic instability may indicate a lasting effect of REMS deprivation on synaptic connectivity in the Y age group that is not seen in older animals (A). Possible permanence of this effect will be the subject of future study.
Effect of HPA axis and REMS deprivation on LTP induction
Corticosterone levels above normal may adversely affect cognition and synaptic plasticity in the hippocampus (De Kloet et al., 1999; van Praag et al., 2000). Several in vivo and in vitro electrophysiological studies have found that high corticosterone levels impair hippocampal LTP (Foy et al., 1987; Shors and Dryver, 1994). We measured serum corticosterone and found it elevated in REMSD and SC animals compared with NC animals in both Y and A groups, though the differences between groups were not statistically significant. The SC groups showed higher levels of corticosterone than the REMSD animals in both age groups, which could possibly be due to the investigator-provoked perturbations of SC animals during the waking state. The finding that LTP was still reliably induced in all the studied animals minimizes the possibility that corticosterone levels substantially affected LTP induction in this study.
In addition to the effect of stress, hippocampal LTP induction in adult animals can also be impaired by REMS deprivation, an immediate effect that wanes with recovery (McDermott et al., 2003; Davis et al., 2003). Because our interest was not focused on an acute effect but, rather, on whether REMS has a more enduring effect upon brain development, we allowed 3-7 days of recovery before testing the animals electrophysiologically. After this period, we could still induce similar levels of LTP in all treatment groups. Accordingly, it is reasonable to assume that the instability of LTP in the Y-REMSD animals is a longer-term consequence of early REMS deprivation on hippocampal developmental processes and not an immediate, negative and quickly reversible effect on synaptic plasticity, as observed in adult studies (McDermott et al., 2003; Campbell et al., 2002).
REMS deprivation and proteins of the glutamatergic signaling system
To determine the effect of REMS deprivation on glutamatergic signaling proteins, we focused on some of the glutamatergic receptors and associated proteins that are known to be important for synaptic refinement and plasticity during hippocampal development (Waites et al., 2005).
A. We found less NR2A, PSD-95, CaMKII, NR2B and GluR1 protein expression (all five proteins tested) in A-REMSD and A-SC than in A-NC animals. However, comparison between A-REMSD and A-SC groups did not detect differences in the levels of expression of any of the tested proteins in the two groups. It is tempting, then, to speculate that the decrease in glutamatergic signaling proteins in both A-REMSD and A-SC groups stems from the common environmental experience of the two groups. (This idea would be strengthened had a third group, neither REMSD nor shaken, been exposed to the novel environment.) The novel conditions (social isolation and the new environment of the sleep recording boxes) experienced by both the A-SC and A-REMSD animals may have triggered similar synaptic plasticity changes activating homeostatic plasticity mechanisms such as synaptic scaling. It has been proposed that synaptic scaling provides a necessary negative feedback, by up- or down-scaling the strength of synaptic inputs, to maintain synaptic plasticity and restore stability to network function (Turrigiano et al., 1998). In this schema, glutamatergic receptors and associated proteins would have decreased through the synaptic down-scaling mechanism as a means to compensate for the changes in neuronal activity induced by experience. Additional support for this argument is found in our electrophysiological data, which show that LTP was similarly stable in A-REMSD and A-SC groups. As with LTP induction, however, it is possible that REMS deprivation had an early effect on protein expression in the A animals, but the effect could no longer be distinguished in our 3-7 day post-REMS deprivation data.
Y. In the Y animals, expression of NR2B, NR2A, GluR1, PSD-95 and CaMKII, as in the A group, was lower in the Y-REMSD and Y-SC animals than in Y-NC animals. Unlike the results in the A animals, however, GluR1 and NR2B were significantly lower still in the Y-REMSD compared with the Y-SC animals. Likewise, PSD-95 expression tended to be less in the Y-REMSD group.
Previous work on the effect of neuronal activity on development in the hippocampus has shown that chronic blockade of activity leads to an increase in NR2B and GluR1 (Galvan et al., 2003; Kiyosue et al., 2004), whereas increasing activity (e.g., early-life induction of epileptiform discharges) decreases expression of NR2B and PSD-95 (Jiang et al., 2007). The parallel between these studies and the data provided by the immunoblots in the Y animals suggests that both, experimentally increased epileptiform neuronal activity and REMS deprivation, if applied early in life, reduce expression of specific synaptic components thought to be necessary for stabilization of neuronal circuits during development.
We propose that the decreased expression of NR2B, GluR1 and PSD-95 observed in the immunoblot results of the Y-REMSD animals is the result of a homeostatic response of the glutamatergic system to REMS deprivation. According to this interpretation, REMS deprivation, at a time when synaptic connectivity is increasing at a high rate and NMDARs are composed mainly of NR2B, could have led to excessive amounts of Ca2+ entering the neurons following afferent stimulation (Scheetz and Constantine-Paton, 1994). The glutamatergic system may have responded with the pronounced decrease in NR2B subunit that we observed in the Y-REMSD animals to prevent NMDAR-mediated excitotoxicity. In turn, such indiscriminate activation of NMDARs containing the NR2B subunit may have triggered dissociation of PSD-95 and NMDARs so as to facilitate removal and recycling of these receptors (Roche et al., 2001) and dissociate them from the excitatory intracellular signaling cascade (Cui et al., 2007). This would have led to the reduction in PSD-95 that we found. Support for this line of reasoning derives from studies showing that disruption of the interaction of NR2B and PSD-95 reduces excitotoxic vulnerability of neurons and renders neurons resistant to focal cerebral ischemia in vivo (Aarts et al., 2002). In addition, it has been shown that NMDA- and AMPA-receptor synaptic expression is tightly co-regulated by activity, suggesting the presence of a homeostatic mechanism that actively maintains a constant receptor ratio across a neuron’s synapses (Watt et al., 2000). Further, NMDARs regulate synaptic strength by controlling the trafficking of AMPARs into and out of postsynaptic sites (Malinow and Malenka, 2002). Accordingly, a decrease in NMDARs would be expected to be accompanied by reduction in AMPARs, as observed in our immunoblots from Y-REMSD animals.
The lower protein levels in Y-REMSD than in Y-SC animals (both of which were otherwise exposed to the same, novel environmental experiences) suggest that early-life REMS deprivation decreases expression of certain glutamatergic synaptic components, hindering formation of mature, stable neuronal connections in the hippocampus. Previous studies in visual cortex similarly suggest that early-life REMS deprivation slows or inhibits normal neuronal circuit maturation (Shaffery et al., 2006a, b, 1998).
CONCLUSION
The neuronal mechanisms affected by brief periods of REMS deprivation cannot be entirely delineated from these data. Nonetheless, our findings are consistent with a possible role for REMS in development; that is, REMS provides the CNS with an endogenously generated form of activation that facilitates formation and modulation of precise neuronal networks. In our study, the Y-REMSD animals obtained more NREMS than the animals in the Y-SC groups. However, Y-REMSD animals showed less LTP stability and lower expression of glutamatergic signaling proteins. This is consistent with the finding that the REMS obtained by the animals in the Y-SC group contributed to expression of mature components of synapses and to stabilization of neuronal connections. We are not attempting to discard the possibility that NREMS is involved in refinement of synaptic connections. Our own data, which specifically relate only to REMS and merely support the operation of this state as a functional source of activation, complementary and additive to sensory input, with respect to refining and stabilizing neuronal circuits into the adult pattern of connectivity.
Acknowledgment
This study was supported by NIH research grant R01-NS31720 (JPS) and in part by the AGEM (Alliance for Graduate Education in Mississippi) award from NSF (National Science Foundation) (J.L.) as well as in part by a grant from NCRR/NIH # P20-RR-017701 (B.K.).
Abbreviations
- A
adolescent
- ACSF
artificial cerebrospinal fluid
- AMPAR
AMPA receptor
- CaMKII
calcium/calmodulin kinase II
- ECoG
electrocorticogram
- EDTA
ethylene-diaminetetraacetate
- EMG
electromyogram
- fEPSP
field excitatory postsynaptic potential
- GluR1
AMPA receptor subunit 1
- HPA
hypothalamic-pituitary-adrenal
- I
immature
- LFS
low-frequency stimulation
- LTP
long-term potentiation
- NC
normal control
- NMDAR
N-methyl-d-aspartate receptor
- NREMS
non-rapid eye movement sleep
- NR1
N-methyl-d-aspartate receptor subunit 1
- NR2A
N-methyl-d-aspartate receptor subunit 2A
- NR2B
N-methyl-d-aspartate receptor subunit 2B
- PN
postnatal day
- PSD-95
postsynaptic density protein 95
- REMS
rapid eye movement sleep
- REMSD
rapid eye movement sleep-deprived
- SC
shaker control
- TBS
theta burst stimulation
- TPS
theta pulse stimulation
- t-TBS
Tris-buffered saline Tween
- Y
young
REFERENCES
- Aarts M, Liu Y, Liu L, Besshoh S, Arundine M, Gurd JW, Wang YT, Salter MW, Tymianski M. Treatment of ischemic brain damage by perturbing NMDA receptor-PSD-95 protein interactions. Science. 2002;298:846–850. doi: 10.1126/science.1072873. [DOI] [PubMed] [Google Scholar]
- Bear MF. Progress in understanding NMDA-receptor-dependent synaptic plasticity in the visual cortex. J Physiol Paris. 1996;90:223–227. doi: 10.1016/s0928-4257(97)81428-3. [DOI] [PubMed] [Google Scholar]
- Bolton MM, Blanpied TA, Ehlers MD. Localization and stabilization of ionotropic glutamate receptors at synapses. Cell Mol Life Sci. 2000;57:1517–1525. doi: 10.1007/PL00000636. [DOI] [PMC free article] [PubMed] [Google Scholar]
- Campbell IG, Guinan MJ, Horowitz JM. Sleep deprivation impairs long-term potentiation in rat hippocampal slices. J Neurophysiol. 2002;88:1073–1076. doi: 10.1152/jn.2002.88.2.1073. [DOI] [PubMed] [Google Scholar]
- Choi DW. Glutamate receptors and the induction of excitotoxic neuronal death. Prog Brain Res. 1994;100:47–51. doi: 10.1016/s0079-6123(08)60767-0. [DOI] [PubMed] [Google Scholar]
- Cui H, Hayashi A, Sun HS, Belmares MP, Cobey C, Phan T, Schweizer J, Salter MW, Wang YT, Tasker RA, Garman D, Rabinowitz J, Lu PS, Tymianski M. PDZ protein interactions underlying NMDA receptor-mediated excitotoxicity and neuroprotection by PSD-95 inhibitors. J Neurosci. 2007;27:9901–9915. doi: 10.1523/JNEUROSCI.1464-07.2007. [DOI] [PMC free article] [PubMed] [Google Scholar]
- Davis CJ, Harding JW, Wright JW. REM sleep deprivation-induced deficits in the latency-to-peak induction and maintenance of long-term potentiation within the CA1 region of the hippocampus. Brain Res. 2003;973:293–297. doi: 10.1016/s0006-8993(03)02508-3. [DOI] [PubMed] [Google Scholar]
- De Kloet ER, Oitzl MS, Joels M. Stress and cognition: are corticosteroids good or bad guys? Trends Neurosci. 1999;22:422–426. doi: 10.1016/s0166-2236(99)01438-1. [DOI] [PubMed] [Google Scholar]
- Desai NS, Cudmore RH, Nelson SB, Turrigiano GG. Critical periods for experience-dependent synaptic scaling in visual cortex. Nat Neurosci. 2002;5:783–789. doi: 10.1038/nn878. [DOI] [PubMed] [Google Scholar]
- Ehlers MD. Activity level controls postsynaptic composition and signaling via the ubiquitin-proteasome system. Nat Neurosci. 2003;6:231–242. doi: 10.1038/nn1013. [DOI] [PubMed] [Google Scholar]
- Foy MR, Stanton ME, Levine S, Thompson RF. Behavioral stress impairs long-term potentiation in rodent hippocampus. Behav Neural Biol. 1987;48:138–149. doi: 10.1016/s0163-1047(87)90664-9. [DOI] [PubMed] [Google Scholar]
- Frank MG, Morrissette R, Heller HC. Effects of sleep deprivation in neonatal rats. Am J Physiol. 1998;275:R148–R157. doi: 10.1152/ajpregu.1998.275.1.R148. [DOI] [PubMed] [Google Scholar]
- Galvan CD, Wenzel JH, Dineley KT, Lam TT, Schwartzkroin PA, Sweatt JD, Swann JW. Postsynaptic contributions to hippocampal network hyperexcitability induced by chronic activity blockade in vivo. Eur J Neurosci. 2003;18:1861–1872. doi: 10.1046/j.1460-9568.2003.02920.x. [DOI] [PubMed] [Google Scholar]
- Jackson PS, Suppes T, Harris KM. Stereotypical changes in the pattern and duration of long-term potentiation expressed at postnatal days 11 and 15 in the rat hippocampus. J Neurophysiol. 1993;70:1412–1419. doi: 10.1152/jn.1993.70.4.1412. [DOI] [PubMed] [Google Scholar]
- Jiang Q, Wang J, Wu X, Jiang Y. Alterations of NR2B and PSD-95 expression after early-life epileptiform discharges in developing neurons. Int J Dev Neurosci. 2007;25:165–170. doi: 10.1016/j.ijdevneu.2007.02.001. [DOI] [PubMed] [Google Scholar]
- Katz LC, Shatz CJ. Synaptic activity and the construction of cortical circuits. Science. 1996;274:1133–1138. doi: 10.1126/science.274.5290.1133. [DOI] [PubMed] [Google Scholar]
- Kiyosue K, Hiyama TY, Nakayama K, Kasai M, Taguchi T. Re-expression of NR2B-containing NMDA receptors in vitro by suppression of neuronal activity. Int J Dev Neurosci. 2004;22:59–65. doi: 10.1016/j.ijdevneu.2003.12.007. [DOI] [PubMed] [Google Scholar]
- Kopp C, Longordo F, Nicholson JR, Luthi A. Insufficient sleep reversibly alters bidirectional synaptic plasticity and NMDA receptor function. J Neurosci. 2006;26:12456–12465. doi: 10.1523/JNEUROSCI.2702-06.2006. [DOI] [PMC free article] [PubMed] [Google Scholar]
- Kramar EA, Lynch G. Developmental and regional differences in the consolidation of long-term potentiation. Neuroscience. 2003;118:387–398. doi: 10.1016/s0306-4522(02)00916-8. [DOI] [PubMed] [Google Scholar]
- Lissin DV, Gomperts SN, Carroll RC, Christine CW, Kalman D, Kitamura M, Hardy S, Nicoll RA, Malenka RC, von Zastrow M. Activity differentially regulates the surface expression of synaptic AMPA and NMDA glutamate receptors. Proc Natl Acad Sci U S A. 1998;95:7097–7102. doi: 10.1073/pnas.95.12.7097. [DOI] [PMC free article] [PubMed] [Google Scholar]
- Malenka RC. Synaptic plasticity in the hippocampus: LTP and LTD. Cell. 1994;78:535–538. doi: 10.1016/0092-8674(94)90517-7. [DOI] [PubMed] [Google Scholar]
- Malenka RC, Bear MF. LTP and LTD: an embarrassment of riches. Neuron. 2004;44:5–21. doi: 10.1016/j.neuron.2004.09.012. [DOI] [PubMed] [Google Scholar]
- Malenka RC, Nicoll RA. Long-term potentiation: a decade of progress? Science. 1999;285:1870–1874. doi: 10.1126/science.285.5435.1870. [DOI] [PubMed] [Google Scholar]
- Malinow R, Malenka RC. AMPA receptor trafficking and synaptic plasticity. Annu Rev Neurosci. 2002;25:103–126. doi: 10.1146/annurev.neuro.25.112701.142758. [DOI] [PubMed] [Google Scholar]
- McDermott CM, LaHoste GJ, Chen C, Musto A, Bazan NG, Magee JC. Sleep deprivation causes behavioral, synaptic, and membrane excitability alterations in hippocampal neurons. J Neurosci. 2003;23:9687–9695. doi: 10.1523/JNEUROSCI.23-29-09687.2003. [DOI] [PMC free article] [PubMed] [Google Scholar]
- Monyer H, Burnashev N, Laurie DJ, Sakmann B, Seeburg PH. Developmental and regional expression in the rat brain and functional properties of four NMDA receptors. Neuron. 1994;12:529–540. doi: 10.1016/0896-6273(94)90210-0. [DOI] [PubMed] [Google Scholar]
- Monyer H, Sprengel R, Schoepfer R, Herb A, Higuchi M, Lomeli H, Burnashev N, Sakmann B, Seeburg PH. Heteromeric NMDA receptors: molecular and functional distinction of subtypes. Science. 1992;256:1217–1221. doi: 10.1126/science.256.5060.1217. [DOI] [PubMed] [Google Scholar]
- Passafaro M, Piech V, Sheng M. Subunit-specific temporal and spatial patterns of AMPA receptor exocytosis in hippocampal neurons. Nat Neurosci. 2001;4:917–926. doi: 10.1038/nn0901-917. [DOI] [PubMed] [Google Scholar]
- Perez-Otano I, Ehlers MD. Learning from NMDA receptor trafficking: clues to the development and maturation of glutamatergic synapses. Neurosignals. 2004;13:175–189. doi: 10.1159/000077524. [DOI] [PubMed] [Google Scholar]
- Petralia RS, Sans N, Wang YX, Wenthold RJ. Ontogeny of postsynaptic density proteins at glutamatergic synapses. Mol Cell Neurosci. 2005;29:436–452. doi: 10.1016/j.mcn.2005.03.013. [DOI] [PMC free article] [PubMed] [Google Scholar]
- Roche KW, Standley S, McCallum J, Dune LC, Ehlers MD, Wenthold RJ. Molecular determinants of NMDA receptor internalization. Nat Neurosci. 2001;4:794–802. doi: 10.1038/90498. [DOI] [PubMed] [Google Scholar]
- Roffwarg HP, Muzio JN, Dement WC. Ontogenetic development of the human sleep-dream cycle. Science. 1966;152:604–619. doi: 10.1126/science.152.3722.604. [DOI] [PubMed] [Google Scholar]
- Rubio ME, Wenthold RJ. Glutamate receptors are selectively targeted to postsynaptic sites in neurons. Neuron. 1997;18:939–950. doi: 10.1016/s0896-6273(00)80333-5. [DOI] [PubMed] [Google Scholar]
- Sans N, Petralia RS, Wang YX, Blahos J, Hell JW, Wenthold RJ. A developmental change in NMDA receptor-associated proteins at hippocampal synapses. J Neurosci. 2000;20:1260–1271. doi: 10.1523/JNEUROSCI.20-03-01260.2000. [DOI] [PMC free article] [PubMed] [Google Scholar]
- Scheetz AJ, Constantine-Paton M. Modulation of NMDA receptor function: implications for vertebrate neural development. FASEB J. 1994;8:745–752. doi: 10.1096/fasebj.8.10.8050674. [DOI] [PubMed] [Google Scholar]
- Shaffery JP, Lopez J, Bissette G, Roffwarg HP. Rapid eye movement sleep deprivation in post-critical period, adolescent rats alters the balance between inhibitory and excitatory mechanisms in visual cortex. Neurosci Lett. 2006a;393:131–135. doi: 10.1016/j.neulet.2005.09.051. [DOI] [PubMed] [Google Scholar]
- Shaffery JP, Lopez J, Bissette G, Roffwarg HP. Rapid eye movement sleep deprivation revives a form of developmentally regulated synaptic plasticity in the visual cortex of post-critical period rats. Neurosci Lett. 2006b;391:96–101. doi: 10.1016/j.neulet.2005.08.044. [DOI] [PubMed] [Google Scholar]
- Shaffery JP, Oksenberg A, Marks GA, Speciale SG, Mihailoff G, Roffwarg HP. REM sleep deprivation in monocularly occluded kittens reduces the size of cells in LGN monocular segment. J Electrocardiol. 1998;21:837–845. doi: 10.1093/sleep/21.8.837. [DOI] [PubMed] [Google Scholar]
- Shaffery JP, Sinton CM, Bissette G, Roffwarg HP, Marks GA. Rapid eye movement sleep deprivation modifies expression of long-term potentiation in visual cortex of immature rats. Neuro-science. 2002;110:431–443. doi: 10.1016/s0306-4522(01)00589-9. [DOI] [PubMed] [Google Scholar]
- Shors TJ, Dryver E. Effect of stress and long-term potentiation (LTP) on subsequent LTP and the theta burst response in the dentate gyrus. Brain Res. 1994;666:232–238. doi: 10.1016/0006-8993(94)90777-3. [DOI] [PubMed] [Google Scholar]
- Turrigiano GG, Leslie KR, Desai NS, Rutherford LC, Nelson SB. Activity-dependent scaling of quantal amplitude in neocortical neurons. Nature. 1998;391:892–896. doi: 10.1038/36103. [DOI] [PubMed] [Google Scholar]
- van Praag H, Kempermann G, Gage FH. Neural consequences of environmental enrichment. Nat Rev Neurosci. 2000;1:191–198. doi: 10.1038/35044558. [DOI] [PubMed] [Google Scholar]
- Waites CL, Craig AM, Garner CC. Mechanisms of vertebrate synaptogenesis. Annu Rev Neurosci. 2005;28:251–274. doi: 10.1146/annurev.neuro.27.070203.144336. [DOI] [PubMed] [Google Scholar]
- Watt AJ, van Rossum MC, MacLeod KM, Nelson SB, Turrigiano GG. Activity coregulates quantal AMPA and NMDA currents at neocortical synapses. Neuron. 2000;26:659–670. doi: 10.1016/s0896-6273(00)81202-7. [DOI] [PubMed] [Google Scholar]