Abstract
Passeriformes are the largest order of birds and one of the most widely studied groups in evolutionary biology and ecology. Until recently genomic tools in passerines relied on chicken genomic resources. Here we report the construction and analysis of a whole-genome linkage map for the zebra finch (Taeniopygia guttata) using a 354-bird pedigree. The map contains 876 SNPs dispersed across 45 linkage groups and we found only a few instances of interchromosomal rearrangement between the zebra finch and the chicken genomes. Interestingly, there was a greater than expected degree of intrachromosomal rearrangements compared to the chicken, suggesting that gene order is not conserved within avian chromosomes. At 1068 cM the map is approximately only one quarter the length of the chicken linkage map, providing further evidence that the chicken has an unusually high recombination rate. Male and female linkage-map lengths were similar, suggesting no heterochiasmy in the zebra finch. This whole-genome map is the first for any passerine and a valuable tool for the zebra finch genome sequence project and for studies of quantitative trait loci.
APPROXIMATELY half of all bird species belong to the order Passeriformes, a diverse, monophyletic avian lineage that has evolved over ∼100 million years (Sibley and Ahlquist 1990; Barker et al. 2004). Passerines (perching birds) are also one of the most widely studied taxonomic groups in neurobiology (Nottebohm and Arnold 1976; Tchernichovski et al. 2001; Kao et al. 2005), evolutionary genetics (Merilä and Sheldon 2001), and behavioral and ecological research (Lack 1968; Bennett and Owens 2002). Until recently, genetic and genomic tools for studying passerines were heavily dependent on genomic resources from the chicken (Gallus gallus), predominantly the chicken genome sequence assembly (International Chicken Genome Sequencing Consortium 2004), despite the fact that chickens belong to a nonpasserine order (Galliformes).
The cross-species utility of chicken resources was partially feasible because birds exhibit unusually conserved synteny, as demonstrated by both cytogenetic studies (Shetty et al. 1999; Derjusheva et al. 2004; Itoh and Arnold 2005; Itoh et al. 2006) and, to a lesser degree, linkage mapping (Hansson et al. 2005; Backström et al. 2006; Dawson et al. 2006, 2007). For example, the chicken and its ancestor, the red jungle fowl Gallus gallus, have 2n = 78 chromosomes, while most passerines have either 2n = 78 or 2n = 80 (Shetty et al. 1999). There is an almost one-to-one homology between chicken and passerine chromosomes, with only a few documented exceptions: the homologs of Gga1 and Gga4 are each represented by two chromosomes in passerines (Derjusheva et al. 2004). Although synteny is conserved [we use the term here in its original sense, meaning loci on the same chromosome, rather than making any reference to locus order (Passarge et al. 1999)] between passerines and other avian orders, the extent to which gene order is conserved remains uncertain.
To date there is no whole-genome linkage map for any passerine species, although mapping efforts in the great reed warbler Acrocephalus arundinaceus have generated an estimated 60% genomewide coverage, with up to 21 autosomes and the Z chromosome mapped, albeit at modest marker density (Hansson et al. 2005; Dawson et al. 2006, 2007; Åkesson et al. 2007). The great reed warbler maps have facilitated comparisons of locus order with chickens on five chromosomes, of which two (Gga1 and Gga2) show evidence of rearrangements (Dawson et al. 2007). A map of the ortholog of chromosome 7 in the house sparrow and zebra finch demonstrated evidence of rearrangements in gene order in comparison to the chicken (Hale et al. 2008). A Z chromosome linkage map has been constructed at higher marker density for the collared flycatcher Ficedula albicollis and this also revealed rearrangements relative to the chicken (Backström et al. 2006). At present, however, rearrangements on the basis of existing linkage maps remain putative because they are based on a small number of markers. Quantifying and characterizing rearrangements is of both intrinsic and practical relevance, as a number of tools for building passerine maps have assumed a high degree of conserved gene order across taxa (Backström et al. 2006; Dawson et al. 2006; Slate et al. 2007).
In this article we report the construction and analysis of a whole-genome linkage map for the zebra finch (Taeniopygia guttata), the first for any passerine species. The zebra finch is a model organism in neurobiology (Nottebohm and Arnold 1976; Yu and Margoliash 1996; Kao et al. 2005) and evolutionary biology (Zann 1996; Gil et al. 1999; Price et al. 2001; Birkhead et al. 2005; Evans et al. 2006) and is the second bird to have its genome sequenced (http://www.ncbi.nlm.nih.gov/projects/genome/guide/finch/).
The zebra finch genome assembly will be a valuable resource to researchers studying other passerines, in addition to providing new insight into avian genome evolution. Unlike other vertebrate genome sequencing projects there was no linkage or physical map already available when the zebra finch genome sequencing commenced. Therefore, the zebra finch genome linkage map will aid genome assembly, acting as an independent resource against which contig assembly can be validated. In addition to its value during genome assembly, the linkage map will enable researchers to perform quantitative trait locus (QTL) mapping experiments for traits relevant to neurobiologists and evolutionary biologists. The map can also be used as a tool to measure recombination rates per physical distance unit, which is a key parameter when trying to identify QTL by association (linkage disequilibrium) mapping (Heifetz et al. 2005; Backström et al. 2006; Aerts et al. 2007). Finally, a genomewide linkage map of a passerine will improve our understanding of the evolution of avian karyotypes, including the extent to which homologous chromosomes have undergone internal rearrangements during the course of avian evolution.
Specifically, in creating this map we aim to address the following questions: (i) How long is the zebra finch linkage map compared to the chicken?, (ii) To what extent is synteny conserved between chickens and a passerine?, (iii) To what extent is gene order conserved between the chicken and a passerine?, (iv) How does the recombination rate vary between macro- and microchromosomes?, and (v) How does the recombination rate differ between the sexes (heterochiasmy)?
MATERIALS AND METHODS
The study population:
A population of zebra finches has been studied at the University of Sheffield by one of us (T.R.B.) since 1985. Genealogical relationships spanning 20 generations are documented and tissue suitable for DNA extraction has been routinely collected from the population. A three-generation, 354-bird subpopulation was chosen for constructing the linkage map (hereafter the International Mapping Flock, IMF). Within the IMF there were 60 grandparents (generation 0), 43 parents (generation 1, G1), and 251 progeny (generation 2, G2). The mean sibship size among the progeny was 12.1 (range 9–27), although one G1 male was mated to two females, creating two G2 paternal half-sibships of size 17.
SNP identification:
SNPs were identified from sequence data obtained from 2,115,489 zebra finch cDNA sequences deposited in GenBank as trace files with identifiers ranging from gnl|ti|1503793708 through gnl|ti|1531125881. These cDNA sequences were generated by Washington University Genome Sequencing Center on a 454 Life Sciences ultra-high throughput pyrosequencing platform (Margulies et al. 2005). The cDNA libraries were unnormalized and had been obtained from testis (340,347 sequences), day-9-embryo (366,151 sequences), muscle (356,890 sequences), spleen (329,135 sequences), liver (435,409 sequences), and skin (287,557 sequences) tissue, each pooled from approximately six birds from the University of Sheffield population.
SNPs were identified using the QualitySNP software pipeline (Tang et al. 2006), which uses the CAP3 program (Huang and Madan 1999) for initial contig assembly. The following CAP3 parameters were used for contig assembly: percentage identity (−p) 95, minimum overlap length (−o) 21, maximum gap length in overlap (−f) 2, and gap penalty factor (−g) 200. These stringent settings are designed to minimize the erroneous detection of false positive SNPs in regions of overlap between similar but noncontiguous sequences. All other parameter settings were the default QualitySNP options. Contigs that contained SNPs were next compared against Assembly 2.1 of the chicken genome, using standalone BlastN (Altschul et al. 1997) implemented on a Linux workstation with parameter settings −G 2, −E 1, −q −1, −r 1, −W 9, −y 100, −Z 100, and −e 1e5, to assign a predicted location of the chicken ortholog of each contig, assuming conserved synteny and gene order between zebra finch and chicken. This enabled us to choose SNPs on the basis of maximum (and unbiased) genome coverage and identify the positions of intron–exon boundaries within contigs such that SNPs close to boundaries could be filtered out of the data set prior to designing the SNP assays.
A panel of 1536 putative SNPs was chosen for genotyping on the basis of the following criteria: genomewide coverage, a high QualitySNP confidence score (4 or 5 of a maximum possible score of 5), and sufficient flanking sequence for assay design (ideally 100 bp flanking sequence in both directions, but a minimum of at least 30 bp on each side of the SNP). Only 1 SNP per contig was genotyped, unless the BLAST search indicated that SNPs from within a contig were likely to occur in separate exons.
SNP genotyping:
DNA from the IMF was obtained by ammonium acetate extraction from tissue or whole blood samples. DNA concentration was quantified using PicoGreen (Invotrogen, Paisley, UK)) on a Fluostar Optima plate reader (BMG Labtech, Aylesbury, UK) to ensure that all samples contained at least 250 ng of DNA and were at a concentration of at least 50 ng/μl. The entire IMF was genotyped at 1536 putative SNPs by Illumina (San Diego) using the GoldenGate platform (Bibikova et al. 2006).
Map construction:
The linkage map was constructed using a version of CriMap v2.4 (Green et al. 1990), modified by Xuelu Liu (Monsanto) to accommodate large numbers of markers segregating in complicated pedigree structures. Linkage between pairs of markers was detected using the TWOPOINT command and linkage groups were formed using the AUTOGROUP command. AUTOGROUP groups markers via an iterative process on the basis of marker variability and linkage quality, starting at an upper, stringent layer and proceeding through lower, less stringent layers. The parameters included (i) the minimum threshold of LOD score for a linkage to be considered, (ii) minimum number of informative meioses for a marker to be included in terms of x times the mean number of informative meioses, (iii) the maximum number of linkages to other groups, and (iv) minimum linkage ratio for a marker's qualified links to the best linkage group (i.e., the proportion of two-point linkages for a given marker that are to markers in the same linkage group). The parameter layers were as follows: layer 1 (40, 2.0, 2, 0.9); layer 2 (20, 1.5, 3, 0.7); layer 3 (10, 1.0, 5, 0.6); and layer 4 (5, 0.4, 6, 0.5). The lower layer defines the minimum requirements for inclusion in a linkage group. In this way, linkage groups were created between markers that were linked at a log likelihood ratio (LOD score) > 5, had a minimum of 0.4 times the average number of meioses, that shared linkages with no more than six other groups, and had a minimum linkage ratio of 0.5 (Green et al. 1990).
During the initial stages of map building, tightly linked markers (recombination fraction = 0) were assembled into haplogroups using HAPLOGROUP (minimum threshold of LOD score for linkage = 10) and only the most informative marker in each haplogroup was used to build the map. This reduced the density of the map and omitted redundant markers from the initial stages of building. Using this subset of markers, a framework map of each linkage group was then constructed using BUILD. Markers were included in the framework map only if they could be assigned a most likely position with LOD > 5 better than any alternative position (markers on the framework map are referred to as framework markers). Nonframework markers were then added to the map iteratively using BUILD at a lower stringency, such that the final build included all markers at their most likely positions. Following this, markers contained in haplogroups were added and marker order was checked and confirmed using the FLIPS5 option. The function CHROMPIC was used to visualize individual haplotypes and identify possible marker order errors. This final map is referred to as the comprehensive map to distinguish it from the framework map (Keats et al. 1991). During the map construction both sex-averaged and sex-specific linkage maps were built. Evidence for heterochiasmy was evaluated by comparing the lengths of male and female maps, using bootstrapped estimates of the mean and 95% confidence intervals (C.I.).
Comparative mapping:
Because the position on the chicken genome (Mbp) of the ortholog of each SNP was known, it was possible to evaluate whether marker order was conserved between the zebra finch and the chicken. The marker order obtained from the constructed map was compared to the marker order observed in the chicken ortholog by comparing the likelihoods of the two alternative orders.
To compare the recombination rates (cM/Mbp) between chicken and zebra finch it was first necessary to estimate the position of the ortholog of each SNP on the chicken linkage map (in cM). This was achieved by first identifying all markers that were present on both the chicken linkage map (Groenen et al. 2000) and the chicken genome sequence assembly (International Chicken Genome Sequencing Consortium 2004). Markers with both physical and linkage map positions were downloaded from http://www.ncbi.nlm.nih.gov/mapview/map_search.cgi?taxid=9031. Next, because recombination rates are approximately constant across each chicken chromosome (Schmid et al. 2005), a linear regression of chicken linkage map position on chicken physical map position was performed, and then the putative position of each SNP was interpolated from the physical map position of its ortholog. This approach has previously been used successfully in comparisons of recombination rates between the great reed warbler and the chicken (Dawson et al. 2007). When comparing recombination rates between the chicken and zebra finch it was assumed that their genomes are of similar length. This assumption appears to be justified, as both genomes have been estimated by flow cytometry to be 1.25 pg (http://www.genomesize.com/), a value that is consistent with the length of the assembled chicken genome of ∼1.1 billion bp (http://www.ensembl.org/Gallus_gallus/index.html). Statistical analysis was carried out in R 2.6 (R Development Core Team 2006).
RESULTS
SNP typing:
Of the 1536 putative SNPs, 1298 (84.5%) produced scoreable genotypes in our pedigree. This is considerably more than the Illumina's expected success rate for nonvalidated SNPs of between 30 and 50%. The genotyping data were of good quality: 100% reproducibility, 95.5% call rate, and 0.17% parent–offspring error rate. Nine G1 individuals were excluded from analysis because they had a parent–offspring match frequency of <90% (calculated as the number of markers matching/total number of markers typed); this was equivalent to parent–offspring mismatches at up to 200 markers for each individual. For the remaining individuals, parent–offspring match frequencies were >99%, with mismatches ≤12 markers per individual. Of 1298 scored putative SNPs, 250 (19%) were monomorphic and another 142 (11%) had a low (<0.05) minor allele frequency (in total, 30% had minor allele frequencies between 0 and 0.05). The mean number (± standard error) of informative meiosis was 113.03 (±0.91). Most of the markers with predicted locations on the chicken Z chromosome were hemizygous in females, supporting their predicted location on the Z chromosome in the zebra finch. There were two exceptions: 0837 and 1249 exhibited heterozygotes in both males and females, and it is therefore likely that these markers are positioned within the pseudoautosomal region of the Z chromosome.
Mapping:
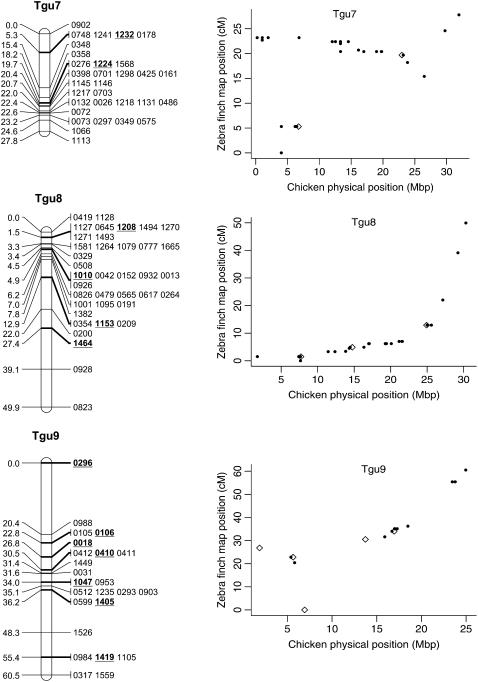
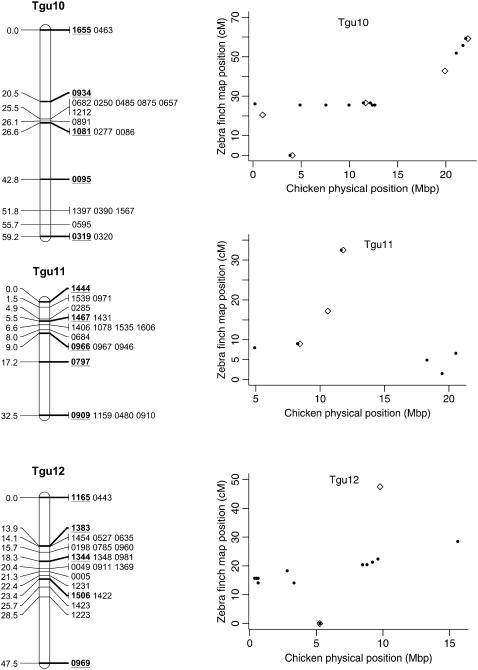
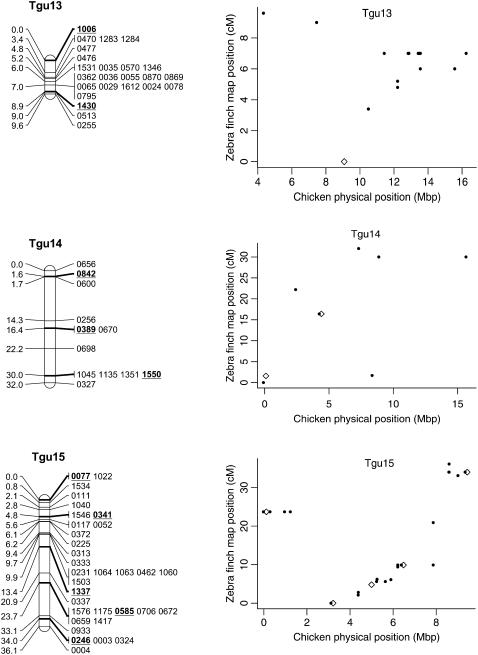
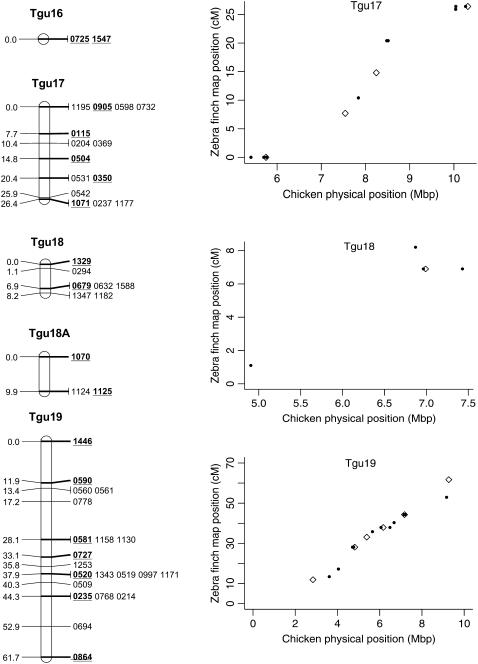
In total, 838 markers were assigned to 47 linkage groups using AUTOGROUP. The quality and linkage of markers not assigned to Taeniopygia guttata (Tgu) linkage groups were assessed and an additional 36 markers were added to linkage groups on the basis of the following criteria: (i) linked to another marker with LOD > 3, (ii) no conflicting linkages with other linkage groups, (iii) call rate > 0.5 (markers with low call rates may be more error prone), and (iv) a predicted location that corresponded to the rest of the markers on that linkage group. One additional linkage group was also created: Tgun5. This group contained two markers that had a linkage likelihood of 5.1, but were not originally assigned a linkage group because one marker had a low number of informative meioses (28). Most linkage groups corresponded to a single chicken chromosome Gallus gallus (Gga) (on the basis of the predicted location of each marker on the chicken genome, Figure 1) and each linkage group was numbered according to the homologous chicken chromosome number (with the prefix Tgu). In several cases markers with a common predicted Gga chromosome were split among more than one linkage group [markers with predicted locations on Gga1, 3, 4, 18, 20, 21, 23, 26, and LGE22C19W28_E50C23 (hereafter referred to as LGE22)]. For markers in these linkage groups the two-point linkage information was assessed and, in two cases (Tgu 20A–Tgu 20B and Tgu 23–Tgu 23A), groups were amalgamated to form a single group on the basis of the presence of links between groups (LOD > 3) and no conflicting linkages with other groups. The end result was a total of 45 linkage groups containing 876 (67%) markers (Table 1, Figure 2, and supplemental information). In total, 140 markers without predicted locations on Gga chromosomes were assigned to linkage groups and there were no instances where the predicted location of a marker conflicted with the predicted location of other markers in the same linkage group.
Figure 1.—
Interchromosomal rearrangements of the 10 largest chromosomes between chicken and zebra finch. Colored chromosomal segments show cases where more than one zebra finch linkage group corresponds to a single chicken chromosome.
TABLE 1.
Zebra finch linkage-map parameters for both the framework map and comprehensive map
| Framework map
|
Comprehensive map
|
|||||||||
|---|---|---|---|---|---|---|---|---|---|---|
| Linkage group (Tgu) | No. of markers | Map length (cM) | ΔLOD relative to chicken order | No. of markers | Map length (cM) | ΔLOD relative to chicken order | % coverage | Tgu RR (cM/Mbp) | Gga RR (cM/Mbp) | Gga/Tgu RR |
| 1 | 5 | 45.8 | 8.09 | 73 | 63.7 | 129.96 | 81 | 0.20 | 2.67 | 13.36 |
| 1A | 8 | 39.4 | 21.67 | 71 | 63.3 | 126.60 | — | 0.81 | 2.22 | 3.51 |
| 1B | 2 | 1.5 | — | 3 | 1.0 | 0.00 | — | — | — | — |
| 1C | 2 | 0.0 | 0.00 | 3 | 0.0 | 0.00 | — | — | — | — |
| 2 | 12 | 34.3 | 0.00 | 82 | 34.7 | 20.28 | 78 | 0.23 | 2.65 | 11.53 |
| 3 | 7 | 23.0 | 16.21 | 57 | 22.0 | 68.05 | 81 | 0.20 | 2.75 | 13.77 |
| 3A | 2 | 7.8 | 0.00 | 10 | 7.8 | 0.00 | — | 0.76 | 2.94 | — |
| 4 | 6 | 31.7 | 10.61 | 44 | 31.9 | 181.75 | 92 | 0.45 | 2.45 | 5.44 |
| 4A | 6 | 39.4 | 19.95 | 29 | 41.1 | 210.26 | — | 2.47 | 4.16 | 1.69 |
| 5 | 11 | 80.6 | 0.00 | 84 | 89.8 | 43.28 | 99 | 1.78 | 3.29 | 1.85 |
| 6 | 9 | 41.4 | 41.41 | 47 | 44.6 | 133.84 | 100 | 1.43 | 3.01 | 2.10 |
| 7 | 2 | 15.1 | 0.00 | 31 | 27.8 | 66.54 | 97 | 0.93 | 3.91 | 4.20 |
| 8 | 4 | 20.6 | 0.00 | 38 | 49.9 | 0.00 | 98 | 2.20 | 3.17 | 1.44 |
| 9 | 7 | 47.3 | 26.64 | 24 | 60.5 | 33.46 | 93 | 2.50 | 5.78 | 2.31 |
| 10 | 5 | 61.5 | 7.47 | 20 | 59.2 | 16.25 | 91 | 2.82 | 5.71 | 2.02 |
| 11 | 5 | 30.4 | 0.00 | 19 | 32.5 | 69.14 | 92 | 1.98 | 4.56 | 2.30 |
| 12 | 5 | 47.7 | — | 22 | 47.5 | 106.44 | 95 | 1.42 | 6.23 | 4.39 |
| 13 | 2 | 16.2 | — | 24 | 9.6 | 21.89 | 100 | 1.02 | 4.26 | 4.18 |
| 14 | 3 | 25.9 | 0.00 | 12 | 32.0 | 36.84 | 89 | 2.29 | 5.45 | 2.38 |
| 15 | 6 | 39.6 | 11.10 | 33 | 36.1 | 52.92 | 100 | 4.45 | 4.23 | 0.95 |
| 16 | 2 | 0.0 | — | 2 | 0.0 | — | 100 | — | — | — |
| 17 | 5 | 27.3 | 0.00 | 14 | 26.4 | 0.60 | 96 | 5.59 | 8.46 | 1.51 |
| 18 | 2 | 8.9 | — | 7 | 8.2 | 0.06 | 100 | 3.61 | 19.40 | 5.37 |
| 18a | 2 | 10 | — | 3 | 9.9 | 0.00 | — | — | — | — |
| 19 | 7 | 65.8 | 0.00 | 21 | 61.7 | 0.56 | 100 | 15.47 | 13.57 | 0.88 |
| 20 | 2 | 11 | 0.00 | 13 | 22.1 | 3.92 | 100 | 2.06 | 3.92 | 1.90 |
| 20a | 2 | 0.0 | 0.00 | 4 | 0.0 | 0.00 | — | — | — | — |
| 21 | 2 | 8.6 | 0.00 | 4 | 6.9 | 0.00 | 100 | 4.98 | — | — |
| 21A | 2 | 0.0 | — | 3 | 0.0 | 0.00 | — | — | — | — |
| 22 | 2 | 0.0 | — | 2 | 0.0 | — | 100 | — | — | — |
| 23 | 2 | 15.6 | 0.00 | 11 | 39.9 | 23.63 | 100 | 6.33 | 0.78 | 0.12 |
| 24 | 2 | 5.8 | 0.00 | 7 | 33.9 | 0.00 | — | 12.05 | 14.67 | 1.22 |
| 25 | 2 | 0.0 | — | 3 | 5.9 | — | — | — | — | — |
| 26 | 2 | 15.1 | — | 6 | 17.8 | 0.00 | 100 | 5.97 | 8.98 | 1.50 |
| 26A | 2 | 8.6 | — | 3 | 7.7 | — | — | 2.60 | 10.66 | 4.10 |
| 27 | 2 | 7.7 | — | 6 | 4.7 | 0.00 | 100 | — | — | — |
| 28 | 2 | 6.2 | 0.00 | 7 | 12.7 | 0.00 | 100 | 5.29 | 15.71 | 2.97 |
| LGE22 | 2 | 6.1 | — | 3 | 6.1 | 0.00 | 100 | — | — | — |
| LGE22A | 2 | 0.0 | 0.00 | 2 | 0.0 | 0.00 | — | — | — | — |
| n1 | 2 | 2.7 | — | 3 | 2.7 | — | — | — | — | — |
| n2 | 2 | 5.5 | — | 3 | 5.5 | — | — | — | — | — |
| n3 | 2 | 8.3 | — | 3 | 7.6 | — | — | — | — | — |
| n4 | 2 | 0.0 | — | 3 | 0.0 | — | — | — | — | — |
| n5 | 2 | 0.0 | — | 2 | 0.0 | — | — | — | — | — |
| Z | 3 | 28.7 | 8.79 | 15 | 32.8 | 80.62 | 61 | 0.48 | 2.93 | 13.82 |
| Total mean | 168 | 891.1 | 876 | 1067.5 | 86 | 3.18 | 6.02 | 4.16 | ||
Gga, (chicken) Gallus gallus; Tgu, (zebra finch) Taeniopygia guttata; RR, recombination rate of homologous regions; % coverage, percentage of chromosome estimated to be within 2.5 Mbp of a SNP.
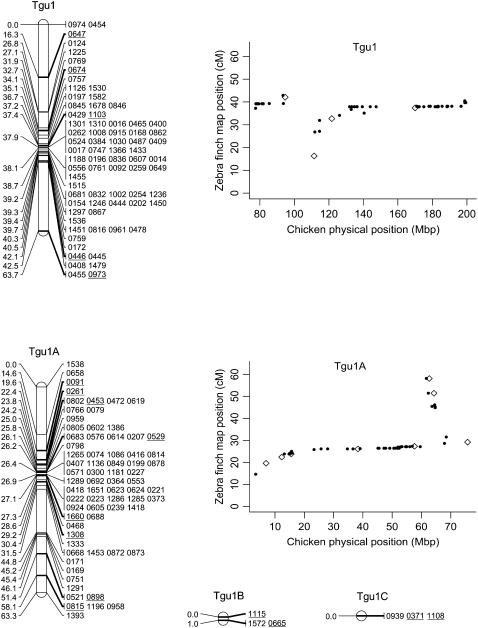
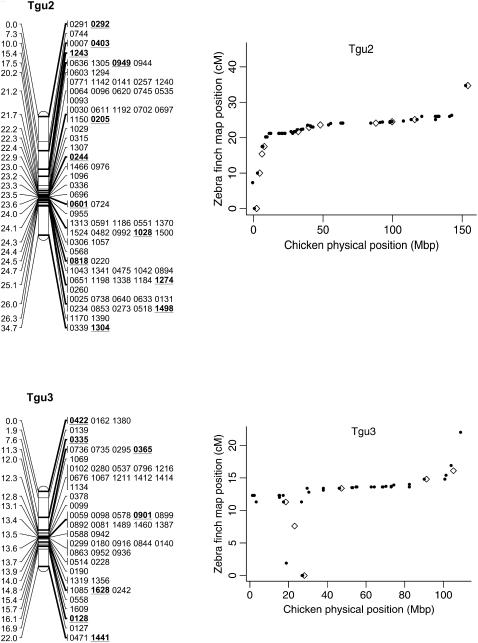
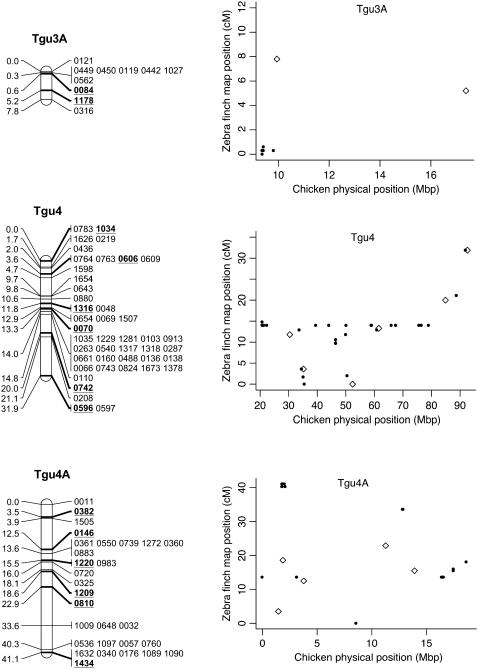
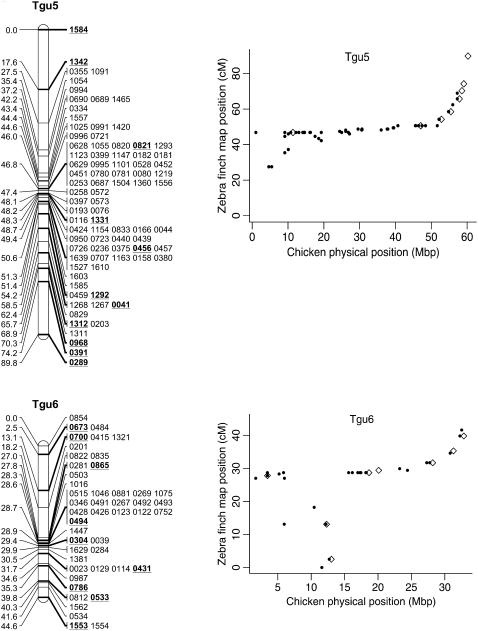
Figure 2.—
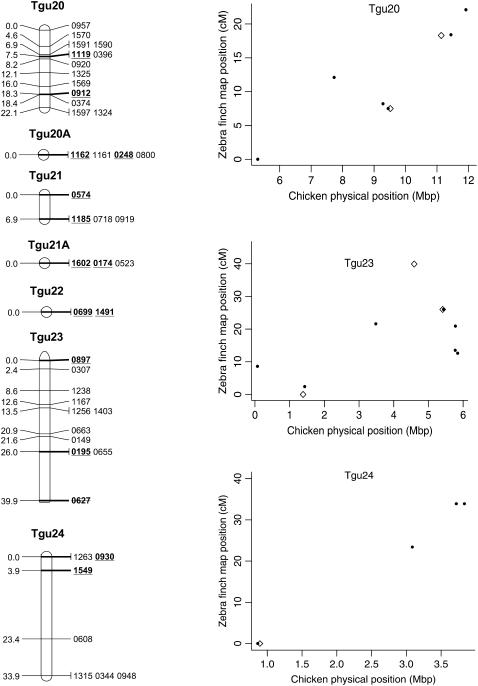
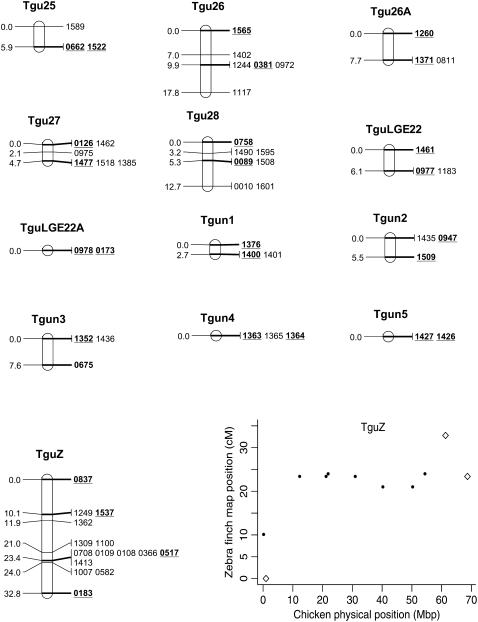
Genetic linkage map of the zebra finch genome and comparative graphs showing the linkage map position (cM) plotted against the predicted position in the chicken (Mbp) for each linkage group. The framework loci (order supported by LOD > 5) are in boldface type and underlined on the linkage maps and represented by open diamonds on the comparative graphs. Remaining markers are presented in regular type on the linkage map and as solid circles on the comparative graphs. Comparative graphs are plotted only for the linkage groups that have four or more markers with predicted locations in the chicken.
The framework map consisted of 168 markers and spanned 891.1 cM (the comprehensive map of 876 markers was slightly longer at 1067.5 cM). The average marker interval was 5.2 cM (range 0–16.2 cM) on the framework map and 1.14 cM (0–3.3 cM) on the comprehensive map. Although the map is approximately one-quarter the length of the chicken linkage map (3800 cM) (Groenen et al. 2000), it has wide genome coverage with markers spanning chromosomes homologous to the Gga1–28, GgaZ, and LGE22. All sequenced and assembled chicken chromosomes except Gga32, GgaLGE64, and GgaW have a homologous mapped zebra finch linkage group. Five of the zebra finch linkage groups (Tgun1–5) do not have an assembled homolog in chicken, suggesting these linkage groups could be homologous to one of the nine unassembled chicken microchromosomes. The SNPs provided good genome coverage; 86.2% of the genome is predicted to be within 2.5 Mbp of a SNP (96.5% is predicted to be within 5 Mbp of a SNP) (Table 1).
Synteny and rearrangements:
The general correspondence of Tgu linkage groups to Gga chromosomes suggests little interchromosomal rearrangement and very conserved synteny between the chicken and zebra finch karotypes (Figure 1). However, as predicted we found evidence of a fission of Gga1 (ancestral avian chromosome 1) that resulted in two large Tgu chromosomes (Tgu1 and Tgu1A). Two markers in Tgu1C (1108 and 0371) were linked to markers on Tgu1 (0455 and 0973) with LOD scores of 2–3, but no substantial links (LOD ≥ 2) were present between the other linkage groups corresponding to Gga1. Gga4 corresponded to one large and one small Tgu chromosome (Tgu4 and Tgu4A), akin to the predicted avian ancestral state (Griffin et al. 2007). Although Gga3 is represented by two linkage groups there was some evidence to suggest these two linkage groups are actually on a single chromosome in zebra finch. Linkages of LOD 1.5–2.2 were present between markers on Tgu3 and Tgu3A (0162 and 1380 were linked to 0450 and 0316; 0295 and 1178 were linked to 0422).
Despite the conserved chromosomal synteny, there was convincing evidence of changes in gene order. Considering only the framework maps, which have strong support but sparse coverage, we identified rearrangements on 6 of the 10 chicken macrochromosomes (Tgu1, Tgu1A, Tgu3, Tgu4, Tgu4A, Tgu6, Tgu9, and Tgu10; Figure 2). In cases where we observed rearrangements, the Tgu marker order was better than the Gga predicted order by a LOD > 7.47 (Table 1). For the comprehensive maps, which have greater coverage, the difference in log likelihoods between the best zebra finch marker order and the chicken marker order was even more striking, and intrachromosomal rearrangements were also evident on the microchromosomes. Among linkage groups containing four or more markers with predicted locations, the chromosomes with the most conserved marker order were Tgu2, Tgu8, Tgu17, and Tgu19. The simplest rearrangements were inversions, often of large chromosomal segments, which were evident on Tgu1A (inverted region equivalent to Gga physical locations 62.4–75.7 Mbp), Tgu3A (9.4–9.9 Mbp), Tgu6 (2.0–13.0 Mbp), Tgu9 (1.8–6.9 Mb), Tgu10 (0.4–4.1 Mbp), Tgu18 (6.8–6.9 Mbp), Tgu20 (7.7–9.5 Mbp), and TguZ (12.9–68.6 Mbp). In some cases there appear to have been more complex rearrangements, for example Tgu1 (7.8–11.5 Mbp), Tgu3 (2.4–4.3 Mbp), Tgu4 (30.0–30.6 Mbp and 47.1–52.3 Mbp), Tgu4A (1.5–3.7 Mbp and 13.0–18.8 Mbp), Tgu7 (0.5–26.8 Mbp), Tgu11 (18.4–20.6 Mbp), Tgu12 (0.5–5.4 Mbp and 9.7–15.7 Mbp), Tgu14 (2.5–8.5 Mbp), and Tgu15 (0.1–3.8 Mbp).
Recombination rate:
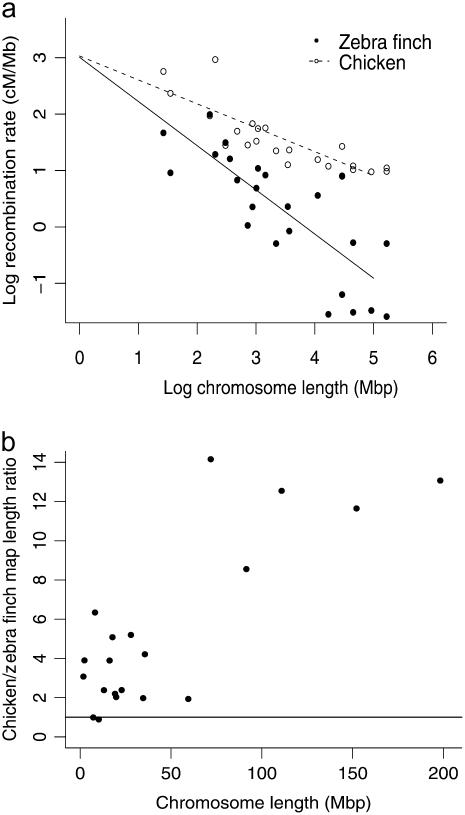
We used linear models to investigate whether recombination rate was a function of the chromosome physical length and also whether the recombination rate in zebra finches differed from that in chickens. There was a strong negative relationship between the chromosome size and recombination rate (cM/Mbp), and the slope of this relationship differed in the zebra finch and the chicken (Figure 3a; species, F1,53 = 33.67, P < 0.001; chromosome length, F1,53 = 74.13, P < 0.001; interaction between species and chromosome length, F3,53 = 11.06, P = 0.01). The mean recombination rate was lower in zebra finches than in chickens (3.18 cM/Mbp and 6.02 cM/Mbp, respectively), but the difference between the two species was greater on the macrochromosomes. The map length ratio of chicken to zebra finch (chicken map length/zebra finch map length) was positively related to chromosome length (Figure 3b: F1,21 = 6.26, P = 0.02). On the macrochromosomes the chicken linkage map length was 8–14 times longer, but on the microchromosomes the ratio was closer to 1, i.e., equal map lengths in the two species.
Figure 3.—
(a) The relationship between the log of recombination rate (cM/Mbp) and the log of chicken chromosomal length for homologous chromosomal regions of the zebra finch and the chicken. (b) The ratio of linkage map length between the chicken and the zebra finch (chicken map length/zebra finch map length) plotted against chicken chromosomal length. The solid line represents a 1:1 ratio between chicken and zebra finch. Note that recombination rates in the two species are similar for microchromosomes, but are much higher in chickens than in zebra finches on most of the macrochromosomes.
There was little evidence of heterochiasmy as assessed by map lengths. The male and female maps were of similar length (entire length of framework map female:male = 899.6:809.4 cM, mean difference for each linkage group = 1.27 cM, 95% C.I. −1.54–4.51 cM; entire length of comprehensive map female:male = 1030.7:1017.7, mean difference for each group = −0.10 cM, 95% C.I. −2.39–1.91 cM). In 17/36 cases, linkage groups were longer in males, and in 19 cases they were longer in females (map length = 0 cM in the other 9 linkage groups).
DISCUSSION
Here we provide the first whole-genome linkage map for a passerine bird, which will be a valuable tool for zebra finch genome assembly and mapping quantitative trait loci. Linkage analysis identified 45 linkage groups including homologs of chicken chromosomes 2, 5–17, 19, 22–25, 27, and Z and more than one group corresponding to each of the chicken chromosomes 1, 3, 4, 18, 20, 21, 26, and LGE22.
Conserved synteny:
This study confirms the remarkable degree of conserved synteny in bird species (Introduction and references therein). It was already anticipated that chicken chromosomes 1 and 4 would be represented by more than one linkage group in zebra finches (Itoh and Arnold 2005); Gga1 is known to have undergone a fission in the lineage leading to passerines, while Gga4 is a derived fusion of two ancestral chromosomes (Griffin et al. 2007). Although Gga3 corresponded to two linkage groups in our study (Tgu3 and Tgu3A), there is some evidence to suggest that these two linkage groups are on a single Tgu chromosome. First, cytogenetic evidence suggests conserved homology between Gga3 and a single zebra finch chromosome, a pattern that is consistent in other bird orders (Itoh and Arnold 2005). Second, markers in Tgu3A were linked to markers on Tgu3, albeit at lower likelihoods (maximum linkage LOD was 2.2), and there was a higher proportion of twopoint linkages of LOD > 1.5 between Tgu3 and 3A than between any other pair of linkage groups. Future mapping studies may help to elucidate this. No a priori evidence exists to support the putative microchromosomal fusions/fissions relative to the chicken and it is as yet unknown how these linkage groups are arranged across the zebra finch chromosomes. As recombination rates are relatively high in the microchromosomes and they contain relatively few markers, it is probable that the power to detect linkage between markers is lower than on the macrochromosomes. Therefore, we suspect that most of the pairs of linkage groups that share homology with a single chicken microchromosome are in fact also located on a single zebra finch chromosome. In summary, the zebra finch map provides further support for there having been few interchromosomal rearrangements between different avian orders, although a previously undescribed putative fission of the passerine homolog of Gga3 is worthy of further investigation.
Conservation of gene order:
Despite conserved synteny, there was a greater than expected frequency of intrachromosomal rearrangement. Changes in marker order were found on 6 of the 10 largest chromosomes when using the framework maps, where marker order was well supported (LOD > 5), and on nearly all the linkage groups (where predicted locations were known) when we use the comprehensive maps. Most of these putative rearrangements show very strong statistical support for the putative gene order over the chicken marker order (see Table 1). Gene order rearrangements on the Z chromosome are consistent with those previously reported by Itoh et al. (2006). In particular, the two TguZ markers believed to be in the pseudoautosomal region (PAR) (00837 and 01249) mapped to the distal end of TguZ, which is consistent with their predicted chicken locations (967,952 bp and 877,348 bp). Previous cytogenetic mapping of the Z chromosome also reported that the PAR region was conserved between chicken and zebra finch (Itoh et al. 2006). To our knowledge these are the first SNPs to be identified within the PAR for any bird species (Wahlberg et al. 2007).
Although previous linkage mapping studies of passerines have identified some intrachromosomal rearrangements (Backström et al. 2006; Dawson et al. 2007; Hale et al. 2008), the extent of autosomal intrachromosomal rearrangement observed here has not previously been reported. At this stage it is unclear whether this is because previous maps lacked sufficiently high marker density to detect rearrangements or whether zebra finches show a less conserved gene order relative to chickens than do other passerines. It is notable that Dawson et al. (2007) reported conserved gene order between great reed warblers (A. arundinaceus) and chickens on chromosomes Gga3 and Gga5 (typed at 5 and 8 markers, respectively), whereas we found rearrangements on these chromosomes when using a larger number of markers. Comparative maps between passerines are now feasible, using sets of markers with cross-species applicability (Slate et al. 2007; Backström et al. 2008), which will provide insights into the extent to which gene order is conserved within passerines. One practical consequence of the observed intrachromosomal rearrangements that we report is that predicted maps, on the basis of sequence similarity between chicken and other species (Dawson et al. 2006), may provide accurate chromosomal assignments of markers, but less accurate predictions of marker order along a chromosome.
Recombination rates:
A notable feature of the chicken genome is its high recombination rate and long linkage map length relative to its genome size and, until recently, it was unclear if this was a common feature of avian genomes (Ellegren 2005). In the two other Galliformes where data are available, the turkey and the quail, map lengths are only slightly shorter than in the chicken; 29 turkey chromosomes span 2011 cM (Reed et al. 2005) and for quail, 44 chromosomes span ∼2600 cM (Kikuchi et al. 2005) or 8 macrochromosomes span 1514 cM (Sasazaki et al. 2006). In contrast, in the great reed warbler the recombination rate appears to be only ∼10% of that in the chicken (Dawson et al. 2007), whereas the collared flycatcher Z chromosome has a rate ∼50% that of the chicken (Backström et al. 2006). The zebra finch map is approximately one quarter the length of the chicken linkage map, despite the similar genome size of the two species. This would suggest that chickens have unusually high recombination rates, great reed warblers have unusually low recombination rates, and other passerines are intermediate in this respect. However, care must be taken to compare homologous chromosomes when making cross-species comparisons in recombination rates. This is because microchromosomes are physically short, but have an obligate crossing-over event during meiosis, such that they must have a minimum linkage map length of 50 cM. Therefore, differences between species are largely attributable to macrochromosomes (see Figure 3). A cross-species comparison of chromosomes homologous to Gga1, Gga2, Gga3, Gga5, Gga8, Gga9, Gga13, and GgaZ [the chromosomes that have been compared between great reed warblers and chickens (Dawson et al. 2007)] reveals that recombination rates in zebra finches range from 0.20–2.50 cM/Mbp (mean = 1.06 cM/Mbp) and are only marginally higher than observed in the great reed warbler. On the Z chromosome the recombination rate is lower than that observed in the great reed warbler and the collard flycatcher (F. albicollis) (Backström et al. 2006; Dawson et al. 2007). It seems that passerines will generally have lower recombination rates than the chicken, and that the low recombination rate observed in great reed warblers is not dramatically lower than in other passerine species.
The heterogeneity of chromosome size is a unique feature of avian genomes and thus the map presents an opportunity to investigate how recombination rate varies with chromosome length. The negative relationship between recombination rate and chromosome physical length first identified in the chicken (2.8–6.4 cM/Mb; International Chicken Genome Sequencing Consortium 2004) is even more pronounced in the zebra finch. This has consequences for QTL mapping and, in particular, fine mapping studies. The relatively short linkage map means that a modest number of markers should be able to identify QTL by linkage mapping. However, the density of markers required to fine-map a QTL will depend on whether the QTL resides on a macro- or microchromosome. Because linkage disequilibrium is broken down by recombination, statistical associations between traits and microchromosomal markers are likely to indicate that the marker is physically close to the QTL. For fine mapping, the marker density needs to be higher on microchromosomes than macrochromosomes, but the feasibility of positionally cloning a causative mutation is, in theory, greater on smaller chromosomes.
Heterochiasmy:
The Haldane–Huxley rule predicts that the recombination rate will be reduced in the heterogametic sex (Huxley 1928; Haldane 1992). In great reed warblers, the opposite of the Haldane–Huxley rule is observed, where females (the heterogametic sex in birds) have a recombination rate 1.5–2.1 times greater than that in males (Hansson et al. 2005; Åkesson et al. 2007). Here we found little evidence of heterochiasmy in the zebra finch, where the female/male map length ratio was effectively one (1.09 for the framework map and 1.01 for the comprehensive map), which is consistent with the chicken linkage map (Groenen et al. 2000). It has been proposed that heterochiasmy is the result of sexual selection, with the sex exhibiting the greater variance in reproductive success exhibiting the lower recombination rate (Trivers 1988); this is one possible explanation for the patterns seen in the great reed warbler (Hansson et al. 2005). Although the zebra finch is sexually dimorphic, it is possible that heterochiasmy has been lost in the mapping population because the difference in variance in reproductive success between the two sexes is relatively low in captivity. Therefore, a sexual selection-based hypothesis for heterochiasmy is not necessarily excluded by our findings, particularly if recombination rates are adaptively plastic.
Summary:
The linkage map of the zebra finch genome is the most comprehensive map of a passerine species to date. Estimated genome coverage is comparable to that of the chicken linkage map (Groenen et al. 2000). The availability of high-throughput sequencing and genotyping technologies meant that the entire process from marker discovery to map construction took a small team less than 1 year to complete. The map has already provided new insights into the evolution of avian genomes and will be a valuable tool for validating the genome sequence assembly, for detecting QTL, and for comparative genomic studies.
Acknowledgments
The zebra finch mapping population was maintained and archived by Jayne Pellatt. We thank Alex Ball, Deborah Dawson, and Andy Krupa for preparing the DNA samples. Deborah Dawson also provided useful comments on the manuscript. Sarah Follett performed RNA extractions from the birds that were sequenced on the 454 platform. Karine Viaud (Illumina) coordinated SNP genotyping and assay design. The cDNA sequencing was completed at Washington University School of Medicine, Genome Sequencing Center, and funded by the National Human Genome Research Institute (NHGRI). This work was funded by the United Kingdom Biotechnology and Biological Sciences Research Council (BBSRC) under grant no. BBE0175091.
References
- Aerts, J., H. J. Megens, T. Veenendaal, I. Ovcharenko, R. Crooijmans et al., 2007. Extent of linkage disequilibrium in chicken. Cytogenet. Genome Res. 117 338–345. [DOI] [PubMed] [Google Scholar]
- Åkesson, M., B. Hansson, D. Hasselquist and S. Bensch, 2007. Linkage mapping of AFLP markers in a wild population of great reed warblers: importance of heterozygosity and number of genotyped individuals. Mol. Ecol. 16 2189–2202. [DOI] [PubMed] [Google Scholar]
- Altschul, S., T. Madden, A. Schaffer, J. H. Zhang, Z. Zhang et al., 1997. Gapped BLAST and PSI-BLAST: a new generation of protein database search programs. Nucleic Acids Res. 25 3389–3402. [DOI] [PMC free article] [PubMed] [Google Scholar]
- Backström, N., M. Brandström, L. Gustafsson, A. Qvarnström, H. Cheng et al., 2006. Genetic mapping in a natural population of collared flycatchers (Ficedula albicollis): conserved synteny but gene order rearrangements on the avian Z chromosome. Genetics 174 377–386. [DOI] [PMC free article] [PubMed] [Google Scholar]
- Backström, N., S. Fagerberg and H. Ellegren, 2008. Genomics of natural bird populations: a gene-based set of reference markers evenly spread across the avian genome. Mol. Ecol. 17 964–980. [DOI] [PubMed] [Google Scholar]
- Barker, F. K., A. Cibois, P. Schikler, J. Feinstein and J. Cracraft, 2004. Phylogeny and diversification of the largest avian radiation. Proc. Natl. Acad. Sci. USA 101 11040–11045. [DOI] [PMC free article] [PubMed] [Google Scholar]
- Bennett, P., and I. Owens, 2002. Evolutionary Ecology of Birds. Oxford University Press, Oxford.
- Bibikova, M., Z. Lin, L. Zhou, E. Chudin, E. W. Garcia et al., 2006. High-throughput DNA methylation profiling using universal bead arrays. Genome Res. 16 383–393. [DOI] [PMC free article] [PubMed] [Google Scholar]
- Birkhead, T. R., E. J. Pellatt, P. Brekke, R. Yeates and H. Castillo-Juarez, 2005. Genetic effects on sperm design in the zebra finch. Nature 434 383–387. [DOI] [PubMed] [Google Scholar]
- Dawson, D. A., T. Burke, B. Hansson, J. Pandhal, M. C. Hale et al., 2006. A predicted microsatellite map of the passerine genome based on chicken-passerine sequence similarity. Mol. Ecol. 15 1299–1320. [DOI] [PubMed] [Google Scholar]
- Dawson, D. A., M. Åkesson, T. Burke, J. M. Pemberton, J. Slate et al., 2007. Gene order and recombination rate in homologous chromosome regions of the chicken and a passerine bird. Mol. Biol. Evol. 24 1537–1552. [DOI] [PubMed] [Google Scholar]
- Derjusheva, S., A. Kurganova, F. Habermann and E. Gaginskaya, 2004. High chromosome conservation detected by comparative chromosome painting in chicken, pigeon and passerine birds. Chromosome Res. 12 715–723. [DOI] [PubMed] [Google Scholar]
- Ellegren, H., 2005. The avian genome uncovered. Trends Ecol. Evol. 20 180–186. [DOI] [PubMed] [Google Scholar]
- Evans, M. R., M. L. Roberts, K. L. Buchanan and A. R. Goldsmith, 2006. Heritability of corticosterone response and changes in life history traits during selection in the zebra finch. J. Evol. Biol. 19 343–352. [DOI] [PubMed] [Google Scholar]
- Gil, D., J. Graves, N. Hazon and A. Wells, 1999. Male attractiveness and differential testosterone investment in Zebra finch eggs. Science 286 126–128. [DOI] [PubMed] [Google Scholar]
- Green, P., K. Falls and S. Crooks, 1990. Documentation for CRIMAP. http://compgen.rutgers.edu/multimap/crimap.
- Griffin, D. K., L. B. W. Robertson, H. G. Tempest and B. M. Skinner, 2007. The evolution of the avian genome as revealed by comparative molecular cytogenetics. Cytogenet. Genome Res. 117 64–77. [DOI] [PubMed] [Google Scholar]
- Groenen, M. A. M., H. H. Cheng, N. Bumstead, B. F. Benkel, W. E. Briles et al., 2000. A consensus linkage map of the chicken genome. Genome Res. 10 137–147. [DOI] [PMC free article] [PubMed] [Google Scholar]
- Haldane, J. B. S., 1992. Sex ratio and unisexual sterility in hybrid animals. J. Genet. 12 101–109. [Google Scholar]
- Hale, M. C., H. Jensen, T. R. Birkhead, T. Burke and J. Slate, 2008. A comparison of synteny and gene order on the homologue of chicken chromosome 7 between passerine species and between passerines and chicken. Cytogenet. Genome Res. 127: (in press). [DOI] [PubMed]
- Hansson, B., M. Åkesson, J. Slate and J. M. Permberton, 2005. Linkage mapping reveals sex-dimorphic map distances in passerine bird. Proc. R. Soc. Lond. B 272 2289–2298. [DOI] [PMC free article] [PubMed] [Google Scholar]
- Heifetz, E. M., J. E. Fulton, N. O'Sullivan, H. Zhao, J. C. M. Dekkers et al., 2005. Extent and consistency across generations of linkage disequilibrium in commercial layer chicken breeding populations. Genetics 171 1173–1181. [DOI] [PMC free article] [PubMed] [Google Scholar]
- Huang, X. Q., and A. Madan, 1999. CAP3: A DNA sequence assembly program. Genome Res. 9 868–877. [DOI] [PMC free article] [PubMed] [Google Scholar]
- Huxley, J. S., 1928. Sexual differences of linkage Gammarus chevreuxi. J. Genet. 20 145–156. [Google Scholar]
- International Chicken Genome Sequencing Consortium, 2004. Sequence and comparative analysis of the chicken genome provide unique perspectives on vertebrate evolution. Nature 432 695–716. [DOI] [PubMed] [Google Scholar]
- Itoh, Y., and A. P. Arnold, 2005. Chromosomal polymorphism and comparative painting analysis in the zebra finch. Chromosome Res. 13 47–56. [DOI] [PubMed] [Google Scholar]
- Itoh, Y., K. Kampf and A. P. Arnold, 2006. Comparison of the chicken and zebra finch Z chromosomes shows evolutionary rearrangements. Chromosome Res. 14 805–815. [DOI] [PubMed] [Google Scholar]
- Kao, M. H., A. J. Doupe and M. S. Brainard, 2005. Contributions of an avian basal ganglia-forebrain circuit to real-time modulation of song. Nature 433 638–643. [DOI] [PubMed] [Google Scholar]
- Keats, B. J. B., S. L. Sherman, N. E. Morton, E. B. Robson, K. H. Buetow et al., 1991. Guidelines for human linkage maps -an international system for human linkage maps (ISLM, 1990). Ann. Hum. Genet. 55 1–6. [DOI] [PubMed] [Google Scholar]
- Kikuchi, S., D. Fujima, S. Sasazaki, S. Tsuji, A. Mizutani et al., 2005. Construction of a genetic linkage map of Japanese quail (Coturnix japonica) based on AFLP and microsatellite markers. Anim. Genet. 36 227–231. [DOI] [PubMed] [Google Scholar]
- Lack, D., 1968. Ecological Adaptations for Breeding in Birds. Methuen, London.
- Margulies, M., M. Egholm, W. E. Altman, S. Attiya, J. S. Bader et al., 2005. Genome sequencing in microfabricated high-density picolitre reactors. Nature 437 376–380. [DOI] [PMC free article] [PubMed] [Google Scholar]
- Merilä, J., and B. C. Sheldon, 2001. Avian quantitative genetics. Curr. Ornithol. 16 179–255. [Google Scholar]
- Nottebohm, F., and A. P. Arnold, 1976. Sexual dimorphism in vocal control areas of songbird brain. Science 194 211–213. [DOI] [PubMed] [Google Scholar]
- Passarge, E., B. Horsthemke and R. A. Farber, 1999. Incorrect use of the term synteny. Nat. Genet. 23 387. [DOI] [PubMed] [Google Scholar]
- Price, C. S. C., C. H. Kim, C. J. Gronlund and J. A. Coyne, 2001. Cryptic reproductive isolation in the Drosophila simulans species complex. Evolution 55 81–92. [DOI] [PubMed] [Google Scholar]
- R Development Core Team, 2006. R: A Language and Environment for Statistical Computing. R Foundation for Statistical Computing, Vienna.
- Reed, K. M., L. D. Chaves, M. K. Hall, T. P. Knuston and D. E. Harry, 2005. A comparative genetic map of the turkey genome. Cytogenet. Genome Res. 111 118–127. [DOI] [PubMed] [Google Scholar]
- Sasazaki, S., T. Hinenoya, B. Lin, A. Fujiwara and H. Mannen, 2006. A comparative map of macrochromosomes between chicken and Japanese quail based on orthologous genes. Anim. Genet. 37 316–320. [DOI] [PubMed] [Google Scholar]
- Schmid, M., I. Nanda, H. Hoehn, M. Schartl, T. Haaf et al., 2005. Second report on chicken genes and chromosomes 2005. Cytogenet. Genome Res. 109 415–479. [DOI] [PubMed] [Google Scholar]
- Shetty, S., D. K. Griffin and J. A. M. Graves, 1999. Comparative painting reveals strong chromosome homology over 80 million years of bird evolution. Chromosome Res. 7 289–295. [DOI] [PubMed] [Google Scholar]
- Sibley, C., and J. Ahlquist, 1990. Phylogeny and Classification of Birds: A Study in Molecular Evolution. Yale University Press, New Haven, CT.
- Slate, J., M. C. Hale and T. R. Birkhead, 2007. Simple sequence repeats in zebra finch (Taeniopygia guttata) expressed sequence tags: a new resource for evolutionary genetic studies of passerines. BMC Genomics 8 52. [DOI] [PMC free article] [PubMed] [Google Scholar]
- Tang, J. F., B. Vosman, R. E. Voorrips, C. G. Van Der Linden and J. A. M. Leunissen, 2006. QualitySNP: a pipeline for detecting single nucleotide polymorphisms and insertions/deletions in EST data from diploid and polyploid species. BMC Bioinformatics 9 438.. [DOI] [PMC free article] [PubMed] [Google Scholar]
- Tchernichovski, O., P. P. Mitra, T. Lints and F. Nottebohm, 2001. Dynamics of the vocal imitation process: how a zebra finch learns its song. Science 291 2564–2569. [DOI] [PubMed] [Google Scholar]
- Trivers, R., 1988. Sex differences in rates of recombination and sexual selection, pp. 270–286 in The Evolution of Sex, edited by R. Michob and B. Levin. Sinauer Associates, Sunderland, MA.
- Wahlberg, P., L. Stromstedt, X. Tordoir, M. Foglio, S. Heath et al., 2007. A high-resolution linkage map for the Z chromosome in chicken reveals hot spots for recombination. Cytogenet. Genome Res. 117 22–29. [DOI] [PubMed] [Google Scholar]
- Yu, A. C., and D. Margoliash, 1996. Temporal hierarchical control of singing in birds. Science 273 1871–1875. [DOI] [PubMed] [Google Scholar]
- Zann, R. A., 1996. The Zebra Finch: A Synthesis of Field and Laboratory Studies. Oxford University Press, Oxford.


