Abstract
The promising but still limited efficacy of angiogenesis inhibitors as monotherapies for cancer treatment indicates a need to integrate these agents into existing therapeutic regimens. Presently, we investigate the anti-tumor activity of the small molecule angiogenesis inhibitor axitinib (AG-013736) and its potential for combination with metronomic cyclophosphamide (CPA). Axitinib significantly inhibited angiogenesis in rat 9L tumors grown s.c. in scid mice, but only moderately delayed tumor growth. Combination of axitinib with metronomic CPA fully blocked 9L tumor growth upon initiation of drug treatment. In contrast, metronomic CPA alone required multiple treatment cycles to halt tumor growth. However, in contrast to the substantial tumor regression that is ultimately induced by metronomic CPA, the axitinib/CPA combination was tumor growth static. Axitinib did not inhibit hepatic activation of CPA or export of its activated metabolite, 4-OH-CPA, to extrahepatic tissues; rather, axitinib selectively decreased 9L tumor uptake of 4-OH-CPA by 30–40%. The reduced tumor penetration of 4-OH-CPA was associated with a decrease in CPA-induced tumor cell apoptosis and a block in the induction of the endogenous angiogenesis inhibitor TSP-1 in tumor-associated host cells, which may contribute to the absence of tumor regression with the axitinib/CPA combination. Finally, axitinib transiently increased 9L tumor cell apoptosis, indicating that its effects are not limited to the endothelial cell population. These findings highlight the multiple effects that may characterize anti-angiogenic agent–metronomic chemotherapy combinations, and suggest that careful optimization of drug scheduling and dosages will be required to maximize anti-tumor responses.
Keywords: anti-angiogenesis, axitinib (AG-013736), metronomic cyclophosphamide, combination therapy
INTRODUCTION
Since the approval of bevacizumab for use in combination with 5-fluorouracil-based chemotherapy for metastatic colorectal cancer in 2004, several anti-angiogenesis drugs have been approved for cancer treatment and others are progressing through preclinical and clinical development (1, 2). Many of these new agents primarily target the vascular endothelial growth factor (VEGF) signaling pathway, inducing rapid vasoconstriction by decreasing the relaxation of pericytes and smooth muscle cells, followed by slower responses including the inhibition of new blood vessel formation and pruning of immature vessels (3). Anti-angiogenic drugs are typically cytostatic rather than cytoreductive and often show moderate efficacy when used as monotherapies, highlighting the importance of integrating these new treatment options with traditional cancer therapies (4, 5). In some but not all cases, anti-angiogenic drug treatments normalize the tumor vasculature, thereby facilitating the delivery of chemotherapeutic drugs and oxygen into the tumor and improving therapeutic responses (6). However, the optimal dose needs to be determined carefully for each anti-angiogenesis drug and likely for each combination therapy.
Metronomic chemotherapy involves the administration of a chemotherapeutic drug at a reduced dose compared to traditional treatment regimens but at regular, more frequent intervals without extended rest periods (7, 8). In contrast to traditional maximal tolerated dose (MTD) therapy, metronomic chemotherapy is not only cytotoxic against tumor cells, but also exerts an anti-angiogenic effect toward tumor-associated endothelial cells. The anti-endothelial activity can in part be explained by the high intrinsic sensitivity of proliferating endothelial cells to chemotherapeutic drugs and by the induction of the endogenous angiogenesis inhibitor thrompospondin-1 (TSP-1) (7, 9, 10). The most extensively studied metronomic chemotherapy uses the oxazaphosphorine alkylating agent cyclophosphamide (CPA), which can be administrated on an every 6-d schedule or continuously (11, 12). The anti-tumor effect of metronomic CPA can be further improved by using gene therapy vectors to effect intratumoral expression of a CPA-activating cytochrome P450 enzyme, as demonstrated in preclinical studies (13, 14).
Axitinib (AG-013736) is a potent small molecule inhibitor of the VEGF receptor (15). The anti-tumor activity of axitinib is accompanied by significant anti-angiogenic effects (16–19). However, axitinib typically exerts tumor cytostatic activity, which results in an encouraging but still limited efficacy in the monotherapy setting. The combination of axitinib with other treatment regimens, such as cytotoxic and anti-angiogenic metronomic chemotherapy, is an important objective. Furthermore, it is important to evaluate the impact of the anti-angiogenic actions of axitinib on the delivery of chemotherapeutic drugs included in the combination therapies. To address these issues, we presently investigate the effects of axitinib in combination with metronomic CPA in preclinical studies using 9L gliosarcoma, a highly vascularized tumor model.
MATERIALS and METHODS
Chemicals
Axitinib (15, 16) was supplied by Pfizer Global Research and Development San Diego, CA). Cyclophosphamide, NADPH, semicarbazide hydrochloride, crystal violet, and mouse monoclonal antibody to smooth muscle actin-α(A-5228) were purchased from Sigma-Aldrich Co. (St. Louis, MO). 4-hydroperoxycyclophosphamide (4-HC) was obtained from Dr. Ulf Niemeyer (Baxter Oncology GmbH, Frankfurt, Germany). Methanol (HPLC-grade) was purchased from J. T. Baker (Phillipsburg, NJ). 16% paraformaldehyde solution (methanol-free) was purchased from Electron Microscopy Sciences (Hatfield, PA). Polyethylene glycol 400 (PEG-400) and 1% alcoholic eosin Y were purchased from Fisher Scientific (Hampton, NH). Mouse monoclonal anti-PCNA antibody (2586) was purchased from Cell Signaling Technology (Danvers, MA). Rat monoclonal anti-CD31 antibody (557355) was purchased from BD Bioscience (Franklin Lakes, NJ). Normal rabbit serum, normal horse serum, avidin/biotin blocking kit, biotinylated rabbit anti-rat antibody (BA-4000), biotinylated horse anti-mouse antibody (BA-2000), VECTASTAIN Elite ABC Kit, peroxidase substrate VIP, VectaMout and Gill’s Hematoxylin were purchased from Vector Laboratories (Burlingame, CA). DeadEnd™ Colorimetric TUNEL kit and RNase-free DNase were purchased from Promega (Madison, WI). Hypoxyprobe-1 kit including pimonidazole was purchased from Chemicon (Temecula, CA). D-MEM culture medium, fetal bovine serum (FBS) and TRIzol were purchased from Invitrogen (Carlsbad, CA). EGM-2 BulletKit endothelial cell culture medium was purchased from Cambrex Bio Science (Walkersville, MD). High-Capacity cDNA Reverse Transcription Kit, RNase inhibitor, and SYBR Green PCR Master Mix were purchased from Applied Biosystems (Foster City, CA).
Cell Lines
Rat gliosarcoma cell lines 9L and 9L/2B11 were those described previously (14). Cells were grown in D-MEM culture medium with 10% FBS at 37°C in a humidified, 5% CO2 atmosphere. The 9L cell model was chosen based on its high vascularity (20, 21) and earlier studies where the therapeutic responses to metronomic CPA treatment have been extensively tested (13, 14). Human umbilical vein endothelial cells (HUVEC) were purchased from Cambrex Bio Science and were grown in EGM-2 BulletKit endothelial cell culture medium.
Tumor Growth Delay Experiments
Immunodeficient male Fox Chase ICR scid mice were purchased from Taconic (Germantown, NY) and housed in the Boston University Laboratory of Animal Care Facility in accordance with approved protocols and federal guidelines. Autoclaved cages containing food and water were changed once a week. Mouse body weight was monitored every 3–4 days. On the day of tumor cell inoculation, 9L tumor cells at 70–80% confluence were trypsinized and resuspended in FBS-free D-MEM medium. 4×10⁶ cells in a volume of 0.2 ml were injected s.c. into each flank of a 5-wk-old mouse (body weight 20–22 g; 2 tumors/mouse). Tumor sizes were measured every 3–4 days using digital calipers (VWR International, West Chester, PA) and volumes calculated as (3.14/6) × (L×W)3/2. Mice were randomized to different groups on the day of initial drug treatment when the average tumor volume reached ~500 mm3 (10–24 tumors/group, as specified, and average body weight, 28–30 g). Axitinib dissolved in 3 parts of PEG-400 and 7 parts of acidified water (pH 2–3) was administered to the tumor-bearing mice daily by i.p. injection at 25 mg/kg body weight. Initial experiments showed similar anti-tumor responses were induced by axitinib (25 mg/kg, i.p.) given either every 12 hr or once a day (Fig. S1; see Supplementary Materials, available on-line). Therefore, a once-a-day axitinib treatment schedule was used for all subsequent studies. Freshly prepared CPA dissolved in PBS (140 mM NaCl, 10 mM Na2HPO4, 2.7 mM KCl, 1.8 mM KH2PO4) was filtered through a 0.2 μm acrodisc syringe filter (Pall Corp. Ann Arbor, MI) and administered by i.p. injection at 140 mg CPA/kg body weight every 6 days. In the combination treatment studies, on those days when CPA and axitinib were both administered, CPA was injected 4 hr prior to axitinib to minimize the potential for drug interactions. This time interval was chosen based on the findings that 4 hr after i.p. injection of CPA, the concentration of its activated metabolite, 4-OH-CPA, has already decreased to background in blood, liver, and tumor (see Fig. 4B, below, and Table S1).
Figure 4. Impact of axitinib or axitinib/CPA combination on 9L tumor 4-OH-CPA exposure.
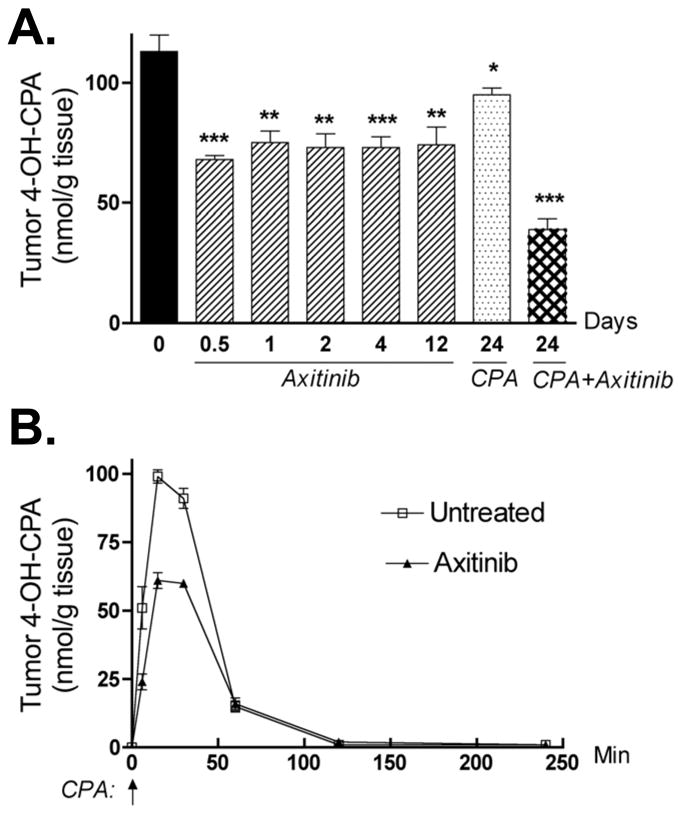
A. Levels of 4-OH-CPA in 9L tumors treated with axitinib (25 mg/kg, i.p. sid), metronomic CPA (140 mg/kg, i.p., every 6-d) or the combination for the indicated periods of time were measured 15 min after injection of a test dose of CPA, as described in Fig. 3. Intratumoral 4-OH-CPA uptake was decreased ~ 40% within 12 hr after the first axitinib injection and remained at that level through 12 daily axitinib treatments. Four cycles of the combination treatment decreased 4-OH-CPA uptake by 9L tumors >60%. * p < 0.05, ** p < 0.01, and *** p < 0.001 compared to day 0 controls, with n = 6 tumors/group. B. Levels of 4-OH-CPA in untreated or axitinib-pretreated (25 mg/kg, i.p., sid for 4 d) 9L tumors were measured 6 to 240 min after a single test dose of CPA (single i.p. injection at 140 mg/kg, indicated by the vertical arrow at 0 min). AUC values for tumor 4-OH-CPA exposure decreased from 4545 to 3251 nmol/g*min after 4 d of axitinib treatment (see Table S1), with n = 6 tumors/time point.
Immunohistochemical Staining, Tumor Microvessel Density and Proliferation Index
Pimonidazole hydrochloride (60 mg/kg body weight) was injected i.p. to scid mice bearing 9L tumors 60 min before the mice were killed by cervical dislocation. Tumor tissues were excised and snap frozen in dry ice-cold 2-methylbutane and stored at −80°C as described (21). Briefly, 1% paraformaldehyde-fixed tumor cryosections (6 μm) were detergent permeabilized then treated with 3% H2O2 for 5 min to block endogenous peroxidase. Sections were blocked with 2% normal serum then incubated with primary antibody (1 hr at 37°C followed by two PBS washes) and then secondary antibody (1 hr at room temperature then three PBS washes). The sections were incubated with ABC complex and then stained with the peroxidase substrate VIP. Following hematoxylin counterstaining, the slides were dehydrated and sealed with VectaMout. The final concentration (or dilution) of each primary antibody was as follows: anti-CD31 (0.3 μg/ml), HypoxyProbe-1 (1:50), anti-PCNA (1:1000), anti-smooth muscle actin-α (5 μg/ml). Biotinylated anti-rat or anti-mouse secondary antibodies were diluted to 7.5 μg/ml. Immunostained tumor sections were examined using an Olympus BX51 bright field light microscope. The number of CD31-positive blood vessels was counted at 400x magnification for a maximal number of non-overlapping fields covering each section. The number of blood vessels with pericyte coverage, i.e., vessels positive for smooth muscle actin-α immunostaining, was measured in the same way at 200x magnification. The number of PCNA-positive cells per field at 200x magnification was counted as an index of tumor cell proliferation. Microvessel density, pericyte-covered vessel density, and proliferation index data are presented as counts per field, mean ± SE, typically based on 20–60 fields for each of four individual tumors.
TUNEL Assay and Apoptotic Index
Axitinib-treated tumors were collected 24 hr after the last axitinib injection except for the 12 hr time point, where tumors were collected 12 hr after a single i.p. injection of axitinib. Tumors were collected 48 hr after the last CPA injection from mice treated with CPA or with the axitinib/CPA combination. TUNEL assay was performed according to the manufacturer’s protocol with modifications (21). TUNEL-positive cells were counted at 200x magnification for the maximal number of fields covering each section. The average number of apoptotic cells per field (i.e., apoptotic index) was calculated and expressed as mean ± SE for n = 4 individual tumors.
Impact of Axitinib on Tissue Uptake of 4-OH-CPA
The impact of axitinib on CPA metabolism to 4-OH-CPA and on 4-OH-CPA uptake by target tissues was determined as follows. A single i.p. injection of CPA (140 mg/kg body weight) was administered to untreated mice 24 hr after the last axitinib treatment, except in the case of the 12 hr time point, where CPA was given 12 hr after axitinib. Mice were killed 15 min after CPA injection, corresponding to the Tmax of 4-OH-CPA in plasma, liver and tumor (22). Blood samples were collected by cardiac puncture. Liver, tumor, kidney, and heart tissues were homogenized on ice in 0.1 M KPi buffer, pH 7.4 containing 5 mM semicarbazide hydrochloride to stabilize the 4-OH-CPA. After 30 min centrifugation at 130 g at 4 °C, 500 μl of supernatant (or 50 μl of plasma diluted in 450 μl of KPi buffer) were deproteinized by the sequential addition of 250 μl of 5.5% zinc sulfate and 250 μl of saturated barium hydroxide. Acrolein formed during chemical decomposition of 4-OH-CPA was derivatized to 7-hydroxyquinoline and analyzed by HPLC (23, 24). A standard curve for 4-OH-CPA was generated using 4-HC (0–40 μM) dissolved in KPi buffer and processed in parallel. 4-HC is a chemically activated derivative of CPA that spontaneously decomposes to 4-OH-CPA in aqueous solution. Integrated peak areas determined by Millennium software (Waters Corp., Mliford, MA) were converted to units of nmol of 4-OH-CPA produced per g of tissue. Tissue recovery of 4-OH-CPA was determined to be 60 ± 3% with a sensitivity of 1 μM under these conditions (24). Data were expressed as mean ± SE for n=6 tumors (3 mice) per data point.
Pharmacokinetic Analysis of 4-OH-CPA Metabolism and Distribution
Mice bearing 9L tumors were given a single i.p. injection of CPA (140 mg/kg) without any pretreatment, or were treated with axitinib (25 mg/kg, i.p., sid) for 4 days followed by CPA injection 24 hr later. Tissues were collected 6, 15, 30, 60, 120, or 240 min after CPA injection and levels of 4-OH-CPA were determined by HPLC as described above. WinNonlin software (Standard Edition, Version 1.5; noncompartmental and extravascular input setting) was used to calculate Area Under Curve (AUC), Cmax, Tmax and t1/2 values for 4-OH-CPA in plasma, tumor, liver, kidney and heart. Data were expressed as mean ± SE based on n=3 individual mice or n=6 individual tumors per time point.
Cell Growth Inhibition Assay
Axitinib stock solution (10 mM in DMSO) was stored at −20°C. 9L or HUVEC cells were seeded in triplicate wells of a 24-well plate and grown overnight followed by addition of axitinib at concentrations ranging from 1 nM to 10 μM. The cells were cultured for 4 d in the presence of axitinib, washed twice with PBS on ice and then quantified by crystal violet staining at 595nm (25). The staining intensity of drug-treated samples was calculated as a percentage of untreated controls. The impact of axitinib on tumor cell sensitivity to 4-OH-CPA was determined using 4-HC. 9L tumor cells were treated with one of the following schedules: 1) DMSO control for 2 d followed by 4-HC treatment for 4 d; 2) 2 d of DMSO control followed by 4-HC + axitinib for 4 d; or 3) axitinib for 2 d following by 4-HC + axitinib for 4 d. For both axitinib and 4-HC treatments, drug exposure was limited to 4 hr/day, to mimic the pharmacokinetic profiles of 4-OH-CPA and axitinib exposure in vivo, following which the cells were incubated in fresh drug-free culture medium. Twenty four hr after the last treatment, the remaining cells were washed twice with PBS, stained and quantified by crystal violet staining. IC50 values were calculated using Sigmoidal concentration-response analysis with a variable slope as implemented in Prism software (GraphPad, San Diego, CA).
Real-time PCR
TSP-1 RNA was quantified by quantitative, real-time PCR using SYBR Green I chemistry. Tumor samples were collected 24 hr after last drug treatment, snap frozen in liquid nitrogen and stored at −80°C. Total RNA isolation from frozen tumor samples (0.1–0.4 g) using TRIzol reagent, reverse transcription and PCR were carried out as described (21). CT values determined for each mRNA were normalized to the 18S rRNA content.
Statistical Analysis
Results were expressed as mean ± SE and are based on the indicated number of tumors or tissue samples per group. Statistical significance of differences was assessed by two-tailed Student’s t test, using Prism software with statistical significance indicated by * p < 0.05, ** p < 0.01, and *** p < 0.001. All time points were compared to day 0 unless specified otherwise.
RESULTS
Axitinib induces anti-angiogenic responses and delays 9L tumor growth
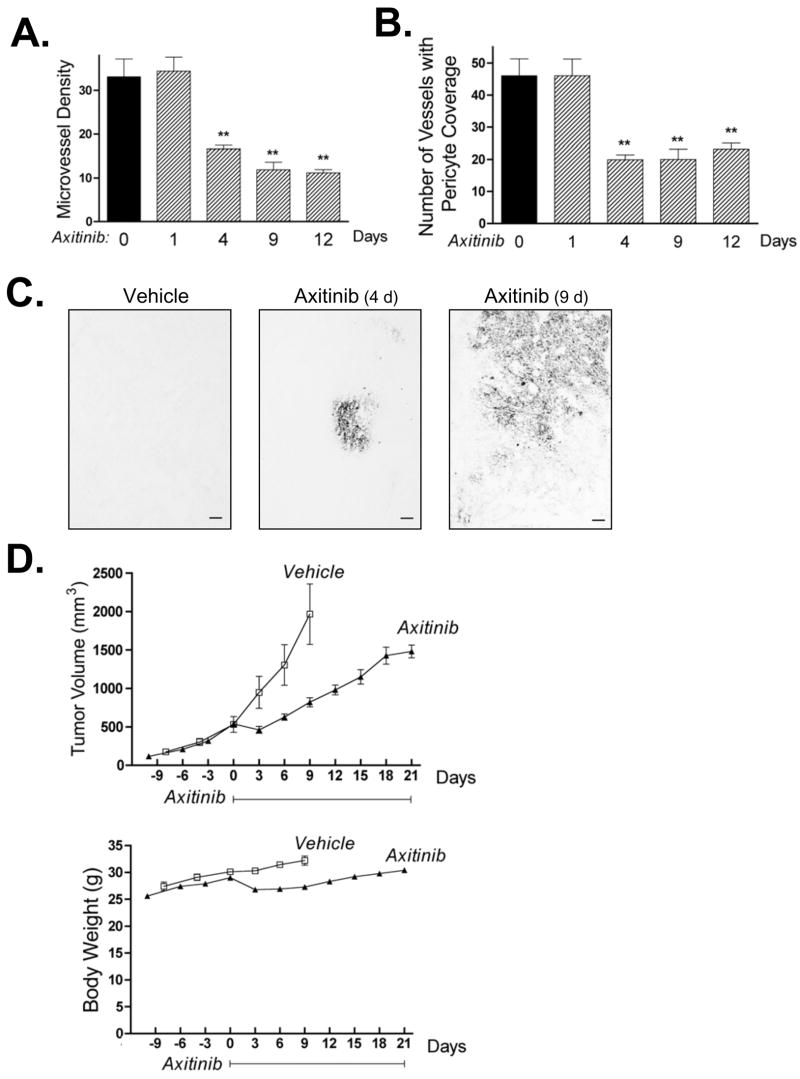
When used as a monotherapy, daily axitinib treatment induced a strong anti-angiogenic response in 9L tumors within 4 d, as demonstrated by a significant decrease in tumor vascular density (Fig. 1A) and by a decline in the number of blood vessels with pericyte coverage (Fig. 1B). Axitinib also increased tumor hypoxia (Fig. 1C). 9L tumor growth was initially inhibited by axitinib treatment (days 0 to 3; Fig. 1D, top) at which time there was a small but transient decrease in mouse body weight (Fig. 1D, bottom). Tumor growth subsequently resumed, albeit at a rate slower than in the vehicle-treated control tumors. Axitinib thus has a limited anti-tumor effect in the 9L gliosarcoma model. This anti-tumor activity was not enhanced by increasing the frequency of axitinib treatment to twice daily (Fig. S1; see Supplementary Materials).
Figure 1. Anti-angiogenic activity and tumor growth delay of axitinib monotherapy in rat 9L gliosarcoma.
9L tumors grown s.c. in scid mice were treated with axitinib for up to 21 days at 25 mg/kg, i.p., sid, as specified in each panel. A. Number of tumor blood vessels per CD31-immunostained 9L tumor section counted at 400x magnification. Axitinib significantly reduced microvessel density after 4–12 days of treatment. B. Impact of axitinib treatment on the number of 9L tumor blood vessels with pericyte coverage, identified as SMA-α-positive blood vessels at 200x magnification. Days of axitinib treatment are indicated along the x-axis, with n = 4 tumors/group and ** p < 0.01 compared to day 0 controls (panels A and B). C. Immunostaining for hypoxia-specific dye pimonidazole revealed an increase in tumor hypoxia after 4 and 9 days of axitinib treatment. Scale bar at bottom right, 100 μm. D. Axitinib treatment initiated on day 0 delayed 9L tumor growth (upper panel, n = 10 tumors/group) with minimal effect on the rate of mouse body weight gain (lower panel). Solid line along x-axis indicates the time period of daily axitinib treatment.
Axitinib/metronomic CPA combination therapy is 9L tumor growth static
Co-administration of axitinib with metronomic CPA blocked 9L tumor growth soon after the initiation of drug treatment (Fig. 2A). By contrast, metronomic CPA given as a monotherapy required 2–3 treatment cycles to achieve tumor growth inhibition. However, whereas metronomic CPA regressed 9L tumors, the combination of axitinib with metronomic CPA induced tumor growth stasis, but not tumor regression. This tumor stasis was sustained for a prolonged period, with limited regression ultimately observed in mice where daily axitinib treatment was continued through day 24 and metronomic CPA treatment continued till day 48 (Fig. 2A). Similar responses were observed with 9L tumors that express P450 2B11 (9L/2B11 tumors) (Fig. 2B), which activate CPA to 4-OH-CPA intratumorally (22) and display increased and more complete tumor regression following metronomic CPA treatment (14). Moreover, whereas metronomic CPA significantly decreased 9L tumor cell density after 5 treatment cycles, as revealed by hematoxylin-eosin staining, this effect was not observed with the axitinib/CPA combination (Fig. 2C). A small but tolerable body weight loss was associated with the combination therapy (Fig. S2). Axitinib monotherapy and the axitinib/metronomic CPA combination both showed enhanced anti-angiogenic responses (Fig. 2D, 2E) associated with increased tumor hypoxia (Fig. 2F) when compared to metronomic CPA treatment alone.
Figure 2. Axitinib/metronomic CPA combination blocks 9L tumor growth but does not induce tumor regression.
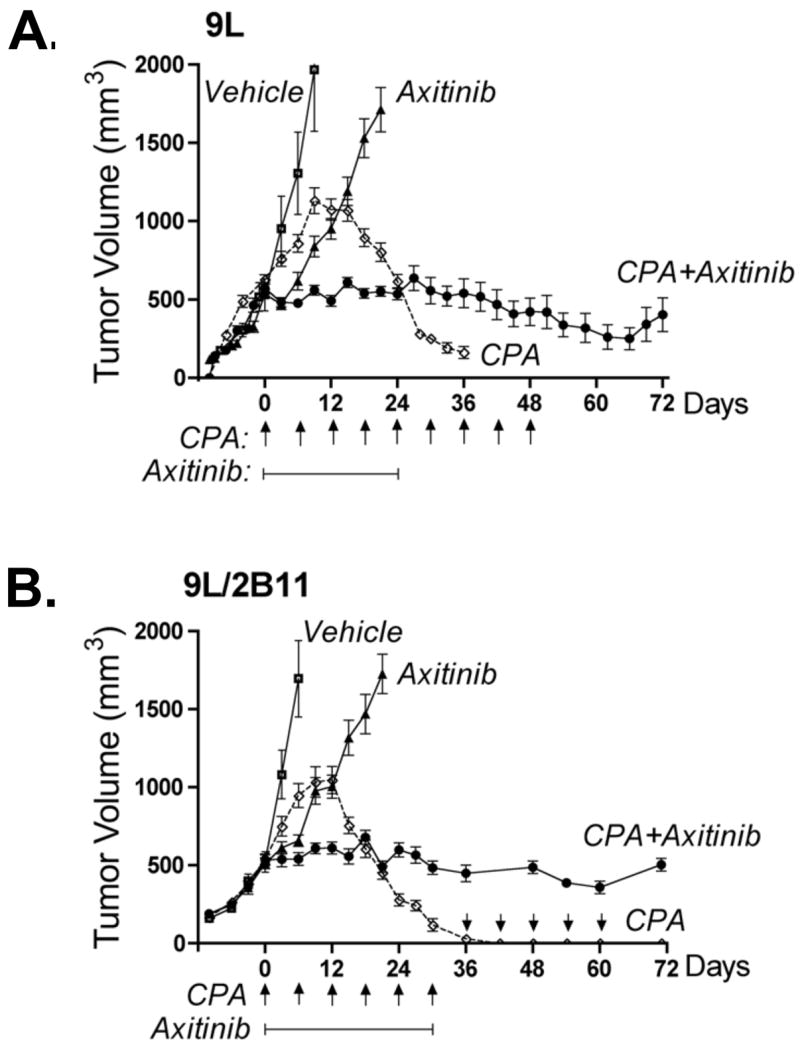
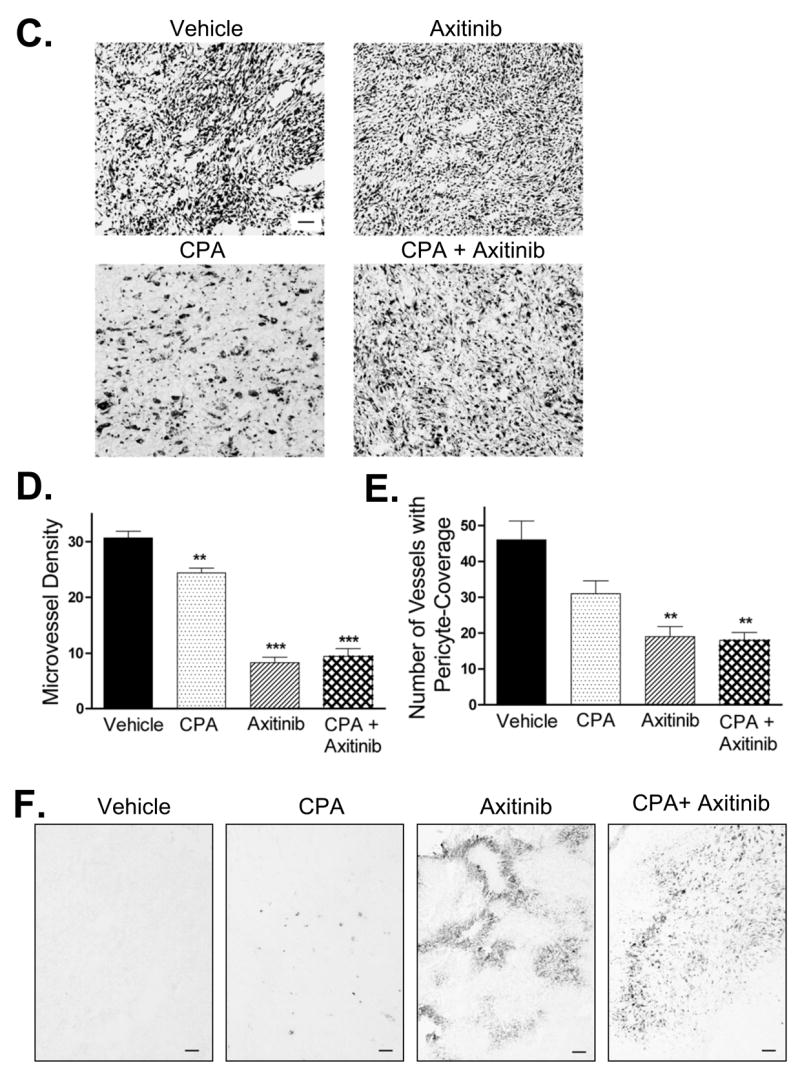
A. and B. 9L tumors (panel A) or 9L/2B11 tumors, which can activate CPA intratumorally (panel B), were implanted s.c. in scid mice, grown to an average vol of 500 mm3 and then treated with the axitinib/metronomic CPA combination (see Materials and Methods). CPA-induced tumor regression (most complete for 9L/2B11 tumors) was absent in the combination treatment group, which displayed sustained tumor growth stasis, continuing even after termination of drug treatment. Arrows along the x-axis indicate days of CPA treatment (140 mg/kg, i.p., every 6-d) while solid line below the arrows indicates the time period of axitinib treatment (25 mg/kg, i.p., sid). On the days when both drugs were co-administered, CPA was given 4 hr prior to axitinib to minimize drug-drug interactions. For 9L tumors (A), n = 20 to 24 tumors/group through day 24, after which 6 tumors were left for longer-term monitoring while the other tumor samples were collected for analysis. In case of 9L/2B11 tumors (panel C), n = 10 tumors/group through day 30, after which both drug treatments were terminated for the CPA + axitinib combination group and 3 mice (6 tumors) were removed for tissue analysis; the remaining 4 tumors were monitored till day 72. For the CPA-treated 9L/2B11 tumors, CPA administration on an every 6-day schedule was continued for the 4 remaining tumors from day 30 through day 60 (arrows above x-axis) and tumor measurements continued till day 72. C. 9L tumor cryosections prepared from mice receiving the indicated treatments were stained with hematoxylin-eosin. Similar tumor cell morphologies and cell densities were observed in tumors from mice treated with vehicle, axitinib (25 mg/kg, i.p., sid, 21 days), or the combination therapy (26 days). In contrast, metronomic CPA (140 mg/kg, i.p., every 6-d for 26 days) induced changes in both cell morphology and density. Scale bar at bottom right of vehicle-treated tumors panel applies to all four graphs, 50 μm. D. Microvessel density of CD31-immunostained 9L tumor cryosections measured at 400x magnification. E. Number of blood vessels with SMA-α-positive pericyte coverage counted at 200x magnification. F. Anti-angiogenic activity of the axitinib/CPA combination was manifest by increased tumor hypoxia as detected by pimonidazole staining. Scale bar, 100 μm. Drug treatments for panels D, E and F were the same as described in panel C. Panels D and E, n =4 tumors/group, **, p<0.01 and ***, p<0.001 compared to vehicle controls.
Axitinib does not affect hepatic CPA activation or 4-OH-CPA export to plasma
Next, we investigated why 9L tumor regression induced by metronomic CPA was blocked by the axitinib/CPA combination, which fully retained the strong anti-angiogenic effects associated with axitinib alone. First, we determined that axitinib does not alter hepatic cytochrome P450-catalyzed CPA activation, as shown by analysis of liver microsomal CPA 4-hydroxylase activity, determined at two CPA concentrations (Fig. 3A). Moreover, HPLC analysis of 4-OH-CPA concentrations in liver and plasma 15 min after a single i.p. injection of CPA indicated no major effect of prior treatment with axitinib, CPA, or the combination on the export of 4-OH-CPA from liver to systemic circulation (Fig. 3B, 3C, and Fig. S3).
Figure 3. Impact of axitinib treatment on hepatic activation of CPA and export of its active metabolite, 4-OH-CPA.
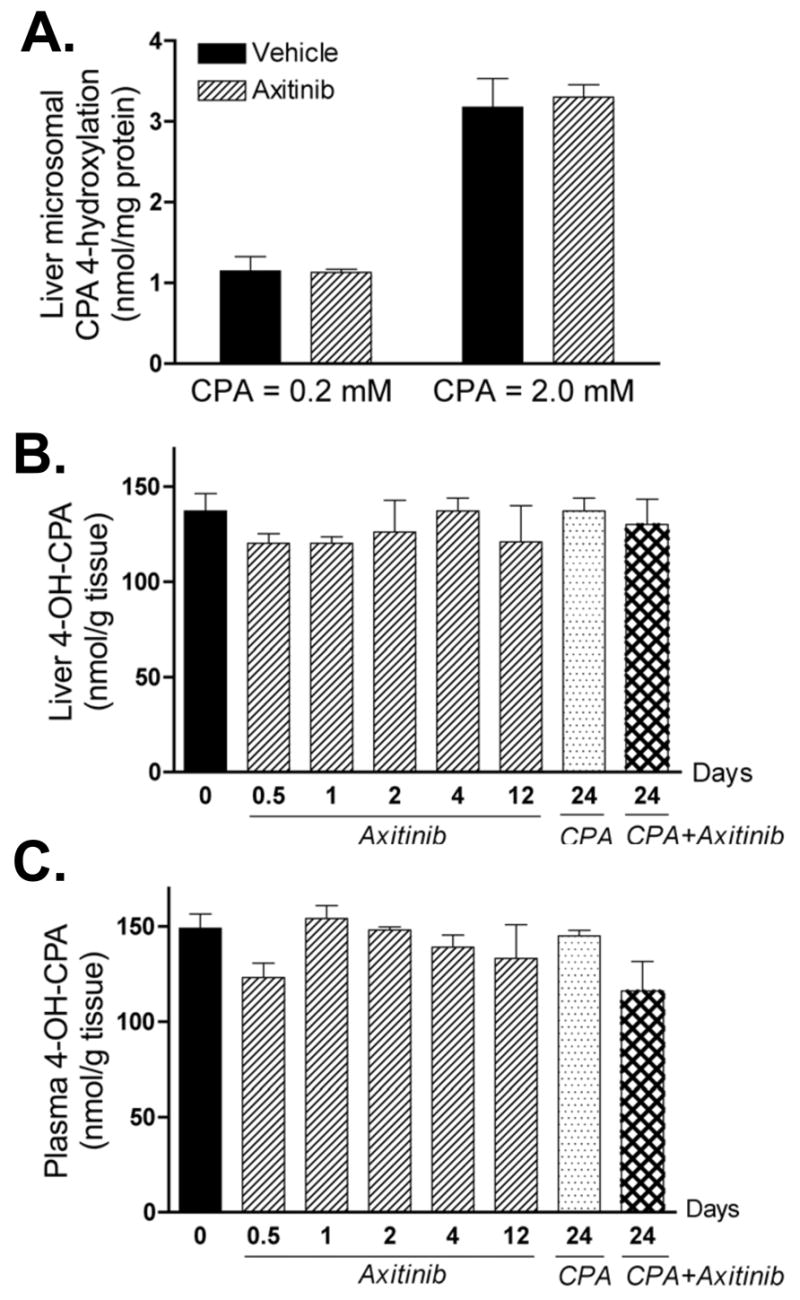
A. Mice bearing 9L tumors were treated with vehicle or axitinib (25 mg/kg, i.p. sid) for 4 days. 24 hr after the last drug injection, liver microsomes were isolated (21) and CPA 4-hydroxylase activity was assayed by HPLC (23) following in vitro incubation with 0.2 or 2 mM of CPA. Data shown are mean ± SE based on n = 3 livers/group. The levels of 4-OH-CPA in liver (B) and plasma (C) were measured by HPLC 15 min after injection of a single test dose of CPA (140 mg/kg, i.p.). The 15 min time point corresponds to the Tmax (4-OH-CPA) (see Fig. 4B, below). None of the values shown is significantly different than the day 0 (untreated) controls (n = 3 mice/group, p > 0.05 for all treatments compared to controls). Numbers along the x-axis indicate the time period of drug treatment, as described in Fig. 2.
Axitinib significantly reduces the exposure of 9L tumors to 4-OH-CPA
The impact of the axitinib-induced decrease in 9L tumor vascular density on tumor uptake of 4-OH-CPA was determined by assaying intratumoral 4-OH-CPA concentrations 15 min after i.p. injection of CPA. 12 hr after the first axitinib treatment, tumor uptake of 4-OH-CPA was decreased by ~40%, with no further change apparent after 12 daily axitinib treatments (Fig. 4A). Moreover, whereas 9L tumor 4-OH-CPA levels decreased by only 16% after four metronomic CPA treatment cycles (i.e., 24 days), the axitinib/metronomic CPA combination reduced intratumoral 4-OH-CPA levels > 60% (Fig. 4A). In contrast, the axitinib/CPA combination did not affect 4-OH-CPA uptake by kidney and heart (Fig. S3). A more detailed pharmacokinetic analysis verified that 4 days of axitinib pre-treatment decreased net tumor exposure to 4-OH-CPA, as judged by a 30% decrease in AUC values and a 36% decrease in Cmax (p<0.0001) (Fig. 4B and Table S1). The AUC (4-OH-CPA) was unchanged in plasma, liver, heart and kidney (Table S1), demonstrating that axitinib selectively decreases tumor exposure to 4-OH-CPA, which likely contributes to the absence of tumor regression with the combination treatment.
Axitinib has limited direct effect on 9L tumor cells
In addition to an anti-angiogenic mechanism, the possibility of direct targeting of tumor cells by axitinib was investigated. In cell culture, axitinib inhibited 9L cell growth at concentrations moderately higher than those required for inhibition of HUVEC cells (Fig. 5A). Moreover, axitinib induced significant morphological changes in the cultured 9L cells, as indicated by the appearance of multiple nuclei and an enlarged cell size (Fig. 5B). Careful examination of hematoxylin-eosin stained tumor sections did not reveal such morphological changes in axitinib-treated 9L tumors (c.f., Fig. 2C), indicating that the axitinib treatment regimen has limited effect on tumor cell morphology in vivo. However, TUNEL labeling revealed an early increase in apoptotic cells in axitinib-treated 9L tumors (Fig. 5C), which may contribute to the initial growth inhibition that accompanied axitinib treatment. These TUNEL-positive cells are primarily composed of 9L tumor cells, insofar as the overall number of apoptotic endothelial cells was very low and was not significantly increased by axitinib treatment (Fig. S4). The apoptotic effect of axitinib on 9L tumor cells was no longer apparent after 4 daily axitinib treatments. 48 hr after the 5th CPA treatment cycle (i.e., on day 26), the number of 9L tumor apoptotic cells was increased in the CPA alone group but not with the axitinib/CPA combination (Fig. 5C). Axitinib had little or no effect on the intrinsic chemosensitivity of cultured 9L cells to activated CPA, added in the form of 4-HC (Table S2). Thus, reduced tumor penetration of 4-OH-CPA rather than a decrease in intrinsic chemosensitivity accounts for the decrease in CPA-induced apoptosis in the axitinib/CPA-treated tumors. Analysis of the 9L tumor cell proliferation profile by PCNA staining revealed a steady decrease of proliferating cells in the first 12 d of axitinib treatment, with a recovery to the untreated level by day 21 (Fig. 5D). An even lower 9L tumor cell proliferation index was seen after treatment with metronomic CPA or the axitinib/CPA combination (Fig. 5D, last two bars), and this may contribute to the tumor regression and growth stasis effects, respectively, induced by these treatments.
Figure 5. Direct effects of axitinib on 9L tumor cells.
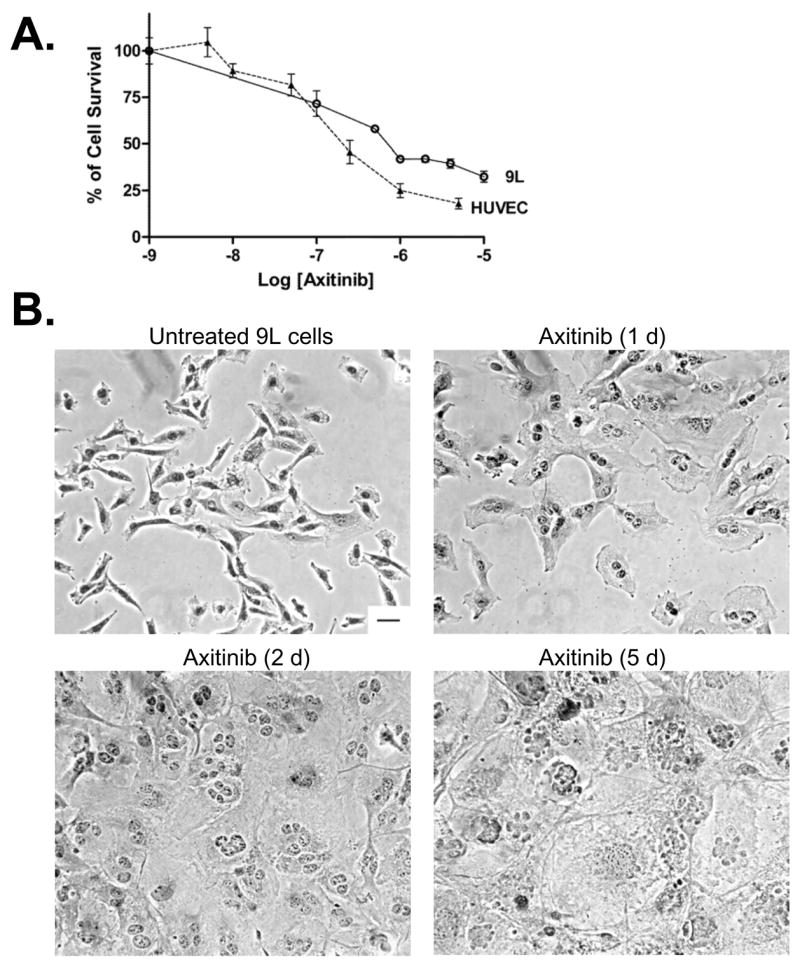
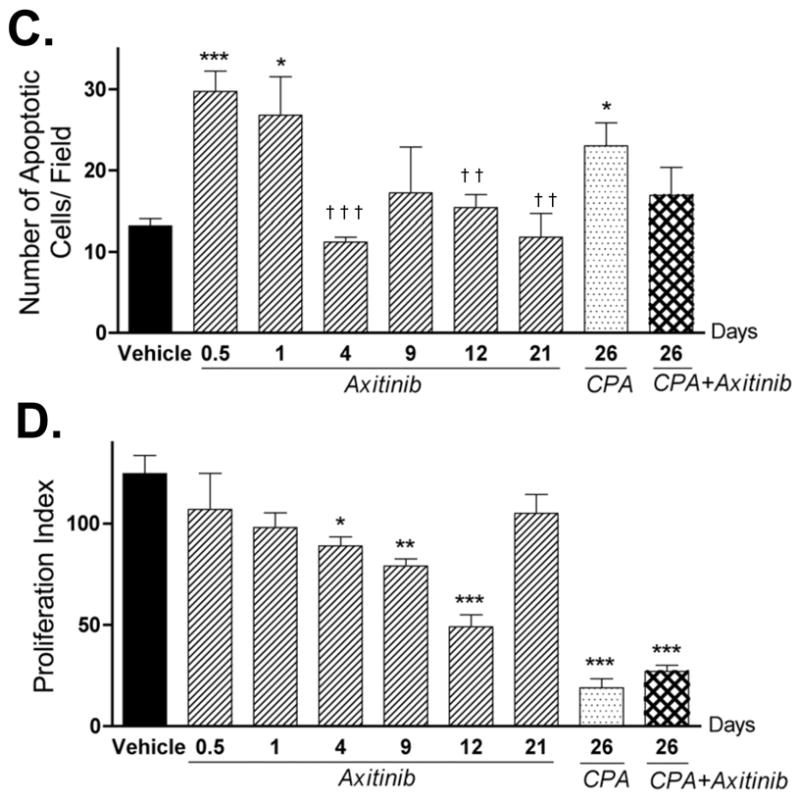
A. Cultured 9L tumor cells and HUVEC cells were treated with axitinib at the indicated concentrations for 4 d and the impact on final cell number, indicative of relative growth rate, was determined by crystal violet staining (n = 3 replicates/data point). B. Morphology of hematoxylin-eosin stained 9L cells treated with axitinib (500 nM) for up to 5 d in culture. Scale bar at bottom right of untreated cells panel applies to all graphs, 50 μm. The impact of the indicated in vivo drug treatments on tumor cell apoptosis (C) and proliferation (D) was analyzed by TUNEL assay and PCNA immunostaining, respectively. The number of staining-positive cells was counted at 200x magnification. Numbers along the x-axis indicate the time period of drug treatment. * p < 0.05, ** p < 0.01, and *** p < 0.001 compared to day 0 controls, while † p < 0.05, †† p < 0.01, and ††† p < 0.001 compared to the response at 12 hr (day 0.5), n = 4 tumors/group.
Metronomic CPA-induced mouse TSP-1 expression is blocked in the combination therapy
Metronomic CPA treatment of 9L tumors induces the expression of TSP-1, an endogenous angiogenesis inhibitor (21). This increase in host (mouse) TSP-1 was confirmed in the present study (Fig. 6). Moreover, although mouse TSP-1 expression was not affected by axitinib, the axitinib/CPA combination completely blocked the increase in TSP-1 induced by metronomic CPA. Given the essential role of TSP-1 for the anti-tumor action of metronomic CPA (26), this block in TSP-1 induction may contribute to the inability of the combination therapy to regress 9L tumors. The expression of 9L tumor (i.e., rat) TSP-1 was not affected by any of the treatments, and limited changes (< 2 fold) in total (mouse + rat) TSP-1 RNA were observed in the axitinib- and the combination therapy-treated 9L tumors (data not shown).
Figure 6. Expression of mouse TSP-1 RNA after multiple drug treatments.
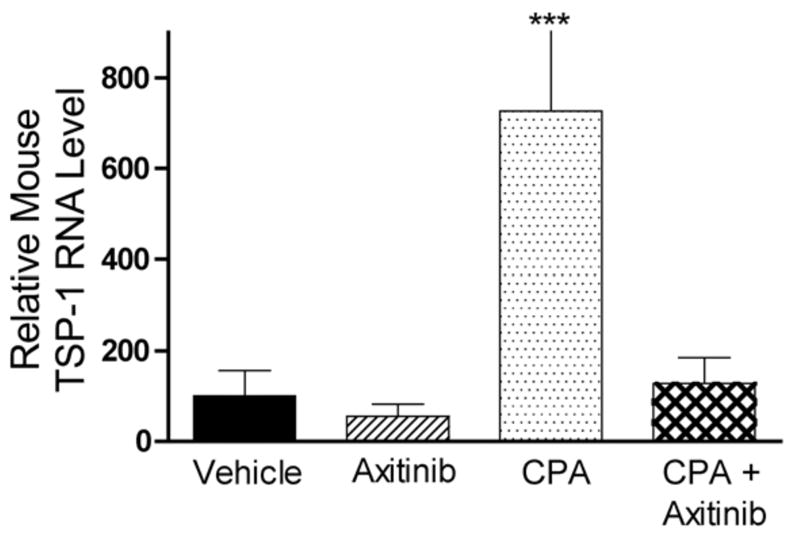
The level of host (mouse) TSP-1 RNA in 9L tumor was measured by real-time PCR following treatment with axitinib (25 mg/kg, i.p., sid for 21 d), metronomic CPA (140 mg/kg, i.p., every 6-d for 26 d) or the combination (26 d). Metronomic CPA induced a 7-fold increase in mouse TSP-1 expression, which was absent in axitinib or the combination therapy-treated tumors. Data are expressed as relative RNA levels, mean ± SE for n = 4–8 individual tumors/group.
DISCUSSION
Axitinib is a potent small molecule receptor tyrosine kinase inhibitor that induces significant anti-angiogenic responses, including rapid loss of tumor vascular potency with a decrease in tumor blood volume, followed by a gradual decrease in microvessel density and > 90% loss of endothelial fenestration of the tumor vasculature (16, 17). These strong anti-angiogenic responses contribute to axitinib’s anti-tumor activity but also raise questions as to how they will affect the pharmacokinetics and pharmacodynamics of more traditional cancer chemotherapeutics in a combination therapy setting. In the present study, we used rat 9L gliosarcoma, a highly vascularized tumor model (20, 21), to study the combination of daily axitinib administration with CPA given on an every 6-d repeating, metronomic treatment schedule (11, 13). We found that the combination therapy induced sustained tumor growth stasis upon initiation of drug treatment. However, the strong anti-angiogenic effect of this drug combination substantially decreased intratumoral levels of 4-OH-CPA, the liver cytochrome P450-activated metabolite of CPA, decreasing the efficacy of the combination therapy. In addition, metronomic CPA induction of the host (mouse) anti-angiogenic factor TSP-1 was blocked by axitinib, which may help explain why axitinib converts the strong tumor regression response effected by metronomic CPA alone to a tumor growth stasis response. Thus, axitinib can modulate the anti-tumor activity of CPA, and potentially other chemotherapeutic drugs, in multiple and complex ways. Further studies will be required to ascertain whether optimization of the dosing and timing of anti-angiogenic agents such as axitinib can enhance their therapeutic effectiveness while circumventing the undesirable drug interactions described here.
Previous efforts to optimize combinations of angiogenesis inhibitors with traditional radiation or chemotherapy have met with varying degrees of success (27–31). Mechanisms proposed to explain how tumor-starving drugs may improve the efficacy of co-administered chemothrapeutic agents include the normalization of tumor vasculature, inhibition of repair of chemotherapy-induced damage, and stimulation of an anti-tumor immune response (4, 6, 32). However, the therapeutic benefits of combining angiogenesis inhibitors with radiation or chemotherapy are not universal (5). In the present study, the combination of axitinib with metronomic CPA fully blocked 9L tumor growth upon initiation of treatment, a response, which in the absence of axitinib, requires several cycles of metronomic CPA treatment. An unanticipated finding, however, was that axitinib blocked metronomic CPA-induced tumor regression, despite the strong anti-angiogenic activity of the axitinib/CPA combination. Investigation of the impact of axitinib on CPA metabolism revealed no effect on the activation of CPA to 4-OH-CPA in the liver or on the export of 4-OH-CPA to plasma or its uptake by heart and kidney. This latter finding is consistent with the report that axitinib does not affect vascular densities in heart and kidney (33). In contrast, intratumoral 4-OH-CPA levels were decreased by ~40% within 12 hr of a single axitinib injection, reducing the exposure of 9L tumors to 4-OH-CPA significantly, as demonstrated by a 30% decrease in AUC and a 36% decline in Cmax. This decrease in tumor cell exposure to 4-OH-CPA in the combination therapy setting is supported by the reduced apoptotic index in 9L tumors on day 26 of the axitinib/CPA treatment, and by the greater similarities in tumor cell morphology and tumor cell density of the combination therapy samples to vehicle-treated tumors than to tumors treated with metronomic CPA alone. Of note, the decreases in tumor uptake of 4-OH-CPA preceded changes in tumor vascular density and were not accompanied by increased apoptosis of tumor-associated endothelial cells. They are thus likely to result from functional changes to the tumor vasculature, such as a decrease in vascular potency and/or a reduction in tumor blood volume, which have been observed in other tumor models within one day of axitinib treatment (16, 17, 34).
9L tumor vascular density was progressively reduced over a 12-day period of axitinib treatment, whereas the capacity of 9L tumors to take up 4-OH-CPA was decreased ~ 40% within 12 hr, with no further changes seen over the next 12 days. This suggests that the longer-term exposure to axitinib increases the efficiency of blood flow and 4-OH-CPA transport in the remaining tumor blood vessels. Increases in transport efficiency per surviving vessel have been reported for the delivery of IgG protein and 50 nm microspheres to axitinib-treated tumors (35). Axitinib also induces multiple morphological changes, including an increase in the uniformity of tumor blood vessel diameter, a decrease in blood vessel tortuosity and in the number of leaky vessels, and a closer association between pericytes and endothelial cells (16). However, in order to maintain or even improve drug delivery, normalization of tumor vasculature by anti-angiogenic drug treatment requires that there be a sufficient number of surviving blood vessels that retain potency. In the current study, any normalization effect of axitinib on 9L tumor vasculature is counter balanced by a more dramatic decrease in vascular density and/or a drop in potency. The net result is a decrease in drug penetration and an increase in tumor hypoxia. After 24 d of the combined axitinib/CPA treatment, intratumoral 4-OH-CPA levels were further decreased, which may contribute to the inability of the combination therapy to induce tumor regression.
Several other anti-angiogenic agents have a direct impact on the delivery of chemotherapeutic drugs to tumors. For example, TNP-470 reduced intratumoral levels of temozolomide (36), whereas intratumoral levels of 4-OH-CPA were increased when CPA was administered during the transient blood vessel normalization window induced by thalidomide treatment (37). Blocking of VEGF receptor signaling by specific antibody induces a transient increase in drug uptake in several tumor models (38–40), but the ability of small molecule receptor tyrosine kinase inhibitors to enhance drug uptake are largely unknown. The concurrent inhibition of VEGF, PDGF and potentially other tyrosine kinase receptor signaling pathways by such agents may enhance anti-angiogenic responses, but may also have a substantial negative impact on chemotherapeutic drug delivery, as demonstrated here in the case of axitinib. Conceivably, improved delivery of anti-caner drugs, and improved chemosensitization, may be achieved by lowering the dose of the anti-angiogenic agent. For many anti-angiogenic drugs, treatment dosages are typically optimized in a monotherapy setting and then employed in subsequent combination therapy regimens. However, the optimal dose for an anti-angiogenic drug used as a chemosensitizing agent in combination chemotherapy may be different from the dose that maximally inhibits tumor angiogenesis. Improvements may be realized through careful dose-response studies in the combination setting, as well as from an appropriate sequencing of angiogenesis inhibitors with cytotoxic drugs, as proposed by Hanahan and colleagues (27).
As a monotherapy, axitinib delayed the growth of 9L tumors in association with its substantial anti-angiogenic effects, which included a decrease in vascular density and an increase in tumor hypoxia. The transient growth inhibitory effect of axitinib was accompanied by a transient increase in apoptosis, seen within 12–24 hr of a single axitinib treatment, suggesting that tumor cells or non-endothelial stromal cells may be direct targets of axitinib. The mechanisms for this cytotoxic effect and for the transient nature of this response are not known. In cell culture, axitinib inhibited 9L tumor cell growth and induced substantial morphological changes (Fig. 5B). However, while axitinib initially increased non-endothelial cell apoptosis in vivo, the level of apoptosis returned to pre-treatment levels in subsequent cycles of drug treatment, and the morphology of axitinib-treated 9L tumor cells was similar to that seen in untreated tumors. A progressive decline in cell proliferation induced by axitinib treatment, which could be a secondary response to angiogenesis inhibition, was also reversed by day 21, and was accompanied by continued tumor growth. These observations suggest that the axitinib treatment regimen employed here did not have a sustained direct impact on 9L tumor cells, which could indicate the development of resistance to axitinib, e.g., by inhibition of tumor blood perfusion, which might limit the delivery of axitinib itself.
The anti-angiogenic and anti-tumor effects of metronomic CPA require the endogenous angiogenesis inhibitor TSP-1 (10, 26). In the 9L tumor model, TSP-1 RNA is induced by metronomic CPA in host (mouse) cells (21), where TSP-1 protein was primarily localized to perivascular cells, although the number of TSP-1-positive blood vessels was low (Fig. S5). Interestingly, although basal TSP-1 levels were not affected by axitinib alone, the induction of host TSP-1 by metronomic CPA was blocked by axitinib. Given the requirement of TSP-1 for the anti-tumor effect of metronomic CPA noted above, the block in TSP-1 induction may be another important factor in limiting the effect of axitinib/CPA to tumor growth stasis, despite the strong anti-angiogenic activity of the drug combination. Further studies will be required to test this hypothesis and to ascertain the mechanism whereby axitinib blocks the induction of TSP-1 in tumor-associated host cells. One possible mechanism is that this is a secondary effect of reduction of 4-OH-CPA levels in the tumors. Further studies with other tumors are also needed to ascertain whether this observation applies to other tumor models as well.
In summary, the angiogenesis inhibitor axitinib is shown to modulate the anti-tumor activity of metronomic CPA in multiple ways. A transient pro-apoptotic activity of axitinib is associated with a rapid decrease of blood vessel perfusion and may lead to the immediate halt of tumor growth that characterizes the combination therapy. However, the decreased delivery of 4-OH-CPA into the tumor and a block in the induction of tumor-associated host TSP-1 by metronomic CPA limits the activity of the combination to tumor growth stasis rather than tumor regression. Thus, the balance between decreasing tumor microvessel density and improving drug uptake by a normalized tumor vasculature needs to be carefully considered as doses and schedules for axitinib and other anti-angiogenic drugs are developed for use in a combination chemotherapy setting.
Supplementary Material
Acknowledgments
This study was supported in part by NIH grant CA49248 (to D.J.W.). We thank Pfizer Global Research and Development for providing axitinib, Dr. Dana Hu-Lowe (Pfizer Global Research and Development) for useful discussions, Chong-Sheng Chen for HPLC analysis and Selen Karaca for assistance with immunohistochemistry.
Abbreviations
- AUC
area under curve
- axitinib
AG-013736
- CPA
cyclophosphamide
- FBS
fetal bovine serum
- HUVEC
human umbilical vein endothelial cells
- 4-HC
4-hydroperoxycyclophosphamide
- 4-OH-CPA
4-hydroxycyclophosphamide
- MTD
maximum tolerated dose
- PBS
phosphate-buffered saline
- PCNA
proliferating cell nuclear antigen
- TSP-1
thrombospondin-1
- VEGF
vascular endothelial growth factor
References
- 1.Jain RK, Duda DG, Clark JW, Loeffler JS. Lessons from phase III clinical trials on anti-VEGF therapy for cancer. Nat Clin Pract Oncol. 2006;3(1):24–40. doi: 10.1038/ncponc0403. [DOI] [PubMed] [Google Scholar]
- 2.Ferrara N, Kerbel RS. Angiogenesis as a therapeutic target. Nature. 2005;438(7070):967–74. doi: 10.1038/nature04483. [DOI] [PubMed] [Google Scholar]
- 3.Ellis LM. Mechanisms of action of bevacizumab as a component of therapy for metastatic colorectal cancer. Semin Oncol. 2006;33(5 Suppl 10):S1–7. doi: 10.1053/j.seminoncol.2006.08.002. [DOI] [PubMed] [Google Scholar]
- 4.Kerbel RS. Antiangiogenic therapy: a universal chemosensitization strategy for cancer? Science. 2006;312(5777):1171–5. doi: 10.1126/science.1125950. [DOI] [PubMed] [Google Scholar]
- 5.Nieder C, Wiedenmann N, Andratschke N, Molls M. Current status of angiogenesis inhibitors combined with radiation therapy. Cancer Treat Rev. 2006;32(5):348–64. doi: 10.1016/j.ctrv.2006.03.006. [DOI] [PubMed] [Google Scholar]
- 6.Jain RK. Normalization of tumor vasculature: an emerging concept in antiangiogenic therapy. Science. 2005;307(5706):58–62. doi: 10.1126/science.1104819. [DOI] [PubMed] [Google Scholar]
- 7.Kerbel RS, Kamen BA. The anti-angiogenic basis of metronomic chemotherapy. Nat Rev Cancer. 2004;4(6):423–36. doi: 10.1038/nrc1369. [DOI] [PubMed] [Google Scholar]
- 8.Hanahan D, Bergers G, Bergsland E. Less is more, regularly: metronomic dosing of cytotoxic drugs can target tumor angiogenesis in mice. The Journal of clinical investigation. 2000;105(8):1045–7. doi: 10.1172/JCI9872. [DOI] [PMC free article] [PubMed] [Google Scholar]
- 9.Bocci G, Nicolaou KC, Kerbel RS. Protracted low-dose effects on human endothelial cell proliferation and survival in vitro reveal a selective antiangiogenic window for various chemotherapeutic drugs. Cancer Res. 2002;62(23):6938–43. [PubMed] [Google Scholar]
- 10.Bocci G, Francia G, Man S, Lawler J, Kerbel RS. Thrombospondin 1, a mediator of the antiangiogenic effects of low-dose metronomic chemotherapy. Proc Natl Acad Sci U S A. 2003;100(22):12917–22. doi: 10.1073/pnas.2135406100. [DOI] [PMC free article] [PubMed] [Google Scholar]
- 11.Browder T, Butterfield CE, Kraling BM, et al. Antiangiogenic scheduling of chemotherapy improves efficacy against experimental drug-resistant cancer. Cancer Res. 2000;60(7):1878–86. [PubMed] [Google Scholar]
- 12.Man S, Bocci G, Francia G, et al. Antitumor effects in mice of low-dose (metronomic) cyclophosphamide administered continuously through the drinking water. Cancer Res. 2002;62(10):2731–5. [PubMed] [Google Scholar]
- 13.Jounaidi Y, Waxman DJ. Frequent, moderate-dose cyclophosphamide administration improves the efficacy of cytochrome P-450/cytochrome P-450 reductase-based cancer gene therapy. Cancer Res. 2001;61(11):4437–44. [PubMed] [Google Scholar]
- 14.Jounaidi Y, Chen C-S, Veal GJ, Waxman DJ. Enhanced antitumor activity of P450 prodrug-based gene therapy using the low Km cyclophosphamide 4-hydroxylase P450 2B11. Mol Cancer Ther. 2006;5(3):541–55. doi: 10.1158/1535-7163.MCT-05-0321. [DOI] [PubMed] [Google Scholar]
- 15.Wickman G, Hallin M, Dillon R, et al. Further Characterization of the Potent VEGF/PDGF Receptor Tyrosine Kinase Inhibitor, AG-013736, in Preclinical Tumor Models for its Antiangiognesis and Antitumor Activity. Proc Am Assoc Cancer Res. 2003:A3780. [Google Scholar]
- 16.Inai T, Mancuso M, Hashizume H, et al. Inhibition of vascular endothelial growth factor (VEGF) signaling in cancer causes loss of endothelial fenestrations, regression of tumor vessels, and appearance of basement membrane ghosts. Am J Pathol. 2004;165(1):35–52. doi: 10.1016/S0002-9440(10)63273-7. [DOI] [PMC free article] [PubMed] [Google Scholar]
- 17.Kim YR, Yudina A, Figueiredo J, et al. Detection of early antiangiogenic effects in human colon adenocarcinoma xenografts: in vivo changes of tumor blood volume in response to experimental VEGFR tyrosine kinase inhibitor. Cancer Res. 2005;65(20):9253–60. doi: 10.1158/0008-5472.CAN-03-2619. [DOI] [PubMed] [Google Scholar]
- 18.Wilmes LJ, Pallavicini MG, Fleming LM, et al. AG-013736, a novel inhibitor of VEGF receptor tyrosine kinases, inhibits breast cancer growth and decreases vascular permeability as detected by dynamic contrast-enhanced magnetic resonance imaging. Magn Reson Imaging. 2007;25(3):319–27. doi: 10.1016/j.mri.2006.09.041. [DOI] [PubMed] [Google Scholar]
- 19.Rugo HS, Herbst RS, Liu G, et al. Phase I trial of the oral antiangiogenesis agent AG-013736 in patients with advanced solid tumors: pharmacokinetic and clinical results. J Clin Oncol. 2005;23(24):5474–83. doi: 10.1200/JCO.2005.04.192. [DOI] [PubMed] [Google Scholar]
- 20.Kirsch M, Strasser J, Allende R, Bello L, Zhang J, Black PM. Angiostatin suppresses malignant glioma growth in vivo. Cancer Res. 1998;58(20):4654–9. [PubMed] [Google Scholar]
- 21.Ma J, Waxman DJ. Collaboration between hepatic and intratumoral prodrug activation in a P450 prodrug-activation gene therapy model for cancer treatment. Mol Cancer Ther. 2007 doi: 10.1158/1535-7163.MCT-07-0297. in press. [DOI] [PMC free article] [PubMed] [Google Scholar]
- 22.Chen CS, Jounaidi Y, Su T, Waxman DJ. Enhancement of intratumoral cyclophosphamide pharmacokinetics and antitumor activity in a P450 2B11-based cancer gene therapy model. Cancer Gene Ther. 2007 doi: 10.1038/sj.cgt.7701092. [DOI] [PMC free article] [PubMed] [Google Scholar]
- 23.Chen CS, Lin JT, Goss KA, He YA, Halpert JR, Waxman DJ. Activation of the anticancer prodrugs cyclophosphamide and ifosfamide: identification of cytochrome P450 2B enzymes and site-specific mutants with improved enzyme kinetics. Mol Pharmacol. 2004;65(5):1278–85. doi: 10.1124/mol.65.5.1278. [DOI] [PubMed] [Google Scholar]
- 24.Yu LJ, Drewes P, Gustafsson K, Brain EGC, Hecht JED, Waxman DJ. In Vivo Modulation of Alternative Pathways of P-450-Catalyzed Cyclophosphamide Metabolism: Impact on Pharmacokinetics and Antitumor Activity. J Pharmacol Exp Ther. 1999;288(3):928–37. [PubMed] [Google Scholar]
- 25.Schwartz PS, Waxman DJ. Cyclophosphamide induces caspase 9-dependent apoptosis in 9L tumor cells. Mol Pharmacol. 2001;60(6):1268–79. doi: 10.1124/mol.60.6.1268. [DOI] [PubMed] [Google Scholar]
- 26.Hamano Y, Sugimoto H, Soubasakos MA, et al. Thrombospondin-1 associated with tumor microenvironment contributes to low-dose cyclophosphamide-mediated endothelial cell apoptosis and tumor growth suppression. Cancer Res. 2004;64(5):1570–4. doi: 10.1158/0008-5472.can-03-3126. [DOI] [PubMed] [Google Scholar]
- 27.Pietras K, Hanahan D. A multitargeted, metronomic, and maximum-tolerated dose “chemo-switch” regimen is antiangiogenic, producing objective responses and survival benefit in a mouse model of cancer. J Clin Oncol. 2005;23(5):939–52. doi: 10.1200/JCO.2005.07.093. [DOI] [PubMed] [Google Scholar]
- 28.Folkins C, Man S, Xu P, Shaked Y, Hicklin DJ, Kerbel RS. Anticancer therapies combining antiangiogenic and tumor cell cytotoxic effects reduce the tumor stem-like cell fraction in glioma xenograft tumors. Cancer Res. 2007;67(8):3560–4. doi: 10.1158/0008-5472.CAN-06-4238. [DOI] [PubMed] [Google Scholar]
- 29.Huber PE, Bischof M, Jenne J, et al. Trimodal cancer treatment: beneficial effects of combined antiangiogenesis, radiation, and chemotherapy. Cancer Res. 2005;65(9):3643–55. doi: 10.1158/0008-5472.CAN-04-1668. [DOI] [PubMed] [Google Scholar]
- 30.Hurwitz H, Fehrenbacher L, Novotny W, et al. Bevacizumab plus Irinotecan, Fluorouracil, and Leucovorin for Metastatic Colorectal Cancer. N Engl J Med. 2004;350(23):2335–42. doi: 10.1056/NEJMoa032691. [DOI] [PubMed] [Google Scholar]
- 31.Klement G, Huang P, Mayer B, et al. Differences in therapeutic indexes of combination metronomic chemotherapy and an anti-VEGFR-2 antibody in multidrug-resistant human breast cancer xenografts. Clin Cancer Res. 2002;8(1):221–32. [PubMed] [Google Scholar]
- 32.Jinushi M, Dranoff G. Triggering Tumor Immunity through Angiogenesis Targeting. Clin Cancer Res. 2007;13(13):3762–4. doi: 10.1158/1078-0432.CCR-07-0880. [DOI] [PubMed] [Google Scholar]
- 33.Kamba T, Tam BY, Hashizume H, et al. VEGF-dependent plasticity of fenestrated capillaries in the normal adult microvasculature. Am J Physiol Heart Circ Physiol. 2006;290(2):H560–76. doi: 10.1152/ajpheart.00133.2005. [DOI] [PubMed] [Google Scholar]
- 34.Reichardt W, Hu-Lowe D, Torres D, Weissleder R, Bogdanov A., Jr Imaging of VEGF receptor kinase inhibitor-induced antiangiogenic effects in drug-resistant human adenocarcinoma model. Neoplasia. 2005;7(9):847–53. doi: 10.1593/neo.05139. [DOI] [PMC free article] [PubMed] [Google Scholar]
- 35.Nakahara T, Norberg SM, Shalinsky DR, Hu-Lowe DD, McDonald DM. Effect of inhibition of vascular endothelial growth factor signaling on distribution of extravasated antibodies in tumors. Cancer Res. 2006;66(3):1434–45. doi: 10.1158/0008-5472.CAN-05-0923. [DOI] [PubMed] [Google Scholar]
- 36.Ma J, Pulfer S, Li S, Chu J, Reed K, Gallo JM. Pharmacodynamic-mediated reduction of temozolomide tumor concentrations by the angiogenesis inhibitor TNP-470. Cancer Res. 2001;61(14):5491–8. [PubMed] [Google Scholar]
- 37.Segers J, Fazio VD, Ansiaux R, et al. Potentiation of cyclophosphamide chemotherapy using the anti-angiogenic drug thalidomide: Importance of optimal scheduling to exploit the ‘normalization’ window of the tumor vasculature. Cancer Lett. 2006 doi: 10.1016/j.canlet.2005.12.017. [DOI] [PubMed] [Google Scholar]
- 38.Tong RT, Boucher Y, Kozin SV, Winkler F, Hicklin DJ, Jain RK. Vascular normalization by vascular endothelial growth factor receptor 2 blockade induces a pressure gradient across the vasculature and improves drug penetration in tumors. Cancer Res. 2004;64(11):3731–6. doi: 10.1158/0008-5472.CAN-04-0074. [DOI] [PubMed] [Google Scholar]
- 39.Dickson PV, Hamner JB, Sims TL, et al. Bevacizumab-induced transient remodeling of the vasculature in neuroblastoma xenografts results in improved delivery and efficacy of systemically administered chemotherapy. Clin Cancer Res. 2007;13(13):3942–50. doi: 10.1158/1078-0432.CCR-07-0278. [DOI] [PubMed] [Google Scholar]
- 40.Wildiers H, Guetens G, De Boeck G, et al. Effect of antivascular endothelial growth factor treatment on the intratumoral uptake of CPT-11. Br J Cancer. 2003;88(12):1979–86. doi: 10.1038/sj.bjc.6601005. [DOI] [PMC free article] [PubMed] [Google Scholar]
Associated Data
This section collects any data citations, data availability statements, or supplementary materials included in this article.


