Abstract
Robust voltammetric responses were obtained for wild-type and Y72F/H83Q/Q107H/Y108F azurins adsorbed on CH3(CH2)nSH:HO(CH2)mSH (n=m=4,6,8,11; n=13,15 m=11) self-assembled monolayer (SAM) gold electrodes in acidic solution (pH 4.6) at high ionic strengths. Electron-transfer (ET) rates do not vary substantially with ionic strength, suggesting that the SAM methyl headgroup binds to azurin by hydrophobic interactions. The voltammetric responses for both proteins at higher pH values (>4.6 to 11) also were strong. A binding model in which the SAM hydroxyl headgroup interacts with the Asn47 carboxamide accounts for the relatively strong coupling to the copper center that can be inferred from the ET rates. Of particular interest is the finding that rate constants for electron tunneling through n = 8, 13 SAMs are higher at pH 11 than those at pH 4.6, possibly owing to enhanced coupling of the SAM to Asn 47 caused by deprotonation of nearby surface residues.
1. Introduction
Robust voltammetric responses have been obtained from redox-active metalloproteins adsorbed on self-assembled-monolayer (SAM) electrodes.1-22 Systematic experiments with both wild type and mutant proteins have pinpointed surface regions that are well coupled for electron tunneling to and from the redox-active site. Cytochrome c (cyt c) adsorbed onto SAM-gold electrodes is a case in point: in experiments with surface-modified proteins, Niki and coworkers obtained data that strongly suggest that the SAM carboxylate terminus is coupled to the heme in the region near Lys13.10
It is well established that Pseudomonas aeruginosa azurin can be immobilized on alkanethiol-SAMs;11-15 and, importantly, that the protein exhibits particularly strong voltammetric responses on 1:1 CH3(CH2)nSH:HO(CH2)mSH (n=m=4,6,8,11; n=13,15 m=11) SAM gold electrodes.16 Tryptophan-48 apparently plays a special role in coupling the copper to the electrode; mutants without it (e.g., W48F) are electrochemically inactive, whereas ones with it in place such as Y72F/H83Q/Q107H/Y108F (abbreviated Trp48-all-Phe) give good voltammetric responses. Based on these and other findings, we proposed that Asn47 binding interactions with 1:1 mixed SAM headgroups promote electron tunneling to and from the blue copper via an Asn47-Cys112 hydrogen-bond pathway.16
Here we report the effects of pH and ionic strength on the electron-transfer (ET) kinetics of wild-type and Trp48-all-Phe azurins on 1:1 mixed SAM gold electrodes. Remarkably, the protein is electrochemically active in very basic solutions (above pH 10), with the pH 11 (n = 8) Cu/electrode rate somewhat higher than that at pH 4.6. Both the rate/pH and rate/ionic strength profiles can be interpreted in terms of a binding model featuring SAM hydrophobic and polar headgroup interactions with the azurin surface near Asn47.
2. Experimental Section
Reagents
Pentanethiol (CH3(CH2)4SH), heptanethiol, nonanethiol, dodecanethiol, hexadecanethiol, 4-mercapto-1-butanol (HS(CH2)4OH), 6-mercapto-1-hexanol, and 11-mercapto-1-undecanol were obtained from Aldrich Chemical Co. (St. Louis, MO). Tetradecanethiol was from Fluka Chemie AG (Buchs, Switzerland). 8-Mercapto-1-octanol was from Dojindo Molecular Technology (Gaithersburg, MD).
Proteins
P. aeruginosa azurin was isolated and purified according to Chang et al.23 Y72F/H83Q/Q107H/Y108F (Trp48-all-Phe azurin) was expressed using Stratagene's QuikChange Multi Site-Directed Mutagenesis Kit from an in-house plasmid.
Electrodes
Gold bead electrodes were prepared by melting gold wire >99.999% from Alfa Aesar/Johnson Matthey (Ward Hill, MA) in a hydrogen flame. The procedure for the preparation of clean gold bead electrodes has been reported.24 Mixed SAM electrodes were prepared by immersing gold beads into 200 μM mixed ethanol solutions of thiols at room temperature for more than 3 h. Prior to protein immobilization the SAM coated electrodes were activated by electrochemical treatment in 10 mM acetate buffer solution at pH 4.6. Potential ranges of the oxidation-reduction cycle (ORC) were 0.4 ∼ − 0.2 V. Proteins were immobilized by soaking the SAM-coated electrodes in about 100 μM protein (10 mM acetate buffer) solution at pH 4.6 overnight in a refrigerator. Prior to cyclic voltammetric (CV) measurements, the electrodes were thoroughly rinsed with Milli-Q water to remove excess protein from the electrode surface.
Electrochemical measurements
Electrolyte solutions for pH dependence measurements were 10 mM ammonium acetate at pH 4.6, 7.0, 8.0. For high pH experiments, 10 mM ammonium acetate buffer was adjusted to 9.0, 10.0, and 11.0 by adding NaOH.
Cu/electrode rate constants for electron tunneling through different 1:1 mixed SAMs were evaluated from CV peak separations.25 Electrode potentials were measured vs. Ag/AgCl in satd. KCl (0.197 V vs. NHE). Cyclic voltammetry was performed using a Model 660 Electrochemical Workstation (CH-Instrument, Austin, TX) at room temperature.
3. Results and Discussion
3−1. Ionic strength effects
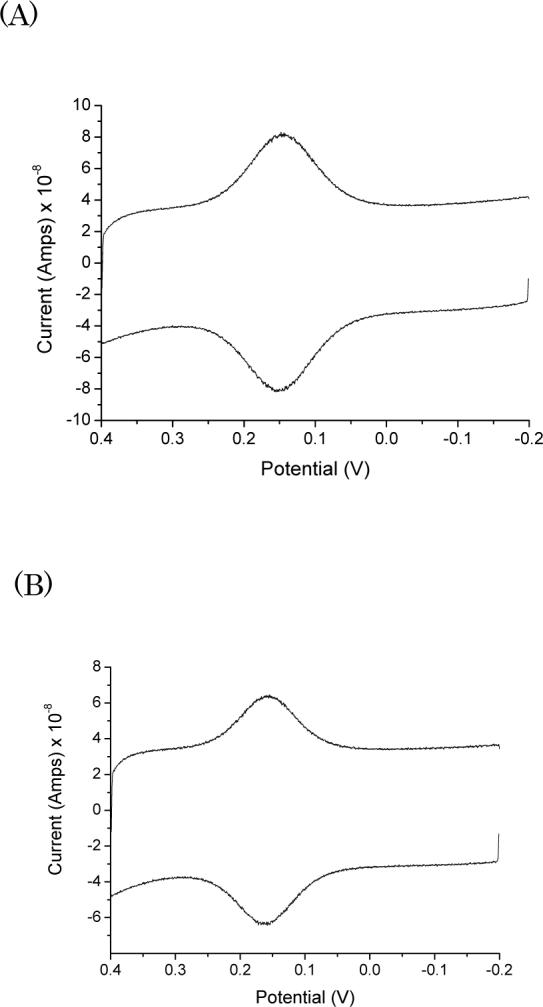
The effect of ionic strength on the Cu/electrode ET rates was investigated at pH 4.6. Well-defined voltammetric responses for the wild-type protein were obtained in 100 mM NH4Ac buffer (Fig. 1A). The estimated ET rate is 1.0 × 10³ s−1 (n = 8; ΔGO = 0), which is higher than that in much lower ionic strength buffer (10 mM NH4Ac) at pH 4.6 (1.8 × 10² s−1). There are fewer charged groups on the azurin surface than on cyt c, a protein where the heme/electrode ET rate constant decreases with increasing ionic strength.7,8,21 The rate/ionic strength profile for cyt c can be interpreted in terms of binding-site electrostatic interactions screened by the added salt that would increase the distance between protein lysine residues and the SAM surface.21,26
Figure 1.

Cyclic voltammograms of wild-type (A) and Trp48-all-Phe (B) azurins on a 1:1 CH3(CH2)8SH:HO(CH2)8SH gold electrode in 100 mM NH4Ac buffer at pH 4.6.
Earlier we reported electrochemical measurements on wild-type and four mutant azurins on 1:1 mixed SAM electrodes.16 Only the wild-type protein and a mutant containing Trp48 gave well-defined voltammetric responses. Analysis of voltammetric responses for Trp48-all-Phe azurin in 100 mM NH4Ac buffer at pH 4.6 (Fig. 1B) gives a Cu/electrode ET rate of 9.7 × 10² s−1, which is nearly the same as that for wild-type azurin (1.0 × 10³ s−1) at the same ionic strength and pH. Very small effects of ionic strength on the ET rate also were found in experiments with Trp48-all-Phe azurin.
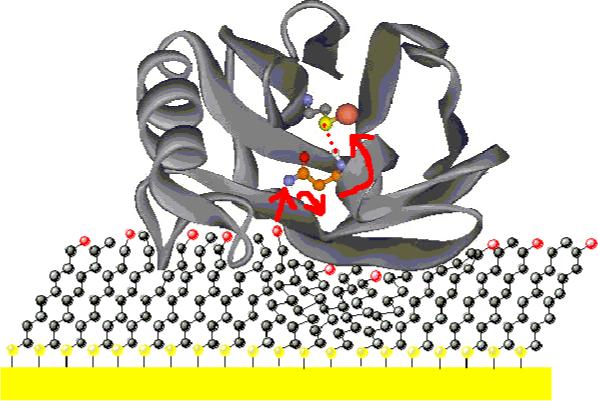
The very strong voltammetric responses for both wild-type and mutant azurins confirm that the blue copper redox center is well coupled to the mixed SAM electrode. Both theoretical and experimental work has shown convincingly that the Cys112 thiolate is the preferred entry point for electron tunneling to the copper,27-33 so it follows that the likely site for productive protein-SAM interactions is the region near Asn47 (Fig. 2). We propose that the hydroxyl head groups make hydrogen bonds at the Asn47 surface, with the binding enhanced by hydrophobic interactions with nearby methyl head groups. In this proposed precursor complex model, the best ET path would involve coupling Asn47 to the sulfur atom of Cys112.
Figure 2.

Proposed electron tunneling pathway to the blue copper in azurin on a 1:1 mixed SAM gold electrode. Asn 47 is in orange (Cγ, Cβ, Cα), blue (Nδ, N), red (Oδ) and white (H); Cys 112 Sγ is in yellow; Cu ion is in red (PDB code: 4AZU).
3−2. pH effects
Well-defined voltammetric responses for wild-type azurin have been obtained over the pH range 4.6 to 11. The formal potential of the protein on the mixed SAM depends on pH (Fig. 4A); as the pH of the solution increases, the formal potential shifts to more negative values.
Figure 4.

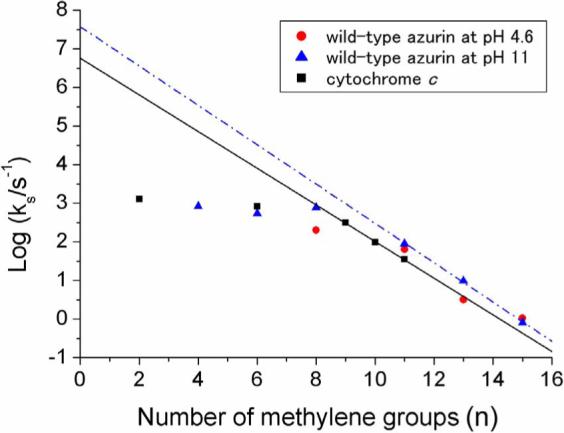
ET rates vs. chain length (n) for wild-type azurin at pH 11 (blue triangles) and 4.6 (red dots) on a 1:1 CH3(CH2)nSH:HO(CH2)mSH gold electrode (n=m=4,6,8,11; n=13,15 m=11); values for cyt c on carboxylic acid-terminated alkanethiol-SAM gold electrodes (black squares) are shown for comparison. Exponential decays: β = 1.1 per CH2 (dashed line ); β = 1.2 per CH2 (solid line).
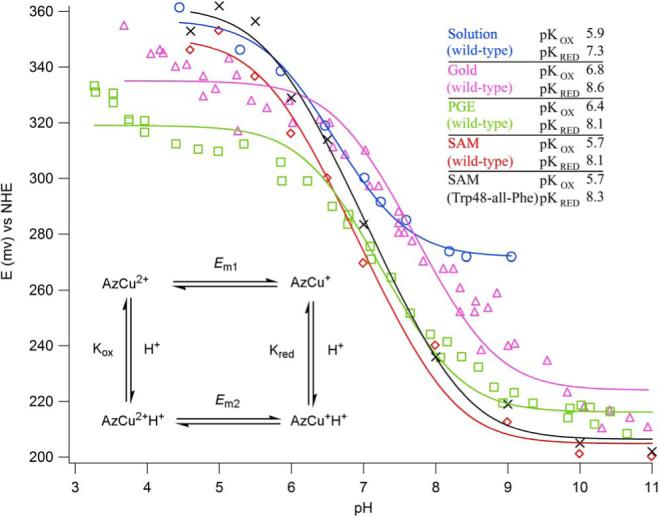
The midpoint potentials exhibit pH-titration curves with plateaus both at high and low pH, the signature of an acid-base equilibrium. Theoretical curves were constructed using Eq. 1,
| (1) |
in which Kox and Kred are proton dissociation constants for a group in two redox states and Em1 is the midpoint potential at acid pH. With ne = 1 , we obtain pKox = 5.7 (± 0.1), pKred = 8.1 (± 0.1) (wild-type), and pKox = 5.7 (± 0.1), pKred = 8.3 (± 0.1) (W48-all-Phe) (Fig. 3).
Figure 3.

Midpoint potentials vs. pH: wild-type and Trp48-all-Phe azurins on a 1:1 CH3(CH2)8SH:HO(CH2)8SH gold electrode. Other fits are based on literature data: [Solution (wild-type)]34; and [Gold (wild-type); PEG (wild-type)]12. Inset: Kox and Kred are the protonation constants for the oxidized and the reduced forms of the protein; and Em1 and Em2 are the midpoint potentials at low and high pH.
The potentials at low pH are more than 150 mV higher than the potentials at high pH. The observed pH dependence of the potential of adsorbed wild-type azurin is different from that in solution,34-36 as the reduced protein (AzCu+H+) is only partially deprotonated below pH 8 on the mixed SAM. Since His35 is the only noncoordinated histidine present both in wild-type and W48-all-Phe proteins, it is likely that the observed pKs are attributable to the deprotonation/protonation equilibria of its imidazole.
At pH 11, unexpectedly, the CV peak separation for the wild-type protein is very small, indicating that ET is very rapid. The standard ET rate constant k varies exponentially with the number of methylene groups (n) in the alkyl chain, according to Eq. 2:16
| (2) |
where k0 is the extrapolated value of the rate constant (n = 0). A plot of log kET vs. the number of methylene groups in the longer (n = 11, 13, 15) alkanethiol chains is linear for the protein at pH 11 (Fig. 4); the exponential decay constant is 1.17 per methylene group, in accord with previous results.16 Strikingly, the n = 8 and n = 13 ET rate constants for wild-type azurin at pH 11 are greater than those at pH 4.6, possibly owing to enhanced coupling of the SAM to Asn 47 caused by deprotonation of nearby surface residues. It also is of interest that all ET rates reach a plateau (− 103 s−1) for n < 9, in accord with findings based on experiments performed in several different laboratories.7-10,16-22 The current view is that this limiting rate is attributable to protein-SAM interfacial dynamics.16,19,20
4. Acknowledgements
Dedicated to Ed Solomon, in appreciation of his pioneering work on blue copper proteins; supported by NIH DK19038.
Footnotes
Publisher's Disclaimer: This is a PDF file of an unedited manuscript that has been accepted for publication. As a service to our customers we are providing this early version of the manuscript. The manuscript will undergo copyediting, typesetting, and review of the resulting proof before it is published in its final citable form. Please note that during the production process errors may be discovered which could affect the content, and all legal disclaimers that apply to the journal pertain.
Contribution from the Beckman Institute, California Institute of Technology, Pasadena, California 91125, and Department of Biotechnology, Tokyo University of Agriculture and Technology, Koganei, Tokyo 184−8588, Japan
Supplementary Material
Supporting information: Time dependence of the CV response for wild-type azurin at pH 11
Well-defined voltammetric responses of wild-type azurin were obtained even after immersion for one hour at pH 11.0 (Fig. S1).
Figure S1 Cyclic voltammograms of wild-type azurin on a 1:1 CH3(CH2)8SH:HO(CH2)8SH gold electrode in 10 mM NaKPi buffer + NaOH at pH 11 (50 mV/s).
5. References
- 1.Tarlov MJ, Bowden EF. J. Am. Chem. Soc. 1991;113:1847. [Google Scholar]
- 2.Collinson M, Bowden EF, Tarlov MJ. Langmuir. 1992;8:1247. [Google Scholar]
- 3.Song S, Clark RA, Bowden EF, Tarlov MJ. J. Phys. Chem. 1993;97:6564. [Google Scholar]
- 4.Kasmi AE, Wallace JM, Bowden EF, Binet SM, Linderman RJ. J. Am. Chem. Soc. 1998;120:225. [Google Scholar]
- 5.Feng ZQ, Imabayashi S, Kakiuchi T, Niki K. J. Electroanal, Chem. 1995;394:149. [Google Scholar]
- 6.Arnold S, Feng ZQ, Kakiuchi T, Knoll W, Niki K. J. Electroanal. Chem. 1997;438:91. [Google Scholar]
- 7.Feng ZQ, Imabayashi S, Kakiuchi T, Niki K. J. Chem. Soc., Faraday Trans. 1997;93:1367. [Google Scholar]
- 8.Avila A, Gregory BW, Niki K, Cotton TM. J. Phys. Chem. B. 2000;104:2759. [Google Scholar]
- 9.Niki K, Sprinkle JR, Margoliash E. Bioelectrochemistry. 2002;55:37. doi: 10.1016/s1567-5394(01)00157-8. [DOI] [PubMed] [Google Scholar]
- 10.Niki K, Hardy WR, Hill MG, Li H, Sprinkle JR, Margoliash E, Fujita K, Tanimura R, Nakamura N, Ohno H, Richards JH, Gray HB. J. Phys. Chem. B. 2003;107:9947. [Google Scholar]
- 11.Jeuken LJC, Armstrong FA. J. Phys. Chem. B. 2001;105:5271. [Google Scholar]
- 12.Jeuken LJC, Wisson L-J, Armstrong FA. Inorg. Chim. Acta. 2002;331:216. [Google Scholar]
- 13.Gaigalas AK, Niaura GJ. Colloid Interface Sci. 1997;193:60. doi: 10.1006/jcis.1997.5034. [DOI] [PubMed] [Google Scholar]
- 14.Firstrup P, Grubb M, Zhang J, Christensen HEM, Hansen AM, Ulstrup J. J. Electroanal.Chem. 2001;511:128. [Google Scholar]
- 15.Chi Q, Zhang J, Andersen ET, Ulstrup J. J. Phys. Chem. B. 2001;105:4669. [Google Scholar]
- 16.Fujita K, Nakamura N, Ohno H, Leigh BS, Niki K, Gray HB, Richards JH. J. Am. Chem. Soc. 2004;126:13954. doi: 10.1021/ja047875o. [DOI] [PubMed] [Google Scholar]
- 17.Khoshtariya DE, Wei J, Liu H, Yue H, Waldeck DH. J. Am. Chem. Soc. 2003;125:7704. doi: 10.1021/ja034719t. [DOI] [PubMed] [Google Scholar]
- 18.Wei JJ, Liu H, Niki K, Margoliash E, Waldeck DH. J. Phys. Chem. B. 2004;108:16912. [Google Scholar]
- 19.Murgida DH, Hidebrandt P. Phys. Chem. Chem. Phys. 2005;7:3773. doi: 10.1039/b507989f. [DOI] [PubMed] [Google Scholar]
- 20.Yue H, Waldeck DH. Curr. Opinion Solid State Mater. Sci. 2005;9:28. [Google Scholar]
- 21.Yue H, Waldeck DH, Petrovic J, Clark RA. J. Phys. Chem. B. 2006;110:5062. doi: 10.1021/jp055768q. [DOI] [PubMed] [Google Scholar]
- 22.Yue H, Khoshtariya D, Waldeck DH, Groshol J, Hildebrandt P, Murgida DH. J. Phys. Chem. B. 2006;110:19906. doi: 10.1021/jp0620670. [DOI] [PubMed] [Google Scholar]
- 23.Chang TK, Iverson SA, Rodrigues CG, Kiser CN, Lew AYC, Germanas JP, Richards JH. Proc. Natl. Acad. Sci.U.S.A. 1991;88:1325. doi: 10.1073/pnas.88.4.1325. [DOI] [PMC free article] [PubMed] [Google Scholar]
- 24.Tanimura R, Hill MG, Margoliash E, Niki K, Ohno H, Gray HB. Electrochem. Solid-State Lett. 2002;5:E67. [Google Scholar]
- 25.Laviron E. J. Electroanal. Chem. 1979;101:19. [Google Scholar]
- 26.Avila A, Gregory BW, Niki K, Cotton TM. J. Phys. Chem. B. 2000;104:2759. [Google Scholar]
- 27.Gradinaru C, Crane BR. J. Phys. Chem. B. 2006;110:20073. doi: 10.1021/jp0644309. [DOI] [PubMed] [Google Scholar]
- 28.Gray HB, Winkler JR. Proc. Natl. Acad. Sci. U.S.A. 2005;102:3534. doi: 10.1073/pnas.0408029102. [DOI] [PMC free article] [PubMed] [Google Scholar]
- 29.Regan JJ, Di Bilio AJ, Langen R, Skov LV, Winkler JR, Gray HB. J. N. Onuchic Chem. Biol. 1995;2:489. doi: 10.1016/1074-5521(95)90266-x. [DOI] [PubMed] [Google Scholar]
- 30.Crane BR, Di Bilio AJ, Winkler JR, Gray HB. J. Am. Chem. Soc. 2001;123:11623. doi: 10.1021/ja0115870. [DOI] [PubMed] [Google Scholar]
- 31.Farver O, Pecht I. Adv. Chem. Phys. 1999;107:555. [Google Scholar]
- 32.Gray HB, Malmstrom BG, Williams RJP. J. Biol. Inorg. Chem. 2000;5:551. doi: 10.1007/s007750000146. [DOI] [PubMed] [Google Scholar]
- 33.Lowery MD, Solomon EI. Inorg. Chim. Acta. 1992;200:233. [Google Scholar]
- 34.Pettigrew GW, Leitch FA, Moore GR. Biochim. Biophys. Acta. 1983;725:409. doi: 10.1016/0005-2728(83)90181-0. [DOI] [PubMed] [Google Scholar]
- 35.Nar H, Messerschmidt A, Huber R, van de Kam M, Canters GW. J. Mol. Biol. 1991;221:765. doi: 10.1016/0022-2836(91)80173-r. [DOI] [PubMed] [Google Scholar]
- 36.Kalverda AP, Ubbink M, Gilardi G, Wijmenga SS, Crawford A, Jeuken LJC, Canters GW. Biochemistry. 1999;38:12690. doi: 10.1021/bi990624l. [DOI] [PubMed] [Google Scholar]
Associated Data
This section collects any data citations, data availability statements, or supplementary materials included in this article.
Supplementary Materials
Supporting information: Time dependence of the CV response for wild-type azurin at pH 11
Well-defined voltammetric responses of wild-type azurin were obtained even after immersion for one hour at pH 11.0 (Fig. S1).
Figure S1 Cyclic voltammograms of wild-type azurin on a 1:1 CH3(CH2)8SH:HO(CH2)8SH gold electrode in 10 mM NaKPi buffer + NaOH at pH 11 (50 mV/s).


