Abstract
Background and objectives: Experimentally elevated potassium causes a clear pattern of electrocardiographic changes, but, clinically, the reliability of this pattern is unclear. Case reports suggest patients with renal insufficiency may have no electrocardiographic changes despite markedly elevated serum potassium. In a prospective series, 46% of patients with hyperkalemia were noted to have electrocardiographic changes, but no clear criteria were presented.
Design, setting, participants, & measurements: Charts were reviewed for patients who were admitted to a community-based hospital with a diagnosis of hyperkalemia. Inclusion criteria were potassium ≥6 with a concurrent electrocardiogram. Data were abstracted regarding comorbid diagnoses, medications, and treatment. Potassium concentrations were documented along with other electrolytes, pH, creatinine, and biomarkers of cardiac injury. Coincident, baseline, and follow-up electrocardiograms were examined for quantitative and qualitative changes in the QRS and T waves as well as the official cardiology readings.
Results: Ninety patients met criteria; two thirds were older than 65, and 48% presented with renal failure. Common medications included β blockers, insulin, and aspirin; 80% had potassium <7.2. The electrocardiogram was insensitive for diagnosing hyperkalemia. Quantitative assessments of T-wave amplitude corroborated subjective assessments of T-wave peaking; however, no diagnostic threshold could be established. The probability of electrocardiographic changes increased with increasing potassium. The correlation between readers was moderate.
Conclusions: Given the poor sensitivity and specificity of electrocardiogram changes, there is no support for their use in guiding treatment of stable patients. Without identifiable electrocardiographic markers of the risk for complications, management of hyperkalemia should be guided by the clinical scenario and serial potassium measurements.
Hyperkalemia is a common and a potentially life-threatening electrolyte disorder in patients in the hospital setting. Exact incidence varies between surveys, with estimates ranging between 1.1 and 10% of hospitalized patients (1–4). Such estimates are reinforced by reports that in patients who are treated with at least prophylactic doses of heparin, now standard of care for most hospitalized patients, the incidence of hyperkalemia is between 7 and 8% (5). Although severe cases may be associated with paralysis and cardiac arrest, in the majority of cases, symptoms are most often nonspecific and may include muscle twitching, nausea, vomiting, and abdominal pain (6).
In experimental settings, hyperkalemia has been associated with a defined series of electrocardiogram (ECG) abnormalities, including shortening of QT interval, peaking of T waves, QRS prolongation, shortening of PR interval, reduction in amplitude of the P wave, loss of sinoatrial conduction with onset of a wide-complex “sine-wave” ventricular rhythm, and ultimately asystole (7). Although no uniform threshold has been documented in animal models, the most severe cardiac manifestations have been shown to occur with serum potassium concentrations >9 mEq/L (7). On the basis of these experimental observations, commonly used clinical references recommend ECG assessment as an integral part of the evaluation of patients with hyperkalemia (8).
In clinical series, the relationship between serum potassium concentration and cardiac manifestations is less clear. In one published series of 127 patients with serum potassium concentrations ranging between 6 and 9.3 mEq/L, no serious arrhythmias were documented (9). Only 46% of ECG were noted to have changes suggestive of hyperkalemia, including QRS widening, conduction deficits, and peaking of T waves (9). There are multiple case reports of patients with renal failure who presented without significant ECG changes despite markedly elevated potassium levels (10,11). Other, less typical ECG presentations of hyperkalemia include ST elevations mimicking acute myocardial infarction and rate-dependent bundle branch blocks (12–17). Given the high prevalence of cardiovascular disease in the surveyed population and the nonspecific nature of most of the observed ECG changes, the potential for confounding in any case series is significant.
Given the variability in the ECG presentation of hyperkalemia, it is not surprising that in the absence of formal criteria, the sensitivity of physician readers in the ECG diagnosis of hyperkalemia has been estimated to be as low as 0.34 to 0.43 (6). Significantly, the specificity in the same series was higher at 0.85 with a κ between readers of 0.73, indicating a high degree of correlation. When the sample was limited to ECGs with a potassium >6.5, the sensitivity was higher (between 0.55 and 0.62), suggesting that the majority of missed diagnoses occurred with potassium in the range of 5.0 to 6.4.
Attempts have been made to quantify the ECG changes associated with hyperkalemia in both experimental and clinical series. Wrenn et al. (6), in a study of patients who were on hemodialysis, examined the mean precordial T-wave amplitude and the mean ratio of precordial T-wave to R-wave amplitude as a reflection of the peaking of T waves. Given the lack of validation of this method, it is unclear whether the lack of documented correlation with serum potassium concentration reflects the inadequacy of the measurement or a physiologic difference in patients with ESRD. Porter et al.(18) used a combination of electrocardiographic markers incorporated into a neural network algorithm to diagnose hyperkalemia in dogs with high sensitivity (89%) and specificity (77%). Although compelling, these results have not been reproduced in human clinical settings, and the use of a neural network makes their application to patient care logistically more complicated. Given these uncertainties, we undertook a retrospective review of ECG parameters associated with laboratory diagnosis of hyperkalemia in an inpatient setting.
Concise Methods
St. Mary's Hospital in Waterbury, CT, is a 350-bed community hospital with an academic affiliation with Yale University School of Medicine. Potential cases were identified on the basis of the coded primary or secondary diagnosis of hyperkalemia (International Classification of Diseases, Ninth Revision code 2767) and admission between January 1, 2004, and March 31, 2005. Cases selected for inclusion were required to have a documented serum or plasma potassium concentration >6.0 with a coincident ECG (recorded within 1 h of laboratory draw and before therapy). Exclusion criteria were the lack of availability of a paper chart, lack of documented hyperkalemia, absence of an ECG coincident with the documented hyperkalemia episode, peak potassium levels of <6.0, laboratory notation of a hemolyzed sample without evident ECG changes, and elevated serum potassium with a baseline paced ECG with QRS and T-wave abnormalities limiting assessment of ECG changes.
Detailed review of the medical chart was performed for all identified cases. Data were abstracted from the emergency department records, admission history and physical, discharge summary, and coded diagnoses. Abstracted data included comorbid diagnoses, medication use, presence of underlying kidney disease, and the mode of treatment of hyperkalemia. Laboratory data were obtained from the electronic medical record. Specific elements collected included serum potassium and electrolyte levels, serum CO2, serum divalents, serum creatinine, pH from arterial blood gas, and biomarkers of cardiac injury when available. For the purpose of analysis, potassium and calcium concentrations were divided into quintiles.
ECGs coincident to the time of the hyperkalemia were reviewed and compared with baseline and follow-up ECGs when available. Laboratory data were reviewed to ensure that there was no documented hyperkalemia at the time of baseline, and follow-up ECGs and the ECG nearest in time to the episodes of hyperkalemia were selected for review. ECGs were examined for rate; intervals; ST deflection; T-wave inversions; and the magnitude and duration of the P, R, and T waves. Precordial lead-specific subjective assessments of peaking and symmetry of the T waves were also noted. These findings were compared with the official diagnoses recorded by the reading cardiologist. After the initial review, a random sample of 10 cases from those that met strict criteria for ECG changes and 10 cases from those that did not meet strict criteria was selected for interrater reliability analysis. A second reviewer, blinded to the results of the initial review, reviewed the ECGs for this sample for the presence of T-wave peaking and symmetry.
The presence or absence of ECG changes was coded according to the criteria in Table 1. Strict criteria for ECG changes consisted of presence of new peaked and symmetric T waves at the time of the documented hyperkalemia that resolved after correction of the serum potassium concentration. These criteria required that both baseline and follow-up ECGs be available for analysis. Additional criteria tested included the presence of new or resolving peaking of T waves or symmetry of T waves, both individually and in combination. For these analyses, either a baseline or a follow-up ECG was required to assess for the change.
Table 1.
Criteria for assessment of ECG changes on the basis of reviewer assessmenta
| Criteria Level | Details |
|---|---|
| Strict | Baseline and follow-up available. New peaked and symmetric T waves noted, which completely resolved on follow-up. |
| Any | Peaked or symmetric T waves noted, which were new or either partially or completely resolved on follow-up |
| Peaked | Peaked T waves noted, which were new or either partially or completely resolved on follow-up |
| Symmetric | Symmetric T waves noted, which were new or either partially or completely resolved on follow-up |
ECG, electrocardiogram.
Statistical analysis was performed using SAS 9.1.3 (SAS Institute, Cary, NC). Univariate analyses were conducted to identify both potential risk and mitigating factors for the development of ECG changes by the four previously mentioned criteria. χ2 analyses and Fisher exact test were used for categorical variables. Factors with significant associations were tested in multivariate logistic regression models. Nonparametric analysis using the Wilcoxon signed rank test was performed to test the impact of identified factors on measures of T-wave amplitude. κ statistics were used for assessments of interrater reliability.
Results
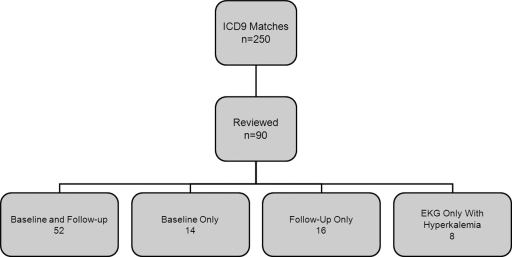
A total of 250 cases were identified on the basis of International Classification of Diseases, Ninth Revision diagnosis coding (Figure 1). Of these, 160 were excluded. The primary reasons for exclusion were absence of identifiable hyperkalemia (n = 19), low-grade elevations in serum potassium concentration with peak concentrations of <6 mg/dl (n = 68), and lack of an ECG coincident to the time of hyperkalemia (n = 50). Patient characteristics are summarized in Table 2. The sample consisted of slightly more men than women (57%). The median age of patients was 73, ranging between 20 and 93 with a disproportionate number of older patients. β Adrenergic blockers (n = 49), aspirin (n = 34), angiotensin-converting enzyme inhibitors (n = 31), and loop diuretics (n = 30) were the most commonly noted medications. Renal failure, both obstructive (n = 11) and nonobstructive (n = 39), were the most commonly identified diagnoses at admission followed by non–urinary tract infection (n = 23). The most frequently noted comorbid illnesses were diabetes (n = 50), chronic renal insufficiency (n = 43), and a history of coronary artery or peripheral vascular disease (n = 30).
Figure 1.
Case identification.
Table 2.
Baseline characteristicsa
| Characteristics | Frequency (%) |
|---|---|
| Demographics | |
| male | 51 (57) |
| age >65 | 60 (66) |
| Diagnoses | |
| acute renal failure | 50 (55) |
| chronic renal insufficiency | 43 (47) |
| history of coronary or peripheral artery disease | 30 (33) |
| congestive heart failure | 20 (22) |
| history of atrial fibrillation | 18 (20) |
| diabetes | 50 (55) |
| ECG | |
| LVH | 35 (39) |
| conduction abnormalities | 39 (43) |
| previous ischemia | 45 (50) |
LVH, left ventricular hypertrophy.
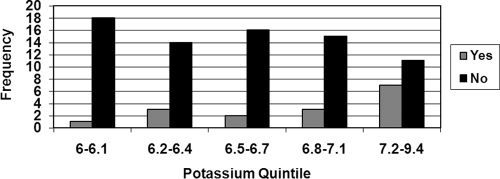
The distribution of recorded serum potassium concentrations was significantly skewed toward the lower end of the range with a median potassium level of 6.6 (range 6 to 9.4) at the time of the index event (Figure 2). Most patients were treated with kayexalate (n = 75) as well as calcium (n = 60) and insulin (n = 62). Median time to follow-up laboratory assessment was 302 min. Median potassium at time of follow-up was 5.8 (range 3.2 to 10). Arrhythmias were noted in 12 patients, with cardiac arrest documented in four cases.
Figure 2.
Potassium quintiles by presence of strict criteria for electrocardiogram (ECG) changes.
On examination of the ECGs, no difference was noted in P-wave amplitude, although the small size of the P waves limited the precision of the assessment in this regard. New QRS prolongation (QRS >120 ms) was noted in only six ECGs at time of hyperkalemia with maximum QRS duration of 140 (range 130 to 140). Of the 90 cases, only 24 were noted by the reading cardiologist to have T-wave findings, the majority (n = 21) of which were described as nonspecific. Three ECGs were assessed by cardiology review as having peaked T waves. None made specific reference to electrolyte abnormalities or hyperkalemia as a cause of the finding. Of the 21 noted to have nonspecific T-wave changes, suspicion for ischemia was documented in four cases. None of the three ECGs with noted peaking of the T waves was described as concerning for ischemia. There was no significant correlation between presence of T-wave changes either by cardiologist assessment or by serum potassium concentration as assessed by logistic regression (P = 0.21).
Of the 90 cases reviewed, 16 patients met strict criteria for ECG changes and 47 showed some ECG change. Twenty-nine patients had peaked T waves, and 28 patients were noted to have symmetric T waves. Sensitivities for all criteria were low ranging from 0.18 for strict criteria to 0.52 for the presence of any ECG change. The likelihood of meeting strict criteria for ECG changes increased with increasing concentrations of serum potassium (P = 0.0038), and there was a trend toward increased likelihood of new or resolving symmetric T waves (P = 0.052). The presence of new or resolving peaking of T waves was not significantly associated with serum potassium concentration (P = 0.095); neither was the presence of any T-wave change (P = 0.18).
In univariate analyses, β blocker use, insulin use, and diabetes were associated with an increased likelihood of ECG changes. Acidosis was associated with a reduction in the likelihood of peaking of T waves. Furosemide use correlated with a borderline significant reduction in the risk for both ECG changes by strict criteria and peaking of T waves. No significant relationship was found between calcium quintiles and the presence of ECG changes (P = 0.47).
Using the outcome of ECG changes by strict criteria, a multivariate logistic regression model was generated. The variables potassium quintile, acidosis, diabetes, β blocker use, insulin use, and furosemide use were included in the initial model. NS variables were sequentially removed until the final model was obtained. In the final model, only potassium quintile (odds ratio 1.772; 95% confidence interval 1.138 to 2.758) and insulin use (odds ratio 3.796; 95% confidence interval 1.041 to 13.839) showed significant association with the presence of ECG changes.
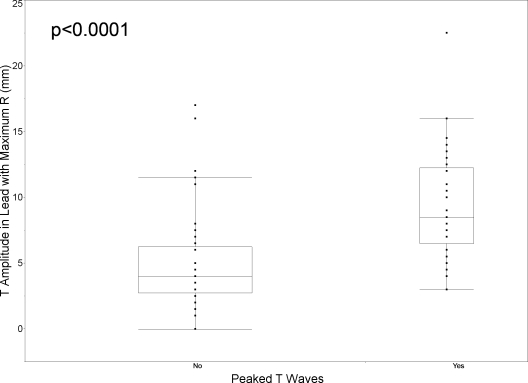
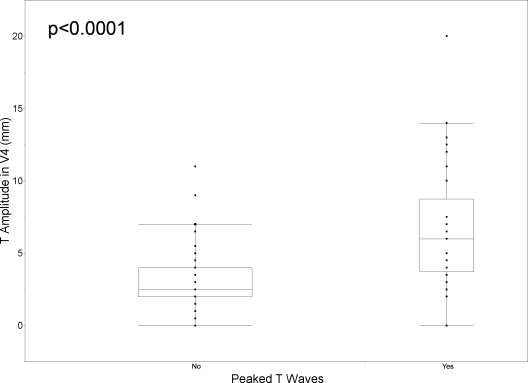
T-wave amplitude was assessed both for V4 and for the lead with the maximum R-wave deflection. The distribution of the lead with maximum R-wave deflection is shown in Table 3. Reviewer identification of peaked T waves correlated with a significant increase in T-wave amplitude in both leads (Wilcoxon P < 0.0001) as shown in Figures 3 and 4 but the increase was most evident in the lead with the maximum R-wave deflection. ECGs that met strict criteria for ECG changes showed statistically higher T:R ratios in both the lead with maximal R deflection (Wilcoxon P < 0.0001) and in lead V4 (Wilcoxon P = 0.0117). Significant overlap, however, was noted between the T:R ratio distributions, limiting this parameter's use as an independent diagnostic test.
Table 3.
Distribution of lead with maximum positive R-wave deflection
| Lead | v1 | v2 | v3 | v4 | v5 | v6 |
|---|---|---|---|---|---|---|
| n | 1 | 27 | 29 | 29 | 3 | 1 |
Figure 3.
T-wave amplitude in lead with maximum R-wave deflection by presence or absence of identified peaking of T waves.
Figure 4.
T-wave amplitude in V4 by presence or absence of identified peaking of T waves.
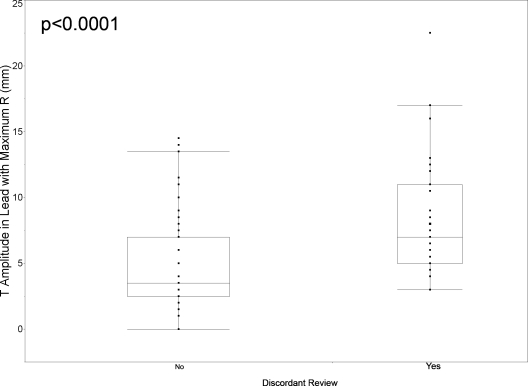
Significant discordance between the cardiologists’ assessments of the ECGs and those of the reviewer were noted for all criteria. Thirteen of 16 patients who met strict criteria for ECG changes were not noted by the cardiologist to have T-wave changes. Cases with discordant reviews were noted to have significantly higher T-wave amplitudes in both V4 and the lead with the maximum R-wave amplitude (P < 0.0001) with distribution as noted in Figure 5. Given that the criteria used by the cardiologist for assessing ECG changes were not documented and may have differed from those that we applied, statistical tests of concordance were not performed. Concordance between readers in our sample was moderate with κ statistics of 0.50 for strict criteria and peaking of T waves, 0.53 for symmetry of T waves, and 0.58 for presence of any ECG change Agreement was highest for the least restrictive criteria, the presence of either new or resolving peaking or symmetry of T waves.
Figure 5.
T-wave amplitude in lead with maximum R by concordance of review.
Discussion
Consistent with the previous reviews of ECG changes in patients with hyperkalemia, the sensitivity of the ECG for the diagnosis of hyperkalemia was poor. In this as in other series, the magnitude of potassium elevation was small, with 80% of cases demonstrating levels ≤7.1 mEq/L. The ECG, whether by cardiology assessment or by study criteria, was an insensitive tool for diagnosing hyperkalemia. Overall, the likelihood of identifying ECG changes increased with increasing levels of potassium. Quantitative assessments of T-wave amplitude corroborated the subjective assessments of peaking of the T waves; however, it was not possible to define a diagnostic threshold for peaking by T-wave amplitude or the ratio of T-wave to R-wave amplitude.
The correlation between readers was moderate, with κ statistics in the range 0.50 to 0.58 depending on the criteria considered. Because all patients in the study had a diagnosis of hyperkalemia, the reviewers were not blinded at the time of the ECG evaluation. Suspicion of hyperkalemia could lead to a tendency to infer peaking or symmetry in what may otherwise be considered nonspecific T-wave changes. The discordance in the readings between the cardiologist and the reviewers may to some extent reflect this bias. Given that such a bias would lead to an overestimation of the sensitivity and the observed sensitivities observed were low, the potential for bias in this case reinforces the concerns regarding the utility of the ECG in the diagnosis of hyperkalemia.
Patients in our series tended to be older and to present with renal failure. Use of β blockers, insulin, and aspirin was common and may both reflect physiologic effects of the medications and, in the case of insulin, represent a marker for more advanced contributing comorbidities such as diabetes, which may induce hyperkalemia through development of type IV renal tubular acidosis.
Given the nonspecific nature of the symptoms and the variability in the levels at which severe manifestations occur, it is tempting to use the ECG as a means to identify patients who show early cardiac manifestations of hyperkalemia and who may thereby warrant more aggressive treatment. Consistent with previous surveys, the risk for severe adverse outcomes in our series was low, even in the presence of ECG changes, limiting our ability to assess the utility of the ECG in this regard. This is likely due both to the early use of pharmacologic interventions and to the fact that for the majority of cases, the serum potassium concentrations recorded were significantly below the levels at which severe complications are noted to occur. Although in the face of such low numbers it is not possible to draw definite conclusions regarding the prognostic value of the ECG, it is interesting to note that of the 14 patients with noted arrhythmias or cardiac arrest, only one met strict criteria for ECG changes and fewer than half were noted to have new or resolving T-wave peaking or symmetry. For those who experienced complications despite initially nondiagnostic ECGs, a prospective study with serial ECGs would be necessary to determine whether a change in ECG pattern that might herald the onset of complications may be detectable later in the course.
There is potential for confounding at many levels in the interpretation ECG changes in the presence of hyperkalemia. Both ischemia and metabolic acidosis have been associated with ST and T-wave changes in the patterns described for hyperkalemia (19). Because arrhythmias may result both from severe acidosis and from myocardial ischemia, it is difficult to determine from chart review with any certainty the extent to which the observed clinical progression is due to hyperkalemia or other factors. Although the inclusion of markers of cardiac injury may rule out some cases of ECG changes as a result of acute coronary syndrome, the absence of elevation in these serum markers does not exclude ischemia as a confounding factor. There is also the potential that elevated serum potassium concentrations may potentiate the risk for arrhythmias that are attributable to other causes.
Conclusions
Given the poor sensitivity and specificity of ECG changes as a diagnostic test for hyperkalemia and the uncertainty with regard to its prognostic significance, there is no clear support for their use to guide management in otherwise clinically stable patients. At lower concentrations of serum potassium, specific ECG changes are rare and the incidence of complications is low. In the absence of identifiable ECG markers of the risk for complications, management of hyperkalemia should be guided by the clinical scenario and serial measurements of serum potassium concentration. Further prospective studies are necessary to assess the stability and progression of ECG changes in patients with hyperkalemia.
Disclosures
None.
Published online ahead of print. Publication date available at www.cjasn.org.
References
- 1.Paice B, Gray J, McBride D, Donnelly T, Lawson D: Hyperkalemia in patients in hospital. BMJ 286: 1189–1192, 1983 [DOI] [PMC free article] [PubMed] [Google Scholar]
- 2.Moore M, Bailery R: Incidence of hyperkalemia in hospitalized patients. N Z Med J 102: 557–558, 1989. 2812582 [Google Scholar]
- 3.Shemer J, Modan M, Ezra D, Cabili S: Incidence of hyperkalemia in hospitalized patients. Isr J Med Sci 19: 659–661, 1983 [PubMed] [Google Scholar]
- 4.Borra S, Shaker R, Kleinfeld M: Hyperkalemia in an adult hospitalized population. Mt Sinai J Med 55: 226–229, 1988 [PubMed] [Google Scholar]
- 5.Oster J, Singer I, Fishman L: Heparin-induced aldosterone suppression and hyperkalemia. Am J Med 98: 575–586, 1995 [DOI] [PubMed] [Google Scholar]
- 6.Wrenn KD, Slovis CM, Slovis BS: The ability of physicians to predict hyperkalemia from the ECG. Ann Emerg Med 20: 1229–1232, 1991 [DOI] [PubMed] [Google Scholar]
- 7.Ettinger PO, Regan TJ, Oldewurtel HA: Hyperkalemia, cardiac conduction, and the electrocardiogram: A review. Am Heart J 88: 360–371, 1974 [DOI] [PubMed] [Google Scholar]
- 8.Rose B: Clinical manifestations and treatment of hyperkalemia, Up-To-Date, 2007. Available at: http://www.utdol.com/utd/content/topic.do?topicKey=fldlytes/8142&view=print. Accessed July 30, 2007
- 9.Acker CG, Johnson JP, Palevsky PM, Greenberg A: Hyperkalemia in hospitalized patients: Causes, adequacy of treatment, and results of an attempt to improve physician compliance with published therapy guidelines. Arch Intern Med 158: 917–924, 1998 [DOI] [PubMed] [Google Scholar]
- 10.Martinez-Vea A, Bardaji A, Garcia C, Oliver JA: Severe hyperkalemia with minimal electrocardiographic manifestations: A report of seven cases. J Electrocardiol 32: 45–49, 1999 [DOI] [PubMed] [Google Scholar]
- 11.Aslam S, Friedman EA, Ifudu O: Electrocardiography is unreliable in detecting potentially lethal hyperkalaemia in haemodialysis patients. Nephrol Dial Transplant 17: 1639–1642, 2002 [DOI] [PubMed] [Google Scholar]
- 12.Pastor JA, Castellanos A, Moleiro F, Myerburg RJ: Patterns of acute inferior wall myocardial infarction caused by hyperkalemia. J Electrocardiol 34: 53–58, 2001 [DOI] [PubMed] [Google Scholar]
- 13.Vereckei A: Inferior wall pseudoinfarction pattern due to hyperkalemia. Pacing Clin Electrophysiol 26: 2181–2184, 2003 [DOI] [PubMed] [Google Scholar]
- 14.Cook LK: An acute myocardial infarction? Am J Crit Care 14: 313–315, 2005 [PubMed] [Google Scholar]
- 15.Hsieh MH, Cheng CY, Chan P, Tai CT, Chen SA: Monophasic action potential-like electrocardiogram simulating acute myocardial infarction. J Interv Card Electrophysiol 8: 41–44, 2003 [DOI] [PubMed] [Google Scholar]
- 16.Manohar N, Young ML: Rate dependent bundle branch block induced by hyperkalemia. Pacing Clin Electrophysiol 26: 1909–1910, 2003 [DOI] [PubMed] [Google Scholar]
- 17.Shiraishi H, Hyogo M, Ishibashi K, Hyogo M, Ishibashi K, Urao N, Tsukamoto M, Keira N, Hirasaki S, Shirayama T, Nakagawa M, Matsubara H: Rate-dependent QRS prolongation during exercise testing associated with hyperkalemia. J Electrocardiol 37: 241–245, 2004 [DOI] [PubMed] [Google Scholar]
- 18.Porter R, Kaplan J, Zhao N, de Garavilla L, Eynon CA, Wenger FG, Dalsey WC: Prediction of hyperkalemia in dogs from electrocardiographic parameters using an artificial neural network. Acad Emerg Med 8: 599–603, 2001 [DOI] [PubMed] [Google Scholar]
- 19.Dreyfuss D Guillaume J, Couturier R, Rahmani J, Assayag P, Coste F: Tall T waves during metabolic acidosis without hyperkalemia: a prospective study. Crit Care Med 17: 404–408, 1989 [DOI] [PubMed] [Google Scholar]


