Abstract
Vascular occlusive disease poses a threat to kidney viability, but whether the events leading to injury and eventual fibrosis actually entail reduced oxygenation and regional tissue ischemia is unknown. Answering this question has been difficult because of the lack of an adequate method to assess tissue oxygenation in humans. BOLD (blood oxygen-level-dependent) magnetic resonance imaging detects changes in tissue deoxyhemoglobin during maneuvers that affect oxygen consumption, therefore this technique was used to image and analyze cortical and medullary segments of 50 kidneys in 25 subjects undergoing magnetic resonance (MR) angiography to diagnose renal artery stenosis (RAS). Magnetic rate of relaxation (R2*) positively correlates with deoxyhemoglobin levels and was therefore used as a surrogate measure of tissue oxygenation. Furosemide was administered to examine the effect of inhibiting energy-dependent electrolyte transport on tissue oxygenation in subjects with renovascular disease. In 21 kidneys with normal nephrograms, administration of furosemide led to a 20% decrease in medullary R2* (P < 0.01) and an 11.2% decrease in cortical R2*. In normal-size kidneys downstream of high-grade renal arterial stenoses, R2* was elevated at baseline, but fell after furosemide. In contrast, atrophic kidneys beyond totally occluded renal arteries demonstrated low levels of R2* that did not change after furosemide. In kidneys with multiple arteries, localized renal artery stenoses produced focal elevations of R2*, suggesting areas of deoxyhemoglobin accumulation. These results suggest that BOLD MR coupled with a method to suppress tubular oxygen consumption can be used to evaluate regional tissue oxygenation in the human kidney affected by vascular occlusive disease.
Determining the relationships between arterial blood flow to the kidneys and tissue oxygenation poses a major challenge. This arises partly from the fact that kidney blood flow is related to its filtration function and usually far exceeds that needed to provide oxygen for energy requirements. High-grade occlusive disease of the main renal arteries (more than 60 to 80% lumen occlusion) can raise systemic arterial pressures by reducing perfusion pressure enough to activate multiple pathways, including the renin-angiotensin system and adrenergic sympathetic outflow.1 Remarkably, this sequence can occur without sufficient reduction in blood flow to lower renal venous oxygen tension or activate erythropoietin release.2,3 At some point, vascular occlusion threatens the viability of the kidney and can lead to loss of kidney function, sometimes reversible with revascularization.4 Eventually, occlusive disease leads to tissue fibrosis that becomes irreversible and can lead to end-stage kidney disease, which some authors designate “ischemic nephropathy.”5–7
Whether the sequence of events leading to fibrosis and kidney injury actually entails reduced oxygenation and regional tissue ischemia in humans is not yet known. Some authors estimate that basal oxygen requirements are met with less than 10% of blood flow.8 Important differences in tissue oxygen requirements and delivery exist within regions of the kidney, leaving some areas vulnerable to reduced flow. Inner medullary regions appear to function near the lower limits of adequate oxygenation, whereas the cortex may be more abundantly perfused.9,10
Much of the suprabasal oxygen consumption within the kidney is determined by energy-dependent tubular electrolyte transport. “Basal” oxygen consumption reflects the minimum oxygen requirement for tissue viability without active transport. “Suprabasal” oxygen consumption refers to the additional portion of kidney oxygen consumption dependent upon tubular transport, localized primarily to transport sites beyond the proximal tubule. A large fraction of active transport and oxygen consumption is localized to the thick ascending loop of Henle, where approximately 25% of sodium and chloride reabsorption occurs attributable to the 2Cl,Na,K cotransporter.11 Some estimate that nearly 60% of suprabasal oxygen consumption occurs in this section and can be inhibited by loop diuretics (e.g. furosemide). Distal segments account for smaller amounts of sodium reabsorption (approximately 5%).11–13
Investigation of regional oxygenation in the intact organism has been limited by the technical challenges of measuring oxygen tension in vivo. Recent studies using BOLD MR suggest that changes in tissue deoxyhemoglobin can be detected during maneuvers that change oxygen consumption. The premise of this technique is that the rate of spin relaxation after a magnetic pulse is altered by the quantity of paramagnetic material (specifically deoxyhemoglobin) in the region of interest. Oxygenated hemoglobin is diamagnetic and has no magnetic moment, whereas deoxygenated hemoglobin is paramagnetic and can affect the apparent spin-spin relaxation time (T2*) of adjacent water protons. This is expressed as the reciprocal of T2* and designated the apparent relaxation rate, or R2* (=1/T2*, /sec), which increases with increased amounts of deoxygenated hemoglobin. Measurement of R2* has been applied to evaluation of brain and muscle ischemia during circulatory insults.14,15 Local concentrations of deoxygenated hemoglobin reflect the equilibrium state of oxygenated species and therefore are a measure of local oxygen availability. Recent experimental studies indicate that changes in oxygen tension induced during water diuresis,16–18 experimental renovascular occlusion,19,20 and ureteral obstruction21 accurately reflect alterations in tissue oxygen tensions within regional circulations in the kidney.19–22 Whether this applies to human disease states has not yet been extensively studied, although recent reports demonstrate changes induced during exposure to various nephrotoxins23,24 and during kidney transplant allograft dysfunction from acute rejection or acute tubular necrosis.25
We undertook these studies to examine changes in BOLD MR signals in kidney cortex and medulla in 25 patients undergoing renal MR angiography for a variety of reasons, primarily to evaluate the presence of large vessel atherosclerotic occlusive disease. We sought to determine basal levels of R2* and the changes induced by inhibiting energy-dependent sodium and chloride tubular transport in the thick ascending limb of Henle's loop (furosemide-suppressible oxygen consumption, or FSOC) in medulla and cortex of human kidneys in patients with atherosclerotic renovascular disease. Our hypothesis was that impaired blood supply to the kidney would lead to alterations in measurable oxygen consumption detectable by BOLD MR.
Results
The clinical features of the 25 patients with 50 kidneys subjected to BOLD MR study are summarized in Table 1. Fourteen of these subjects were women. The ages ranged between 31 and 85 yr, with a mean serum creatinine level of 1.7 mg/dl. On the basis of the abbreviated MDRD equation, the estimated GFR (eGFR) for these individuals was 43 ml/min/1.73m2, consistent with stage 3 chronic kidney disease (CKD). Of the kidneys studied, 29 were considered to have “high-grade” stenosis exceeding 60%, whereas 21 kidneys had no main renal artery lesion identified. Even for subjects with “normal” appearing poststenotic kidneys, on the basis of a normal nephrogram the mean estimated two-kidney GFR was 43 ml/min/1.73 m2.
Table 1.
Demographic and clinical features in 25 subjects (50 kidneys) undergoing blood oxygen-level-dependent (BOLD) magnetic resonance (MR)
| “Normal” Kidneys | “Abnormal” Kidneys | Entire Group | |
|---|---|---|---|
| n | 21 | 29 | 50 |
| Men/women | 9/12 | 13/16 | 22/28 |
| Age (yr) | 69.1 ± 2.9 | 68.8 ± 2.2 | 69 ± 1.8 ± 12.5 |
| Creatinine (mg/dl) | 1.48 ± 0.15 | 1.87 ± 0.15 | 1.71 ± 0.11 |
| Renal artery stenosis > 70% | 10 | 19 | 29 |
| Estimated GFR (total) ml/min/1.73 m2 | 49 ± 3.4 | 38.3 ± 3.4** | 43 ± 2.5 |
| BOLD MR | |||
| Cortex-basal R2* | 22.2 ± 2.8 | 16.7 ± 12.8** | 19.0 ± 14 |
| Post-furosemide R2* | 19.1 ± 2.3 | 17.3 ± 1.7 | 18.1 ± 1.4 |
| Delta R2* (%) | 30.9 ± 9 (11.3 ± 3.1%) | −6 ± 6 (−1.3 ± 2.4%)* | 9.6 ± 5 (3.9 ± 2.1%) |
| Medulla-basal R2* | 24.9 ± 3.8 | 16.9 ± 1.3** | 20.3 ± 1.8 |
| Post-furosemide | 19.9 ± 3.2 | 17.3 ± 1.7 | 18.4 ± 1.7 |
| Delta R2* (%) | 49.5 ± 9 (20.3 ± 2.4%) | −3.6 ± 6 (0.2 ± 3.4%)* | 18.7 ± 6 |
P < 0.05,
P < 0.01 versus “normal” kidneys.
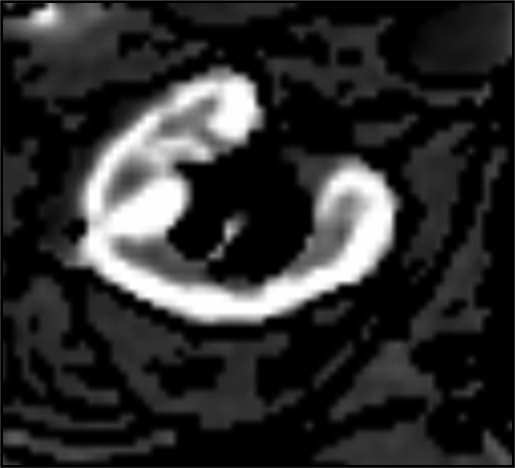
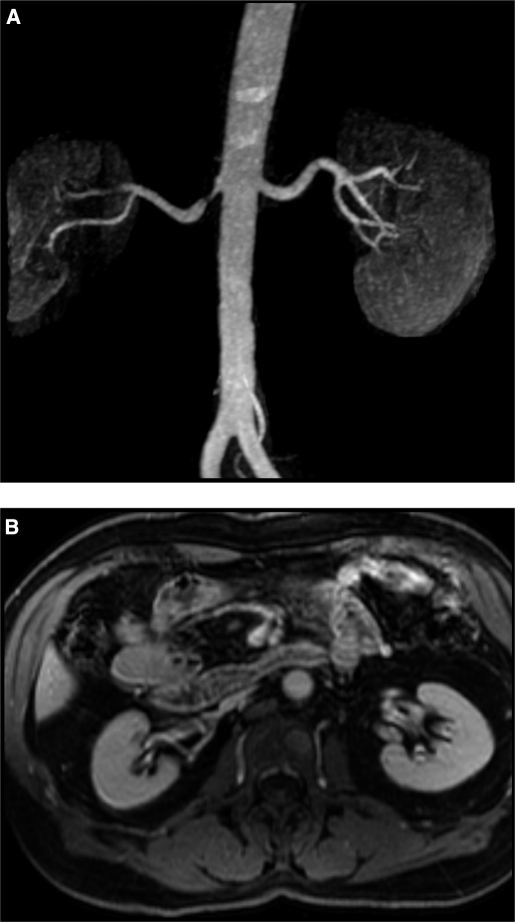
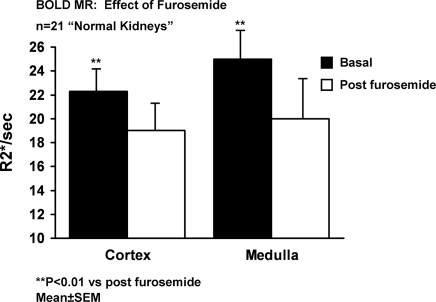
Cortical and medullary regions of interest (ROI) were identified from BOLD images (using the echo times (TE) yielding optimal cortical-medullary differentiation) and copied to corresponding parametric image of T2 as illustrated in Figure 1. Shown in Figure 2, A and B are examples of normal appearing kidneys by MR with normal size (left kidney). BOLD values for R2* before and after furosemide administration for normal appearing kidneys are summarized in Figure 3. Although mean values for medullary R2* were higher than in cortex, these values had wide dispersion and were not statistically different. R2* fell after furosemide in both cortex (22.3 ± 0.3 to 19.2 ± 0.2, P < 0.01) and medulla (25.0 ± 0.4 to 20.0 ± 0.3, P < 0.001). The R2* response after furosemide administration was greater in medulla as compared with cortex (−20 ± 2% versus −11.2 ± 2%, P < 0.05).
Figure 1.
Parametric BOLD (blood oxygen-level-dependent) image of the left kidney. The image represents a map of T2 values calculated from fitting voxel signal intensities from each echo time (TE) value of the multiecho gradient echo sequence to an exponential function. The bright intensity in the cortex defines a region of interest as contrasted to darker medullary segments.
Figure 2.
Magnetic resonance (MR) angiogram (A) demonstrating focal stenosis of the proximal right renal artery. Despite the stenosis and poststenotic dilation, filtration and kidney volume (B) were preserved in this kidney. This is an example of a “normal” appearing kidney beyond a stenotic lesion (see text). The left kidney in this patient was considered a “normal” kidney.
Figure 3.
BOLD MR measurements (R2*, s−1) in cortex and medullary segments in 21 “normal” appearing kidneys before and after intravenous furosemide. Relative reduction in cortical segments (11.2 ± 2%) was less than that observed in medullary regions (20 ± 2%) (P < 0.05). Enhanced reductions in R2* after furosemide in medullary segments is consistent with relatively greater accumulation of deoxyhemoglobin related to oxygen consumption due to chloride and sodium transport in the thick ascending limb of Henle (see text).
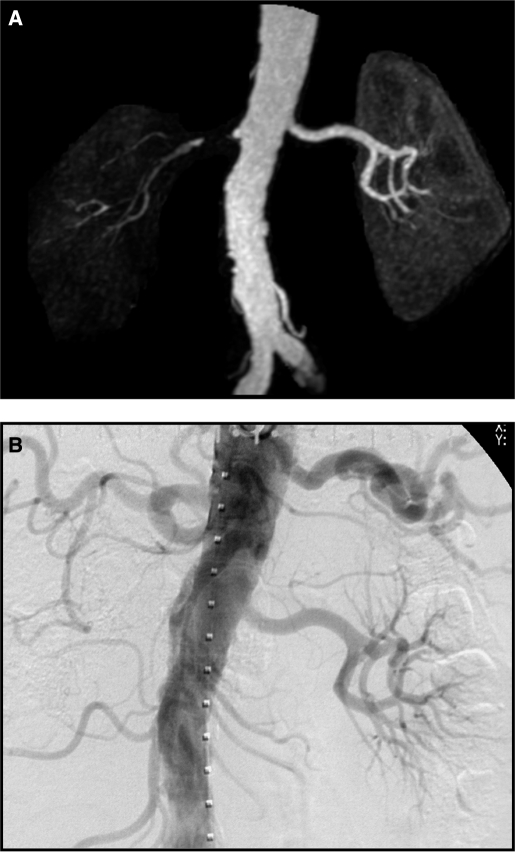
Results observed with kidneys that were considered to have reduced function and/or loss of cortical volume were considered to be “abnormal” and are summarized in Table 1. Levels of R2* were lower for both cortex (16.7 ± 1.2 versus normal 22.3 ± 0.3 s, P < 0.05) and medulla (16.9 ± 1.3 versus 25.0 ± 3.8 s, P < 0.03) as compared with normal kidneys. Furosemide administration produced no measurable changes in either cortical (16.7 ± 1.3 to 17.3 ± 1.6 s, NS) or medullary R2* (16.9 ± 1.3 to 17.3 ± 1.7 s, NS) levels. Nine of these kidneys were from subjects with atherosclerotic renal artery lesions and were judged to be “nonviable” on the basis of total arterial occlusion and/or absent early or late contrast enhancement as summarized in Table 2. An example of total occlusion and nonfunction is illustrated in Figure 4, A and B.
Table 2.
“Nonviable” kidneys in subjects with renal artery stenosis (RAS, see text)
| Age (yr) | Side | Creatinine mg/dl | Description | |
|---|---|---|---|---|
| 1 | 69 | Left | 1.8 | Absent, nephrogram, RAS |
| 2 | 73 | Left | 3.4 | Occluded vessel, RAS |
| 3 | 83 | Left | 1.7 | Atrophic RAS |
| 4 | 84 | Right | 1.7 | Atrophic, occlusion nonfunction |
| 5 | 80 | Right | 2.0 | Atrophic, nonfunction |
| 6 | 65 | Right | 1.0 | Atrophic, congenital, nonfunction on isotope renogram |
| 7 | 74 | Right | 2.9 | Parenchymal disease, RAS |
| 8 | 74 | Left | 2.9 | Parenchymal disease, RAS |
| 9 | 55 | Right | 1.9 | RAS occlusion |
| mean ± SEM | 72 ± 3 | 2.2 ± 0.2 |
Figure 4.
MR angiogram (A) demonstrating near total occlusion to the right kidney with minimal filtration. Conventional intra-arterial contrast angiography (B) (one week later) confirmed total occlusion and nonfunction of this kidney. This is an example of “nonviable” kidney as summarized in Table 2.
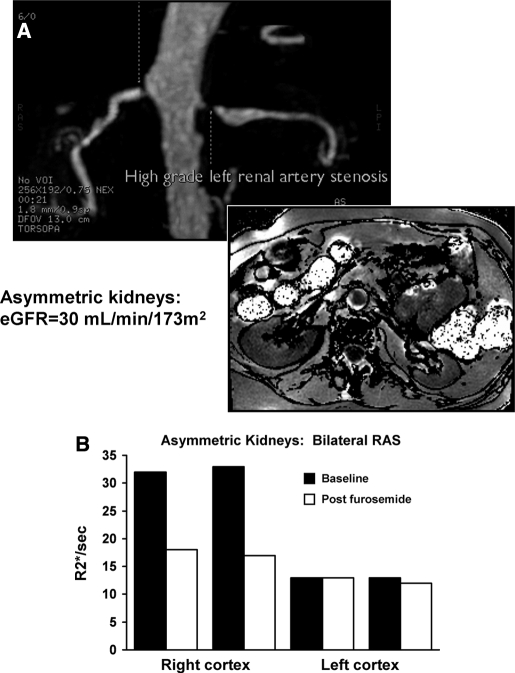
BOLD MR measurements obtained from ten normal sized kidneys located beyond high-grade renal artery lesions had R2* values in both cortex and medulla that were not different from normal kidneys without a vascular lesion. The nine atrophic kidneys with total occlusion again had low levels of R2* (cortex 17.6 ± 2.2 and medulla 17.8 ± 2.5 R2*/s) and demonstrated no evident change after administration of furosemide. When viable and nonviable kidneys were present in the same individual, these differences were readily apparent as illustrated in Figure 5, A and B. Despite high-grade occlusive disease, many poststenotic kidneys had elevated levels of R2* (as compared with the contralateral kidney) that fell substantially after administration of furosemide as illustrated in Figure 5. Absolute changes observed in cortical and medullary R2* values after furosemide in all ten individuals with “normal” parenchymal enhancement and RAS as compared with nine individuals with RAS and “nonviable” kidneys are summarized in Figure 6.
Figure 5.
MR angiogram in a patient with bilateral renal arterial stenosis (A), more severe on the left, on the basis of poststenotic dilation and reduced parenchymal volume. BOLD imaging demonstrated low levels of R2* both before and after furosemide (B). The right kidney had normal volume with higher baseline R2* with a large fall in R2* after administration of furosemide. These data suggest higher deoxyhemoglobin levels in the right kidney with exaggerated furosemide-suppressible oxygen consumption.
Figure 6.
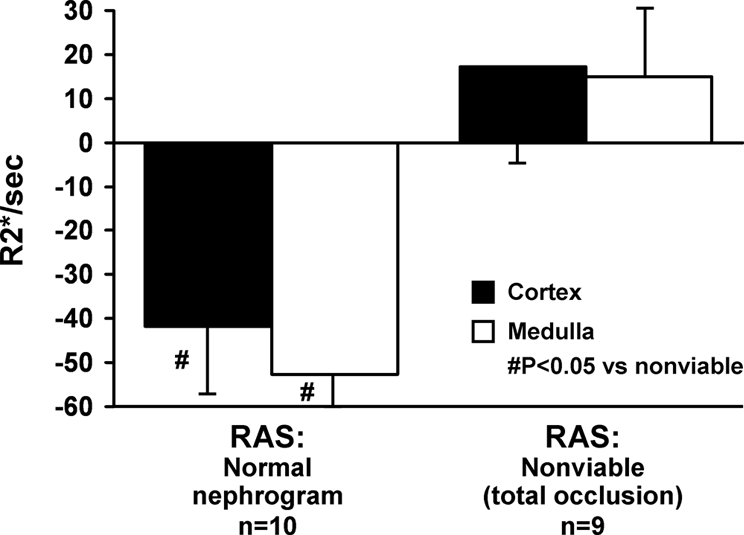
Changes in BOLD MR measurements (Delta R2*/s) before and after furosemide (FSOC, furosemide-suppressible oxygen consumption) in patients with atherosclerotic renal artery stenosis (RAS) with “normal” kidneys as compared with “nonviable” kidneys with total occlusion (Table 2). Nonfunctioning kidneys demonstrated no R2* response after intravenous furosemide, whereas poststenotic kidneys otherwise had consistent falls in R2* after furosemide, particularly in medullary regions.
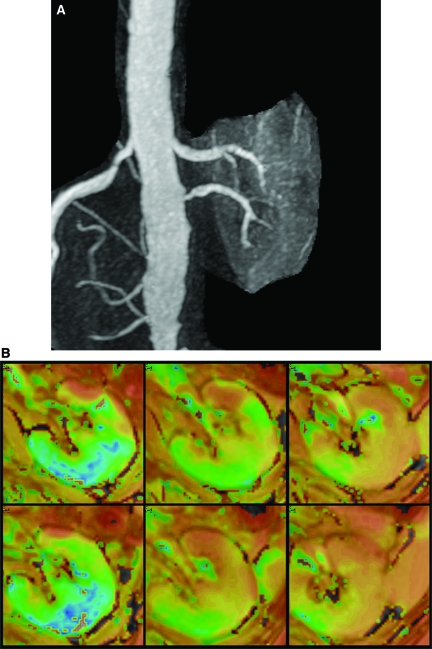
In some patients, multiple vessels were observed to a single kidney, only one of which was affected by a high-grade stenosis. An example of such a case with a localized area of increased R2* adjacent to an area with lower R2* is illustrated in Figure 7, A and B.
Figure 7.
(A) Gadolinium-enhanced MR angiogram demonstrating a left kidney supplied by two renal arteries, one of which (inferior) has a high grade stenosis. (B) Parametric map of T2* (1/R2*) in the left kidney supplied by two renal arteries, one of which has high-grade stenosis. Top row are prefurosemide images from the upper pole, mid pole, and lower pole regions, respectively, and bottom row images are after furosemide administration. T2* intensity differs between regions supplied by stenotic and nonstenotic renal arteries.
Discussion
Our results present for the first time application of BOLD MR to human subjects with vascular compromise from atherosclerotic renal arterial disease. Our results indicate that basal levels of R2*, reflecting different levels of deoxygenated hemoglobin, oxygen saturation, and tissue volume, varied widely between individuals over a wide range of basal kidney function. Administration of intravenous furosemide in subjects with functional kidneys induced a rapid fall in R2* in both cortex and medulla, consistent with a fall in deoxyhemoglobin levels. We interpret these observations to demonstrate FSOC related to inhibition of tubular sodium chloride transport in the thick ascending loop of Henle, as others have described.9,11,13 The overall fall in R2* in medullary regions was approximately twice that observed in the cortical regions, consistent with the medullary location of vascular supply to thick ascending limbs of Henle's loops and solute transport-related energy consumption under these conditions. For patients with kidneys affected by high-grade RAS but with preserved kidney volume and enhancement, R2* was elevated and fell after intravenous furosemide as illustrated in Figure 5. These observations suggest that these poststenotic kidneys had active sodium reabsorption and relatively high levels of deoxyhemoglobin that fell after inhibition of electrolyte transport activity in the thick ascending limb.26
By contrast, kidneys with total arterial occlusion and evident renal atrophy had reduced levels of both R2* and minimal change after intravenous furosemide administration. We interpret these observations to indicate that nonfunctioning kidneys were associated with less deoxyhemoglobin and therefore less exhaustion of oxygen availability. At first, these results may seem counterintuitive, because occluded blood flow might be associated with tissue ischemia. However, these results are consistent with observations of reduction in both cortical and medullary R2* signals in kidney allografts with acute dysfunction due either to cellular rejection or acute tubular necrosis.25 Rejection episodes are characterized by tubulointerstitial inflammatory changes with associated impairment of tubular transport. Similar results were observed in our patients with more advanced CKD (serum creatinine >2.0 mg/dl), but preserved blood flow to the kidneys on the basis of the MR angiogram and post-MR angiogram images. We suggest that all of these data reflect oxygen availability in nonfiltering and nonreabsorbing kidneys.
Basal levels of R2* in our patients varied widely, but were generally higher in medulla than in cortex. The range of observed values are near those reported in patients without vascular disease, but the values were not uniform between patients. R2* values were generally similar within an individual subject sampled at different areas of cortex unless major differences in blood supply were noted, as illustrated in Figure 7. These observations are supported by studies in normal volunteers that confirm higher medullary R2* levels than in cortex, an effect magnified by age.23,27 The reproducibility of repeated measurements within an individual is in the range of 3 to 4%. Recent studies using higher magnetic fields (3 Tesla) indicate less variability in the presence of more powerful magnetic field strength.16,28 It is likely that magnetic relaxation parameters are affected by tissue density, changes in blood flow,29 hemoglobin levels (and therefore anemia), and the specific regions chosen for sampling, among others. The sensitivity of regional oxygenation within the kidney to specific maneuvers such as water diuresis depends upon age.30 Studies of BOLD MR during changes in oxygen tension in murine tumors emphasize these wide variations in tissue with widely heterogeneous erythrocyte distribution and flux.31 For that reason, it seemed likely that changes in R2* observed before and after a maneuver intended to alter oxygen consumption, such as furosemide administration, could provide more consistent information related to physiology within an individual subject than absolute levels of R2* alone. This strategy has previously been applied similarly during studies of acute changes in water homeostasis and nonsteroidal administration in human subjects.16
Our results were remarkable for demonstrating large changes in R2* after furosemide within the kidney cortex even in subjects with reduced GFR beyond a high-grade stenosis. There often was asymmetry between kidneys within individual subjects (illustrated in Figure 5B). We interpret these observations to suggest that high levels of deoxyhemoglobin with a preserved response to furosemide can be identified even for kidneys with reduced glomerular filtration beyond a stenotic lesion. Our results are supported by reports of preserved cortical tissue volume in poststenotic kidneys, despite reduced function as measured by isotope renography.32 The authors of that study suggest that GFR might be recoverable for such cases and that nonfiltering kidney tissue represents a form of “hibernation” in the kidney with the potential for restored kidney function after restoring blood flow.32 The premise that elevated R2* and responses to furosemide represent highly active solute reabsorption is supported by previous studies of “split” kidney function using ureteral cannulation to examine fractional sodium excretion in kidneys beyond stenotic lesions. Results of those studies indicate that reduction in delivered sodium in the urine confirms a hemodynamically significant renal arterial lesion to a functioning kidney that could respond favorably to renal revascularization.4,33 Whether studies with BOLD MR will provide insight into the “salvageability” of poststenotic kidneys cannot be determined from the data presented here but merits further study. Recent concerns regarding the potential for gadolinium-based MR contrast to induce tissue sclerosis (“nephrogenic systemic fibrosis”)34 may limit the use of contrast-enhanced MR angiography alone for imaging the renal vasculature in subjects with severely reduced GFR. Alternative methods without contrast, such as BOLD MRI, may provide important alternative techniques for investigating vascular compromise and renal functional status.
These studies have limitations inherent to clinical studies in humans. Does BOLD MR provide direct measurement of tissue oxygenation within the kidney? Studies using an oxygen electrode in experimental short-term experimental ureteral obstruction and acute renal arterial occlusion demonstrate a close relationship between changes in R2* and changes in tissue oxygen levels.19,21 Whether these changes persist over time and are related to true “ischemia” in human subjects cannot be addressed with the data presented here. Whether changes in deoxyhemoglobin predict activation of oxidative stress injury within the kidney is not known and is an important area for future study. It is possible that reduced furosemide response within solute transporting segments may reflect either (1) loss of functioning tubular transport mechanisms (as observed with irreversible parenchymal injury) or (2) absent requirement for solute transport, e.g. sodium surfeit states. An important additional consideration in subjects with arterial occlusion or advanced CKD is the limited ability for intravenous furosemide to be transported into the tubular lumen to achieve maximal activity. These considerations make interpretation of a limited change in R2* after furosemide open to several explanations. Nonetheless, detection of a large change in R2* after furosemide implies relatively preserved blood flow and metabolic oxygen consumption related to chloride and sodium transport.
These studies represent an initial examination of BOLD MR as a rapid, noninvasive, and functional measurement to examine tissue deoxyhemoglobin and oxygen availability within regions of the poststenotic kidney in humans. Taken together, our results provide support for further studies to examine changes in BOLD MR to activation of pathways related to reduced tissue oxygenation, including activation of the renin-angiotensin system, “oxidative stress,” and fibrogenic cytokines that may lead to irreversible tissue injury.
Concise Methods
These studies were performed in 25 patients referred for MR angiography for clinical reasons, usually to exclude underlying atherosclerotic renal arterial disease as a contributing factor to kidney dysfunction. Before renal MR imaging and gadolinium-enhanced MR angiography, BOLD imaging was performed at 1.5 Tesla field strength to measure R2* levels in medullary and cortical regions of the kidney using customized abdominal organ protocols as described previously.19 The records and clinical features of these subjects were reviewed with approval from the Mayo Institutional Review Boards.
MR imaging examinations were performed on GE Twin Speed EXCITE 1.5T systems. Three-plane, single-shot, fast-spin echo localizers were performed during suspended respiration followed by additional scout images (single-shot fast-spin echo) oriented parallel to the long axis of each kidney. These long axis scout images were then used to prescribe transverse BOLD images in a plane orthogonal to the long axis.
BOLD imaging consisted of a two dimensional fast spoiled gradient echo sequence with multiple TE. Eight echoes were obtained for each slice location, with TE ranging from 2.5 to 30 ms. Imaging parameters for the BOLD acquisition included: TR 140 ms, flip angle 45 degrees, slice thickness 10 mm, imaging matrix 224 × 160 to 192, field of view (FOV) 32 to 40 cm, with 0.7 to 1.0 partial-phase FOV (PFOV). Image matrix and repetition time (TR) were adjusted in patients with limited breath hold capacity, and the FOV and PFOV adjusted according to patient size. BOLD images were acquired during suspended respiration, typically with three slices through the upper pole, mid pole, and lower pole of one kidney obtained during a 20-s acquisition. Parametric images of R2* were then generated by fitting signal intensity versus TE data to an exponential function on a voxel-by-voxel basis.
After the initial BOLD acquisition, furosemide (20 mg) was administered intravenously and flushed with 20 ml of saline. The BOLD measurements were repeated 15 min later. Subsequently perfusion images were obtained matching the slice location of the BOLD acquisitions. Five milliliters of gadolinium contrast [gadodiamide (Omniscan, GE Healthcare)] were injected intravenously at 3 to 4 ml/s using an MR-compatible automatic injector (Spectris Solaris, Medrad, Inianola, Pennsylvania), and images were acquired for approximately 30 s, with a temporal resolution of 2 s. The perfusion sequence consisted of a two-dimensional spoiled gradient echo sequentially acquired acquisition with 10-mm slice thickness, 128 × 128 imaging matrix, and FOV of 32 to 40 cm.
Three dimensional contrast-enhanced MRA of the abdominal aorta and renal arteries was then performed, with imaging parameters including: TR/TE 3.4/1.2 ms, flip angle 35, bandwidth 83 kHz, FOV 26 to 28 cm, PFOV 0.75, imaging matrix 256 × 224 reconstructed to 512 × 512, and section thickness 1.6 mm. Gadodiamide (0.1 mM/kg) was injected at 3 ml/s, and acquisition of the MR angiography sequence coordinated with arrival of the contrast bolus in the abdominal aorta and renal arteries.
Cortical and medullary R2* values were determined by tracing cortical and medullary ROI on BOLD images (the image with a TE yielding optimal cortical-medullary differentiation was selected; Figure 1) and then copying the ROI to the corresponding parametric image of R2*. ROI for a given image included areas of cortex or medulla not obscured by artifact. In some patients, BOLD images did not provide clear differentiation of cortical-medullary regions. In these patients, perfusion images with cortical but not medullary enhancement were then used to trace ROI, which again were copied and pasted onto the BOLD parametric images. This sequence also served as the test bolus for contrast-enhanced renal MR angiography, allowing selection of the optimal scan delay to ensure peak arterial contrast.
Parametric R2* images were generated with software developed by GE Healthcare, which fits the signal intensity data from each echo of the BOLD images on a voxel-by-voxel basis to an exponential function describing the expected signal decay as a function of TE and solves for the unknown value of R2*. For data analysis, ROI were traced in the cortex and medulla manually, on the 7-msec TE image or any other image yielding optimal contrast between cortex and medulla, and then copied to the parametric R2* image to determine average values of R2* within the ROI. For each BOLD image, values were determined for R2* within the cortex and medulla for each kidney. Additional values were determined for each ROI after furosemide. The change in R2* from prefurosemide to postfurosemide was determined as “Delta-R2*.”
Clinical features were recorded for each subject including age, serum creatinine, height, weight, sex, eGFR (by abbreviated MDRD equation), and additional imaging information when available. All but two subjects were taking an angiotensin converting enzyme inhibitor or angiotensin receptor blocker. Loop diuretics had been withheld. Kidneys with RAS were identified by contrast-enhanced MR angiography on the basis of luminal artery narrowing. The degree of stenosis was estimated as above 60% on the basis of the presence of poststenotic dilation or ultrasound velocities above 200 cm/s.35 RAS with “preserved” function was assigned to kidneys with immediate enhancement, as seen on either perfusion or MRA images and late enhancement of post-MRA images that was not different from normally filtering kidneys without RAS (Figure 2, A and B). Kidneys with RAS were considered “nonviable” if total occlusion was present or severe loss of kidney size (<7-cm length) was identified without an evident nephrogram.
Statistical Methods
Summary data for each variable are expressed as the mean ± SEM. Comparisons between medullary and cortical regions for each kidney were made by paired comparisons using t test. Differences between groups were determined by ANOVA. Regression analysis was performed using JMP statistical software.36
Disclosures
None.
Acknowledgments
This work was supported in part by NIH HL 16496 and 1PO 1HL085307-01A1.
Published online ahead of print. Publication date available at www.jasn.org.
References
- 1.Garovic V, Textor SC: Renovascular hypertension and ischemic nephropathy. Circulation 112: 1362–1374, 2005 [DOI] [PubMed] [Google Scholar]
- 2.Nielsen K, Rehling M, Henriksen JH: Renal vein oxygen saturation in renal artery stenosis. Clin Physiol 12: 179–184, 1992 [DOI] [PubMed] [Google Scholar]
- 3.Textor SC, Lerman LO: Renal artery disease: Pathophysiology. In: Vascular Medicine: A Companion to Braunwald's Heart Disease, edited by Creager MA, Dzau VJ, Loscalzo J, Philadelphia, Saunders-Elsevier, 2006, pp 323–334
- 4.Pohl MA: Renal artery stenosis, renal vascular hypertension and ischemic nephropathy. In: Diseases of the Kidney, Sixth Ed., edited by Schrier RW, Gottschalk CW, Boston, Little, Brown and Company, 1997, pp 1367–1423
- 5.Alcazar JM, Rodicio JL: Ischemic Nephropathy: Clinical characteristics and treatment. Am J Kidney Dis 36: 883–893, 2000 [DOI] [PubMed] [Google Scholar]
- 6.Coen G, Manni M, Giannoni MF, Calabria S, Mantella D, Pigorini F, Taggi F: Ischemic nephropathy in an elderly nephrologic and hypertensive population. Am J Nephrol 18: 221–227, 1998 [DOI] [PubMed] [Google Scholar]
- 7.Jacobson HR: Ischemic renal disease: An overlooked clinical entity. Kidney International 34: 729–743, 1988 [DOI] [PubMed] [Google Scholar]
- 8.Barger AC, Herd JA: Renal vascular anatomy and distribution of blood flow. In: Handbook of Physiology, edited by Orloff J, Berliner RW, Washington, D.C., American Physiological Society, 1973, pp 249–314
- 9.Epstein FH: Oxygen and renal metabolism. Kidney Int 51: 381–385, 1997 [DOI] [PubMed] [Google Scholar]
- 10.Thurau K: Renal Na+ and O2 uptake in dogs during hypoxia and hydrochlorothiazide infusion. Proc Soc Exp Biol Med 106: 714–717, 1961 [DOI] [PubMed] [Google Scholar]
- 11.Brezis ML, Heyman SN, Epstein FH: Determinants of intrarenal oxygenation: 1. Effects of diuretics. Am J Physiol 267: F1059–F1062, 1994 [DOI] [PubMed] [Google Scholar]
- 12.Dirks JH, Cirksena WJ, Berliner RW: The effects of saline infusion on sodium reabsoprtion by the proximal tubule of the dog. J Clin Invest 44: 1160–1170, 1965 [DOI] [PMC free article] [PubMed] [Google Scholar]
- 13.Deetjen P, Kramer K: The relation of O2 consumption by the kidney to Na re-resorption. Pflugers Arch 273: 636–650, 1961 [PubMed] [Google Scholar]
- 14.Ogawa S, Lee TM, Kay AR, Tank DW: Brain magnetic resonance imaging with contrast dependent on blood oxygenation. Proc Natl Acad Sci U S A 87: 9868–9872, 1997 [DOI] [PMC free article] [PubMed] [Google Scholar]
- 15.Ledermann HP, Schulte AC, Heidecker HG, Aschwanden M, Jaeger KA, Scheffler K, Steinbrich W, Bilecen D: Blood oxygenation level-dependent magnetic resonance imaging of the skeletal muscle in patients with peripheral arterial occlusive disease. Circulation 113: 2929–2935, 2006 [DOI] [PubMed] [Google Scholar]
- 16.Li LP, Storey P, Pierchala L, Li W, Polzin J, Prasad P: Evaluation of the reproducibility of intrarenal R2* and DeltaR2* measurements following administration of furosemide and during waterload. J Magnet Res Imag 19: 610–616, 2004 [DOI] [PMC free article] [PubMed] [Google Scholar]
- 17.Zuo CS, Rofsky NM, Mahallati H, Yu J, Zhang M, Gilbert S, Epstein FH: Visualization and quantification of renal R2* changes during water diuresis. J Magn Reson Imaging 17: 676–682, 2003 [DOI] [PubMed] [Google Scholar]
- 18.Prasad PV, Edelman RR, Epstein FH: Non-invasive evaluation of intrarenal oxygenation with BOLD MRI. Circulation 94: 3271–3275, 1996 [DOI] [PubMed] [Google Scholar]
- 19.Juillard L, Lerman LO, Kruger DG, Haas JA, Rucker BC, Polzin JA, Riederer SJ, Romero JC: Blood oxygen level-dependent measurement of acute intra-renal ischemia. Kidney Int 65: 944–950, 2004 [DOI] [PubMed] [Google Scholar]
- 20.Alford SK, Sadowski EA, Unal O, Polzin JA, Consigny DW, Korosec FR, Grist TM: Detection of acute renal ischemia in swine using blood oxygen level-dependent magnetic resonance imaging. J Magn Reson Imaging 22: 347–353, 2005 [DOI] [PubMed] [Google Scholar]
- 21.Pedersen M, Dissing TH, Morkenborg J, Stodkilde-Jorgensen H, Hansen LH, Pedersen LB, Grenier N, Frokiaer J: Validation of quantitative BOLD MRI measurements in the kidney: Application to unilateral ureteral obstruction. Kidney Int 67: 2305–2312, 2005 [DOI] [PubMed] [Google Scholar]
- 22.Li L, Storey P, Kim D, Li W, Prasad P: Kidneys in hypertensive rats show reduced response to nitric oxide synthase inhibition as evaluated by BOLD MRI. J Magn Reson Imaging 17: 671–675, 2003 [DOI] [PMC free article] [PubMed] [Google Scholar]
- 23.Tumkur SM, Vu AT, Li LP, Pierchala L, Prasad PV: Evaluation of intra-renal oxygenation during water diuresis: A time-resolved study using BOLD MRI. Kidney Int 70: 139–143, 2006 [DOI] [PMC free article] [PubMed] [Google Scholar]
- 24.Hofmann L, Simon-Zoula S, Nowak A, Giger A, Vock P, Boesch C, Frey FJ, Vogt B: BOLD-MRI for the assessment of renal oxygenation in humans: Acute effect of nephrotoxic xenobiotics. Kidney Int 70: 144–150, 2006 [DOI] [PubMed] [Google Scholar]
- 25.Djamali A, Sadowski EA, Samaniego-Picota M, Fain SB, Muehrer RJ, Alford SK, Grist TM, Becker BN: Noninvasive assessment of early kidney allograft dysfunction by blood oxygen level-dependent magnetic resonance imaging. Transplantation 82: 621–628, 2006 [DOI] [PubMed] [Google Scholar]
- 26.Kiil F, Aukland K, Refsum HE: Renal sodium transport and oxygen consumption. Am J Physiol 201: 511–516, 1961 [DOI] [PubMed] [Google Scholar]
- 27.Simon-Zoula SC, Hofmann L, Giger A, Vogt B, Vock P, Frey FJ, Boesch C: Non-invasive monitoring of renal oxygenation using BOLD-MRI: A reproducibility study. NMR in Biomed 19: 84–89, 2006 [DOI] [PubMed] [Google Scholar]
- 28.Li L, Vu AT, Li BSY, Dunkle E, Prasad PV: Evaluation of intrarenal oxygenation by BOLD MRI at 3.0 T. J Magn Reson Imaging 20: 901–904, 2004 [DOI] [PMC free article] [PubMed] [Google Scholar]
- 29.Schachinger H, Klarhofer M, Linder L, Dreve J, Scheffler K: Angiotensin II decreases the renal MRI blood oxygenation level-dependent signal. Hypertension 47: 1062–1066, 2006 [DOI] [PubMed] [Google Scholar]
- 30.Epstein FH, Prasad P: Effects of furosemide on medullar oxygenation in younger and older subjects. Kidney Int 57: 2080–2083, 2000 [DOI] [PubMed] [Google Scholar]
- 31.Baudelet C, Gallet B: How does blood oxygen level-dependent (BOLD) contrast correlate with oxygen partial pressure (pO2) inside tumors? Magn Reson Med 48: 980–986, 2002 [DOI] [PubMed] [Google Scholar]
- 32.Cheung CM, Shurrab AE, Buckley DL, Hegarty J, Middleton RJ, Mamtora H, Kalra PA: MR-derived renal morphology and renal function in patients with atherosclerotic renovascular disease. Kidney Int 69: 715–722, 2006 [DOI] [PubMed] [Google Scholar]
- 33.Stamey TA, Nudelman JJ, Good PH, Schwentker FN, Hendricks F: Functional characteristics of renovascular hypertension. Medicine 40: 347–394, 1961 [DOI] [PubMed] [Google Scholar]
- 34.Marckmann P, Skov L, Rossen K, Dupont A, Damholt MB, Heaf JG, Thomsen HS: Nephrogenic systemic fibrosis: Suspected causative role of gadodiamide used for contrast-enhanced magnetic resonance imaging. J Am Soc Nephrol 17: 2359–2362, 2006 [DOI] [PubMed] [Google Scholar]
- 35.Fisher JEE, Olin JW: Renal artery stenosis: clinical evaluation. In: Vascular Medicine: A Companion to Braunwald's Heart Disease, 1st Ed., edited by Creager MA, Loscalzo J, Philadelphia, Saunders-Elsevier, 2006, pp 335–347
- 36.Miller RG: Normal univariate techniques. In: Simultaneous Statistical Inference, 2 Ed., edited by Miller RG, New York, Springer-Verlag, 1981, pp 68–88


