Abstract
Dendritic cells in the kidney take up antigens, but little is known about their role in providing co-stimulatory signals for the activation of CD4+ cells. This study examined the phenotype of dendritic cells in the renal interstitium and in the lymph node draining the kidney before and after intrarenal ovalbumin injection. After intrarenal injection of the antigen, expression of the co-stimulatory molecules CD86 and programmed cell death ligand 1 (PD-L1) increased on renal dendritic cells, whereas expression of only CD86 increased on dendritic cells of the draining lymph node. The activation and proliferation of antigen-specific CD4+ cells in the lymph node were assessed by transfer of naïve, fluorescently labeled ovalbumin-specific T cell receptor transgenic cells to mice before antigen administration. Blocking both CD86 and CD80 profoundly inhibited CD4+ cell proliferation, but CD86 was the dominant CD28 ligand in the early proliferative response of CD4+ cells. Conversely, activation of PD-1, the receptor expressed on CD4+ cells that binds PD-L1 and PD-L2, reduced the proliferation of CD4+ cells in the draining lymph node. Comparing subcutaneous and intrarenal administration of antigen, it was found that CD4+ cell activation was slower and the effects of combined CD80 and CD86 blockade were more profound when antigen was presented via the kidney compared with the skin. In summary, renal dendritic cells take up antigen and participate in the control of antigen-specific CD4+ cell proliferation by upregulating co-stimulatory molecules such as CD86 that stimulate CD4+ cell proliferation and by signaling through PD-1, which prevents an inappropriately exuberant immune response.
Because CD4+ cells direct adaptive immune responses in infection, autoimmunity, and allogeneic responses they are relevant to renal infection, pathologic renal inflammation, and renal transplantation. CD4+ cells are activated in local draining lymph nodes (LN) after encounters with activated and licensed dendritic cells (DC) presenting relevant antigenic peptides. Licensed DC that have altered their phenotype in inflammation migrate from tissues to present antigen. T cells proliferate, acquire effector functions, and leave the LN several days after antigen is presented.1 Co-stimulatory signals are important for effective immune responses, providing the “second signal” for CD4+ cell activation. Co-stimulatory molecules provide positive or negative signals to enhance or inhibit the immune response. Antigen presentation in the absence of co-stimulatory signals results in anergy and is important in peripheral tolerance. DC co-stimulatory molecule expression is an integral part of DC maturation and largely defines their capacity to activate naïve T cells. The B7 family of co-stimulatory molecules includes the prototypic positive signals B7-1 (CD80) and B7-2 (CD86).2 Their ligands are CD28, which is constitutively expressed on CD4+ T cells and induces activation,3 and CTLA4 (CD152), which is expressed after T cell activation and limits T cell activation.4 The absence of signaling through CD28 impairs naïve CD4+ T cell activation.5
The immune receptor programmed cell death 1 (PD-1) and its ligands, PD-L1 and PD-L2, B7 family members, provide negative co-stimulatory signals. They limit immune responses to avoid an overexuberant response and may prevent the development of pathogenetic self-reactivity.2,6 PD-1–deficient mice have enhanced immune responses with autoimmunity,7,8 and evidence is accumulating that PD-1 and its ligands regulate immune responses in peripheral tissues.6 Information on the role of PD-1 in the early activation of CD4+ T cells is limited because PD-1 expression is delayed after CD4+ cell activation.9 Expression persists on the cell surface, suggesting involvement in a later phase of CD4+ T cell activation, including downregulation of activated T cells. Generally speaking, PD-L2 is expressed largely by DC, whereas PD-L1 may also be expressed by tissue cells.2,6,10
Despite their central role in the immune response, CD4+ cells specific for an individual antigen exist at low frequency, even in active immune responses. This low frequency of antigen-specific CD4+ cells makes the proliferation and behavior of antigen-specific CD4+ cells difficult to study in vivo. The development of T cell receptor (TcR) transgenic mice in which the majority of T cells express a single TcR allows study of how immune signals induce antigen-specific responses by in vivo assessment of relatively large numbers of antigen-specific cells.1,11 Because the skin is a primary site of entry of infectious threats and subcutaneous injection is simple, studies are performed by injecting antigen subcutaneously. The kidney, a solid internal organ, performs different functions compared with the skin. Whereas the tubulointerstitium may be exposed to foreign antigens via ascending infection, proteins processed by renal DC are more likely to be self-antigens or innocuous foreign antigens. Renal DC form a relatively extensive network in the tubulointerstitium12 but may not be as potent at inducing T cell proliferation as splenic DC.13,14
These studies sought to define the response of renal DC exposed to antigen in the kidney parenchyma. The timing of proliferation was compared with subcutaneous antigen injection, the expression of co-stimulatory molecules and capacity to present antigen and activate antigen-specific CD4+ T cells in the renal draining LN was assessed, and DC co-stimulatory molecules were inhibited for better definition of the mechanisms of immune recognition and antigen presentation in the kidney. A new model of antigen presentation in the renal node was established using direct intrarenal injection and in vivo assessment of transgenic ovalbumin (OVA)-specific CD4+ cells. Experiments on dermal presentation of the same antigen allowed comparison of antigen presentation in the kidney with skin DC.
RESULTS
Direct Intrarenal Antigen Injection
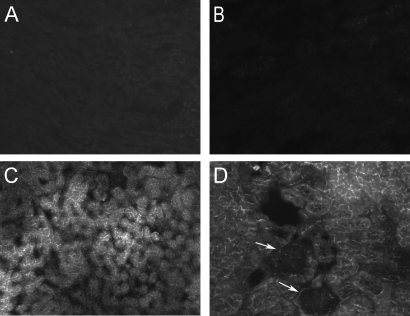
A method of injecting antigen into the kidney was established by injecting OVA (400 μg, 8 μl of PBS) into the cortical interstitium. For determination of the extent of infiltration, OVA-fluorescein (400 μg, 8 μl of PBS) was injected into two mice, and 18 h after injection, the degree of diffusion of OVA-fluorescein was observed (Figure 1). Negative controls did not exhibit fluorescence (Figure 1, A and B). In OVA-fluorescein–injected mice, fluorescence was observed throughout the tubulointerstitial compartment (Figure 1, C and D) in multiple sections, including cortex and medulla, but no fluorescence was observed in glomeruli (Figure 1D, arrows); therefore, direct intrarenal injection delivers antigen to the tubulointerstitial compartment.
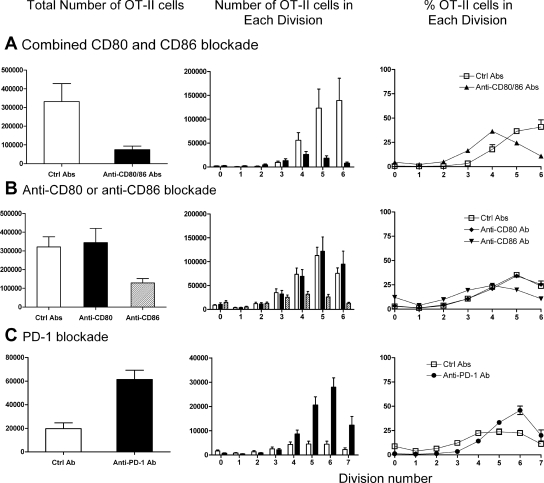
Figure 1.
Intrarenal antigen injection results in diffusion of antigen throughout the interstitium. Whereas fluorescence was not present in control mice (A and B), 18 h after direct injection of OVA-fluorescein into the kidney, fluorescence was observed throughout the tubulointerstitium (C and D), excluding large vessels and glomeruli (arrows, D). Magnifications: ×100 in A and C; ×200 in B and D.
Renal CD11c+ Cells Express Co-stimulatory Molecules at Rest and after Immune Activation
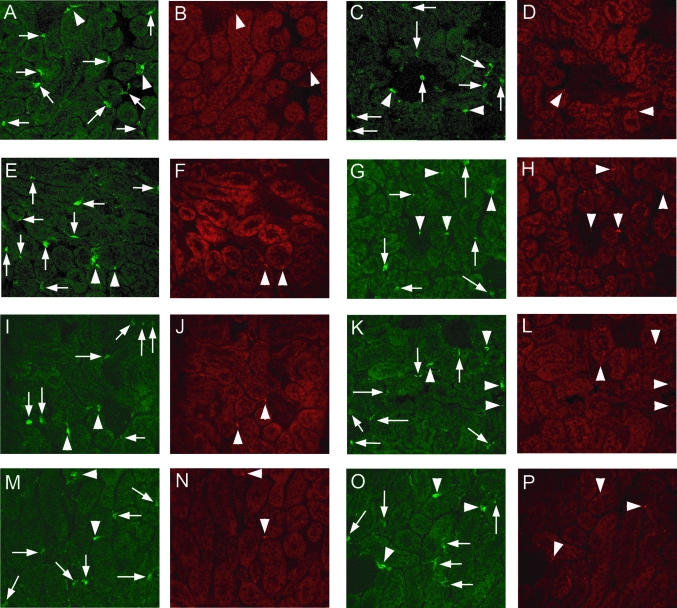
Within the unmanipulated kidney, 10 to 20% of DC constitutively expressed at least one of the B7 family molecules, CD80, CD86, PD-L1, or PD-L2 (Table 1). Only a small proportion of CD11c+ cells were positive for both CD80 and CD86. After intrarenal injection, the proportion of CD86+ cells and cells positive for both CD80+ and CD86+ increased, but intrarenal DC CD80 expression was not increased. Intrarenal DC expression of PD-L1 but not PD-L2 was increased. After OVA injection, a higher proportion of DC from the draining LN expressed CD86 (and possibly PD-L1). Confocal microscopy (Figure 2) revealed that DC were present predominantly in the interstitium, including within the interstitial space, around small and large vessels, and in periglomerular region. DC were only rarely seen in glomeruli. CD80+, CD86+, PD-L1+, or PD-L2+ DC were not confined to any particular interstitial or perivascular area.
Table 1.
Changes in co-stimulatory molecule expression on CD11c+ DC within the kidney and within the renal draining LN before and after intrarenal antigen injection, expressed as a percentage of CD11c+ cells
| Parameter | Kidney
|
Renal LN
|
||
|---|---|---|---|---|
| 0 h | 24 h | 0 h | Renal LN 24 h | |
| CD80 | 19.0 ± 2.0 | 28.0 ± 7.0 | 17.0 ± 2.0 | 22.0 ± 1.0 |
| CD86 | 10.0 ± 0.2 | 29.0 ± 5.0a | 31.0 ± 4.0 | 65.0 ± 4.0a |
| Both CD80 and CD86 | 3.0 ± 0.3 | 16.0 ± 5.0a | 13.0 ± 2.0 | 16.0 ± 1.0 |
| PD-L1 | 10.0 ± 1.0 | 29.0 ± 2.0a | 35.0b | 74.0 ± 3.0 |
| PD-L2 | 20.0 ± 1.0 | 28.0 ± 3.0 | 39.0b | 52.0 ± 3.0 |
P < 0.05.
Pooled renal LN samples.
Figure 2.
Confocal microscopic images of CD11c+ DC in the kidney (green fluorescence) and expression of co-stimulatory molecules (CD80, CD86, PD-L1, or PD-L2; red fluorescence) in normal mouse kidneys (A, B, E, F, I, J, M, and N) and in mice 24 h after intrarenal OVA injection with subcutaneous FCA (C, D, G, H, K, L, O, and P). Each pair of images represents a single section stained with both anti-CD11c (green) and an Ab against the relevant co-stimulatory molecule (red). Arrows represent CD11c+ DC that are not positive for the co-stimulatory molecule of interest; arrowheads denote DC that are positive for both CD11c and the relevant co-stimulatory molecule. In general, DC were found most commonly in the interstitium, at times perivascular or periglomerular, and only uncommonly in glomeruli. There was no distinct anatomic distribution for DC positive for any particular co-stimulatory molecule. (A through D) CD80+ DC, with no particular change between normal (A and B) and injected (C and D) kidneys. A CD11c+CD80− cell is visible in C, centrally within a glomerulus. (E through H) CD86+ DC, with some positive cells before injection (E and F) and an increased proportion of CD11c+ cells that are also CD86+ after OVA injection (G and H, including a double-positive cell within a glomerulus). (I through L) CD11c and PD-L1 staining, with some positive cells before injection (I and J) and an increased proportion of CD11c+ cells that are also PD-L1+ after OVA injection (K and L). (M through P) CD11c and PD-L2 staining, with no major changes in the proportion of CD11c+ cells that are also PD-L2+ between normal kidneys (M and N) and injected kidneys (O and P). Magnification, ×400.
Antigen-Specific CD4+ T Cells Proliferate in the Draining LN In response to Antigen Deposited Intrarenally
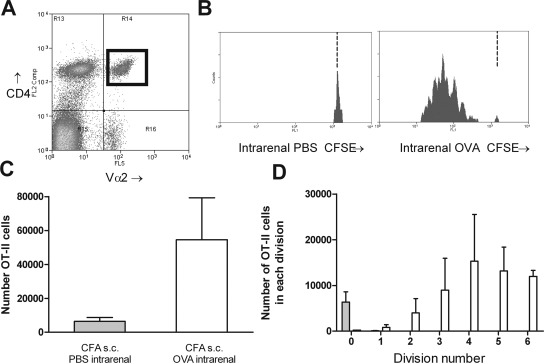
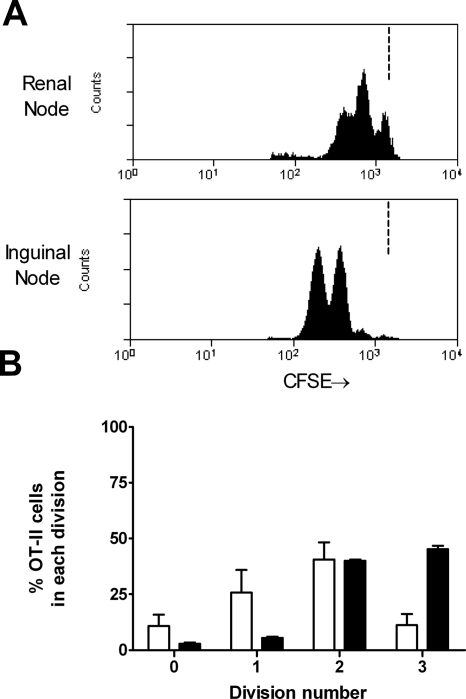
5,6-Carboxyfluoresceine-diacetate-succinimidyl-ester (CFSE)-labeled naïve OT-II cells were transferred into C57BL/6 mice. After transfer, naïve OT-II cells comprised an average of 0.4% of resting LN cells in unmanipulated transfer recipients (consistent with previous studies11). OVA was injected intrarenally 1 to 3 d after OT-II cells. Studies examining CD4+ cell responses after subcutaneously antigen have used complete Freund's adjuvant (CFA). Because CFA is too viscous to inject intrarenally, CFA was injected subcutaneously and OVA intrarenally. A population of CD4+ Vα2+ cells was identified in the renal draining LN (Figure 3A). From this population, CD4+ cell proliferation was measured by serial halving of fluorescence. Administration of subcutaneous CFA with intrarenal PBS did not result in proliferation (Figure 3, B through D). Proliferation 72 h after OVA injection was measurable and reproducible with most cells having undergone proliferation but only a minority to a point at which CFSE was below detection. For determination of whether antigen-specific CD4+ cell activation was slower when antigen was deposited intrarenally, antigen-specific CFSE-labeled OT-II cell proliferation was assessed after either intrarenal or subcutaneous antigen injection (using cells from the same preparation, with CFA injected subcutaneously at a distant site). OT-II cell proliferation after intrarenal antigen injection was delayed compared with the skin. Forty hours after intrarenal injection, draining LN CD4+ cell proliferation was less advanced (Figure 4), indicating that antigens delivered to the kidney induce slower CD4+ cell proliferation compared with subcutaneous delivery. In the absence of concurrent CFA, OT-II cells proliferated 3 d after intrarenal injection (see supplementary information online), but after 5 d, more activated OT-II cells were present in the renal draining LN of mice given subcutaneous CFA and intrarenal OVA; therefore, in most further studies, proliferation was assessed in the draining LN 72 h after concurrent subcutaneous CFA and intrarenal OVA.
Figure 3.
Intrarenal injection of OVA with subcutaneous CFA induces proliferation of naïve OT-II cells. A discrete population of CD4+Vα2+ cells was identifiable in recipients 72 h after OVA injection (A; CD4+Vα2+ cells marked by a black box in top right quadrant). This region allows identification of proliferating antigen-specific cells by CFSE fluorescence. The level of CFSE expression of these cells was assessed (B; illustrative single-parameter histograms). In mice injected with PBS intrarenally, CFSE+ cells were almost all expressing high levels of CFSE, indicating no proliferation. In OVA-injected mice, a series of peaks were identified indicating the serial halving of CFSE. The dotted vertical lines in B represent the degree of CFSE intensity of nonproliferating cells. CFSE− recipient cells (recipient CD4+Vα2+ cells, fluorescence intensity ≤11) were removed for clarity in Figures 3 through 6. After OVA injection, total numbers of OVA cells in the draining LN were increased (C), and the numbers in each division could be determined (D). □, Mice injected with OVA intrarenally, CFA subcutaneously; □, mice injected with PBS intrarenally, CFA subcutaneously.
Figure 4.
Comparison of early antigen-specific CD4+ cell proliferation when antigen is injected intrarenally (□) or subcutaneously (▪). The same preparation of CFSE-labeled OT-II cells was transferred into C57BL/6 mice, which were then injected with the same dosage of OVA either intrarenally or subcutaneously, both with CFA subcutaneously at a distant site. At 40 h, proliferation was less advanced in mice receiving antigen intrarenally (illustrative single-parameter histograms [A]; proportion of OT-II cells in each division [B]).
CD80/CD86-CD28 Interactions Are Required for Antigen-Specific CD4+ Cell Activation to Planted Renal Antigens
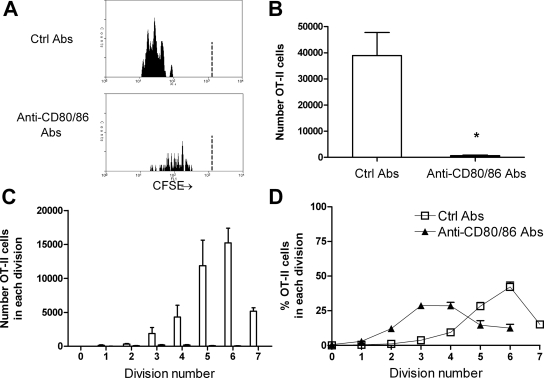
For determination of the requirement of CD80 and CD86 in antigen-specific CD4+ cell proliferation to an intrarenal antigen, both CD80 and CD86 were neutralized in vivo with mAb. Compared with control Ab–injected mice, total numbers of OT-II cells and the degree of antigen-specific CD4+ cell proliferation after intrarenal antigen injection were profoundly suppressed by neutralization of both CD80 and CD86 (Figure 5, A through C). After intrarenal OVA injection, in control Ab–treated mice, the number of cells that had divided five or six times was substantial, whereas numbers in combined anti-CD80 and anti-CD86 Ab–treated mice were negligible. Of those cells remaining in the absence of functional CD80 and CD86, the majority were in divisions 2 to 4 (Figure 5D), suggesting that CD80/CD86-CD28 interactions reduce the time taken for cells to enter division, as well as the numbers of cells entering each division.
Figure 5.
CD80 and CD86 interactions with CD28 induce antigen-specific CD4+ T cell proliferation in the renal draining node. Illustrative single-parameter histograms (A) show that 72 h after OVA, substantial proliferation of OT-II cells is seen in mice given control Ab, but proliferation is almost abrogated after functional inhibition of CD80 and CD86, demonstrated by total numbers of OT-II cells (B) and the numbers of cells in each division (C). In addition, of the few OT-II cells still present in anti-CD80–and anti-CD86–treated mice, the highest proportion were in divisions 3 and 4 (versus division 6 for control Ab–treated mice), suggesting a delay in the onset of rate of proliferation in the absence of CD80 and CD86 (D). The dotted vertical lines in the single-parameter histograms (A) represent the degree of CFSE intensity of nonproliferating cells. (B and C) □, Mice injected with control Ab; ▪, mice injected with anti-CD80 and CD86 Ab.
CD86 Plays a Dominant Role in Antigen-Specific CD4+ Cell Activation to Planted Renal Antigens
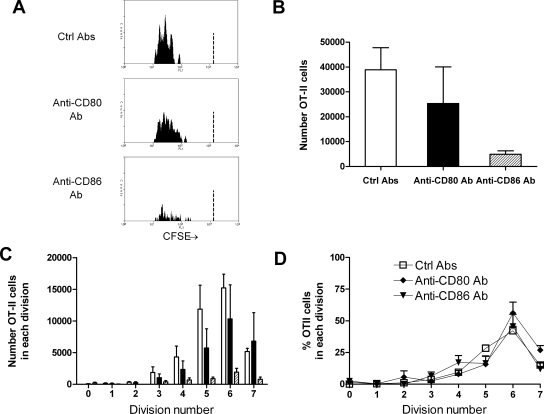
Inhibition of either CD80 or CD86 revealed a dominant role for CD86 in antigen-specific CD4+ cell activation and proliferation after intrarenal OVA (Figure 6). OT-II cell numbers were not reduced when CD80 signaling was inhibited. OT-II accumulation was reduced when CD86 signaling was inhibited, demonstrating that in response to intrarenal OVA, CD86 is more important than CD80 for OT-II cell activation. Of the cells present, similar proportions of cells were in each division in each experimental group.
Figure 6.
CD86 is the dominant CD28 ligand in early antigen-specific CD4+ cell proliferation in the renal draining LN. Illustrative single-parameter histograms (A) show that 72 h after intrarenal OVA injection, substantial proliferation of OT-II cells is seen in mice given control Ab. Proliferation is diminished after inhibition of CD86 but not CD80, quantified in the total numbers of OT-II cells (B) and the number of cells in each division (C). Compared with combined CD80 and CD86 neutralization, individual blockade of either CD80 or CD86 did not alter the proportion of OT-II cells in each division, suggesting that time to onset of proliferation is similar in all three groups (D). Experiments were conduced at the same time as simultaneous CD80 and CD86 blockade; the control Ab data are shown again in this figure for clarity. The dotted vertical lines in the single-parameter histograms (A) represent the degree of CFSE intensity of nonproliferating cells. (B and C) □, Mice injected with control Ab; ▪, mice injected with anti-CD80 Ab; ▒, mice injected with anti-CD86 Ab.
Interactions between PD-1 and Its Ligands Limit Early CD4+ Cell Activation
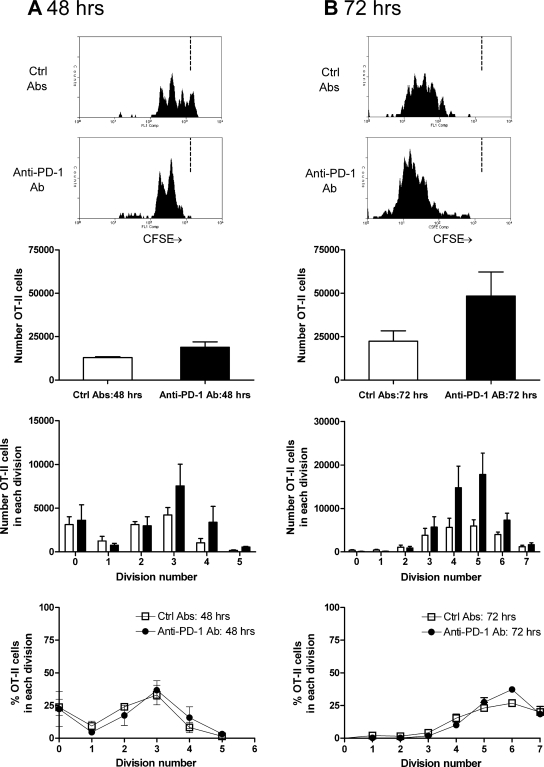
PD-1 signaling was inhibited during OT-II cell activation after intrarenal OVA. Blocking PD-1 was hypothesized to enhance OT-II cell activation; therefore, 48-h responses (Figure 7A) as well as 72-h responses (Figure 7B) were examined after intrarenal OVA injection. At 48 h, increased OT-II cell accumulation in the renal LN was seen, also observed at 72 h. At both time points, the proliferation profile was similar (peak of three divisions at 48 h and five at 72 h); therefore, PD-1 does not influence the time for antigen-specific CD4+ cells to become activated and undergo first division but may limit the survival of antigen-specific CD4+ cells once dividing. The proportion of IFN-γ–producing OT-II cells was assessed by intracellular cytokine staining. At 48 h, in OVA injected, control Ab–treated mice, 0.9% of OT-II cells from the renal LN produced IFN-γ, but in anti–PD-1–treated mice, 4.0% were positive for IFN-γ. Similar experiments 72 h after injection showed that a lower proportion of OT-II cells from anti–PD-1–treated mice expressed IFN-γ (control Ab 4.8%, anti–PD-1 Ab 2.8%; a repeat experiment gave similar results).
Figure 7.
The effect of PD-1 blockade on antigen-specific OT-II cell proliferation 48 h (A) and 72 h after intrarenal OVA injection (B). At 48 h, proliferation has commenced in mice injected with control Ab, and there is some effect of PD-1 at this early time point. After 72 h, the effect is more pronounced. Consistent with the lack of expression of PD-1 on naïve CD4+ cells, similar proportions of cells were in each division, suggesting that the time to first division is not affected by PD-1. Because these studies were performed by transferring CD45.2+ OT-II cells into congenic CD45.1 mice, the single-parameter histograms are from cells that are CD45.2+CD4+Va2+. The dotted vertical lines in the single-parameter histograms (A and B) represent the degree of CFSE intensity of nonproliferating cells. □, Mice injected with control Ab; ▪, mice injected with anti–PD-1 Ab.
Antigen-Specific Cells Accumulated in Injected Kidneys 7 D after Antigen Injection
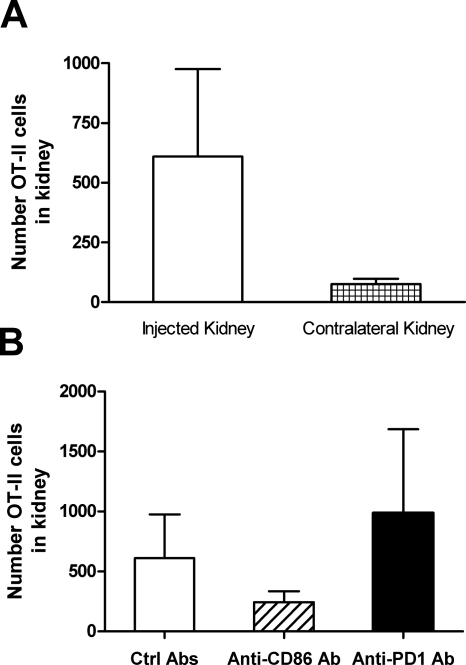
Naïve OT-II cells (CD45.2+) were transferred into congenic CD45.1 mice, OVA was injected intrarenally, and intrarenal OT-II cell numbers were assessed after 7 d. OT-II cells returned to kidneys into which OVA had been injected, and CD86 or PD-1 inhibition for 7 d had some effect on numbers of OT-II cells returning to kidney as the site of antigen injection (Figure 8).
Figure 8.
OT-II cells return to the kidney 7 d after antigen injection. OT-II cells (expressing the CD45.2 allele) were transferred into congenic CD45.1 mice that were injected intrarenally with OVA. Mice were given control Ab, anti-CD86 Ab, or anti–PD-1 Ab. CD4+CD45.2+ (OT-II) cells were identified in digested kidneys, with more OT-II cells in the injected kidney and changes in intrarenal cell numbers on anti-CD86 and anti–PD-1–treated mice, consistent with their roles in early CD4+ cell proliferation.
Effect of Co-stimulatory Molecules on Antigen-Specific Responses to Subcutaneous Antigen Administration
For determination of whether the roles of co-stimulatory molecules in early CD4+ cell activation are similar when antigen is delivered intrarenally compared with subcutaneously, studies were performed in mice receiving OVA subcutaneously (CFA subcutaneously at a distant site; Figure 9). After subcutaneous OVA, antigen-specific CD4+ cell proliferation was attenuated in the absence of CD80 and CD86 (Figure 9A), although the attenuation was less profound compared with intrarenal OVA. CD86 was the dominant CD28 ligand in early CD4+ cell proliferation after antigen subcutaneously. Inhibition of CD86 resulted in an approximately 60% reduction in cell numbers, but anti-CD80 injection had no effect (Figure 9B). At 72 h, there were more OT-II cells in the absence of PD-1 (Figure 9C), and, in contrast to the renal LN, a higher proportion of OT-II cells made IFN-γ (control Ab 0.8%, anti–PD-1 Ab 5.5%).
Figure 9.
Studies in subcutaneous antigen presentation 72 h after injection of OVA subcutaneously with CFA injected at a distant site, subcutaneously. Studies were performed to neutralize both CD80 and CD86 (A), either CD80 or CD86 (B), and PD-1 (C). Qualitatively, co-stimulation blockade results were similar to studies in intrarenal antigen presentation, although the effects of combined CD80 and CD86 were less profound and the effects of neutralizing PD-1 may be more substantial. □, Mice injected with control Ab; ▪, mice injected with anti-CD80 and CD86 Ab (A), anti-CD80 Ab (B), and anti–PD-1 Ab (C); and ▒, mice injected with anti-CD86 Ab (B).
DISCUSSION
Adaptive immune responses provide specificity, power, and memory to the immune system and are directed by small numbers of antigen-specific CD4+ cells that are activated by DC expressing co-stimulatory molecules. TcR transgenic mice have allowed in vivo studies of antigen presentation, T cell proliferation, death, migration, tolerance induction, memory cell generation, and effector cell movement.1,15,16 These studies establish an in vivo technique for examining antigen-specific CD4+ cell activation and responses to antigens in the kidney and allow application of this technique to define the role of the key co-stimulatory molecules in CD4+ cell activation. They demonstrate that antigen-specific CD4+ cell proliferation when antigen is in the kidney lags behind that seen when antigen is in the skin. They demonstrate the importance of the CD80/CD86-CD28 system in early CD4+ cell activation; define CD86 as a key molecule in CD4+ cell proliferation; and indicate that even early in the process of activation, interactions between PD-1 and its ligands are a brake on CD4+ cell proliferation, consistent with their limiting excessive, inappropriate responses. There were several differences between responses when antigen was deposited in the kidney, compared with responses after subcutaneous injection. Antigen-specific CD4+ cell proliferation was slower in the kidney draining LN; the initial proliferation was more profoundly CD80/CD86-CD28 dependent; and, at least at 72 h, PD-L1/PD-L2/PD-1 interactions were not such a break on the acquisition of effector function, as assessed by single-cell IFN-γ production.
CD28 ligation by CD86 (or potentially CD80) on DC reduces the number of TcR needing to be bound to peptide/MHC II to trigger activation,17 increases IL-2 gene transcription/mRNA stability, enhances CD4+ cell IL-2R expression,18,19 and promotes CD4+ cell survival via increased Bcl-xL.20 There were fewer surviving OT-II cells in renal LN of mice given anti-CD80 and anti-CD86 Ab, compared with similar experiments harvesting cells from LN draining the skin, consistent with cells undergoing increased apoptosis in the renal LN without CD28 engagement. Furthermore, the remaining cells were delayed in their degree of proliferation, blocking CD28's effect on cell-cycle progression.21
Interactions between PD-1 and its ligands help maintain peripheral tolerance and limit tissue injury in inflammation.6 PD-1 limits some of CD28's effects, including those on Bcl-xL expression.22 In vivo studies confirm a negative regulatory role for this system in adaptive immunity.2,6 These studies extend PD-1's functional involvement to primary immune responses initiated in the renal parenchyma and draining LN. Effects on proliferation were seen at both 48 and 72 h, although the magnitude of the effect was greater when T cells had been activated for an additional 24 h, consistent with the increasing expression of PD-1. Increasing degrees of proliferation enable cells to produce effector cytokines. Endogenous PD-1 limited the ability of OT-II cells to make IFN-γ at 48 h but not at 72 h. Whereas at 72 h the proportion of OT-II cells producing IFN-γ was lower in renal LN from anti–PD-1 Ab–treated mice, total OT-II cell numbers were increased in LN from anti–PD-1 Ab–treated mice, meaning that the total number of IFN-γ–producing cells at 72 h is similar in both groups. Whereas some studies showed that the capacity of CD4+ cells to secrete IFN-γ increases with increasing proliferation,23,24 others suggested that the IFN-γ secretion is acquired by some cells within 24 h of antigen exposure.25 In the kinetics of the immune response after antigen is deposited in the kidney, blocking PD-1 has an effect on the early burst of IFN-γ but little net effect on IFN-γ at a later time point. In experiments using subcutaneous antigen, both the proportion and the numbers of antigen-specific CD4+ cells producing IFN-γ were increased at 72 h, showing that the PD-1 has less effect on suppressing IFN-γ production after intrarenal injection, at least in the draining LN.
Antigen-specific CD4+ cell proliferation in the draining LN is slower after intrarenal antigen injection compared with subcutaneous antigen injection. The delay in proliferation might reflect differences in numbers of DC trafficking to draining LN, because the skin is a primary immune barrier. Qualitatively, members of the B7 family on dermal and renal DC play similar roles in early proliferation, although renal LN responses were more CD80/CD86-CD28 dependent. These studies demonstrated proof of principle that antigen-activated OT-II cells return to the site of antigen exposure (i.e., the kidney) after 7 d and that neutralizing CD86 or PD-1 can affect this return.
Two studies that examined primary T cell responses triggered by renal DC suggested that renal DC are not less efficient than splenic DC in initiating CD4+ cell proliferation. One used a one-way mixed lymphocyte reaction (C57BL/6 renal DC-BALB/c T cells),13 and the other transferred DO11.10 cells into BALB/c mice and injected OVA under the kidney capsule.14 In summary, these studies demonstrate that antigen-specific CD4+ cell proliferation is slower after antigen is deposited in the kidney compared with the skin as a reference organ. They determine patterns of co-stimulatory molecule expression on renal DC and define the roles of co-stimulatory molecules in early CD4+ cell activation after antigen is delivered to the kidney. Compared with responses in the skin, qualitatively, the roles of B7 family members are similar in early CD4+ cell activation, but responses via the kidney are more CD80/CD86 dependent, whereas PD-1 plays less of a role in inhibiting early IFN-γ production in secondary lymphoid organs.
CONCISE METHODS
Intrarenal and Subcutaneous OVA Injection
OT-II mice and congenic CD45.1 mice were bred at Monash Medical Centre SPF Facility (Clayton, Victoria, Australia), and SPF C57BL/6 mice were purchased from Monash University Animal Services. Mice were anesthetized with 0.2 mg/g ketamine and 10 μg/g xylazine intraperitoneally. The left kidney was exteriorized through a posterior approach, and 8 μl of OVA solution or PBS was injected over 4 to 8 min using a customized syringe pump–driven system via a 30-G needle inserted into the interstitium, allowing diffusion into the tissue without leakage. The kidney was replaced, the incision was sutured, and buprenorphine was administered (Reckitt Benchiser, West Ryde, NSW, Australia; 15 μg/mouse intraperitoneally). CFA (Sigma, Castle Hill, NSW, Australia) was administered subcutaneously. Studies adhered to the National Health and Medical Research Council of Australia guidelines for animal experimentation. Results are expressed as means ± SEM. The unpaired t test was used for statistical analysis.
Antibodies for Flow Cytometric Assessment of Cell Surface Markers
The following Ab were used in flow cytometry (all BD Biosciences unless otherwise specified): Anti–CD4-FITC, -PE, or –APC-Cy7 (GK1.5; ATCC, Manassas, VA; RM4–4), anti–CD11c-PE (HL3), anti-CD80 Alexa Fluor-488 (16-A410), anti–CD86–647 (GL-1), anti–PD-L1–488 (MIH5, a gift form Prof. M. Azuma, Tokyo Medical and Dental University, Tokyo, Japan26), anti–PD-L2–488 (TY2527), anti–Vα2-647 (B20.1), anti–Vβ5-488 (MR9), anti–CD45.2-APC, and anti–CD44-PE. Clone 2.4G2 (anti-CD16/CD32) blocked Fc receptors. Ab grown in house were conjugated to Alexa Fluor kits (Molecular Probes, Eugene, OR). Flow cytometric analyses were performed on a Mo-Flow flow cytometer (Dako, Botany, NSW, Australia).
Analysis of Expression of Co-stimulatory Molecules on DC and Confocal Microscopy
Kidneys or the renal draining LN (the murine renal draining LN lie posterior to the medial portion of the upper pole) were digested using DNAse I and collagenase D (Roche Diagnostics, Castle Hill, NSW, Australia), enriched for CD11c+ cells using CD11c microbeads (N418; Miltenyi, North Ryde, NSW, Australia), and CD11c+ cells were phenotyped using anti-CD80, anti-CD86, anti–PD-L1, and anti–PD-L2 Ab. In analyses, leukocyte populations were gated from other contaminating cell types and cellular debris from forward angle light scatter (cell size) and right angle side scatter (cell granularity). Propidium iodide–positive cells were excluded from analyses. For confocal microscopy, cryostat cut sections (4 μm) of snap-frozen renal tissue were blocked (anti-CD16/CD32, 10% rat serum, 10% guinea pig serum in 5% BSA/PBS), then incubated with Ab anti–CD11c-FITC (HL3) and anti-CD80 (16-A410), anti-CD86 (GL-1), anti–PD-L1 (MIH5), or anti–PD-L2 (TY25), all conjugated to Alexa Fluor-568. Confocal images were collected using a Leica SP5 confocal microscope with Argon and HeNe lasers (Leica Microsystems, Wetzlar, Germany).
Using OT-II Cells to Determine CD4+ Cell Proliferation
An adoptive transfer model was established on the basis of the system of Jenkins and colleagues,11,28,29 with modifications. OT-II mice30 have I-Ab-restricted naïve CD4+ T cells recognizing OVA323–339, expressing the αβTcR, Vα2, and Vβ5. Lymph nodes (cervical, axillary, brachial, pancreatic, mesenteric, inguinal, lumbar, and caudal) were collected from naïve OT-II mice into HF2.5 (HBSS, 2.5% FBS) and an aliquot stained for CD4, Vα2, and Vβ5. OT-II cells comprise 91.5% (n = 3) of CD4+ cells in LN. For CFSE labeling,31 cells were centrifuged and resuspended in PBS 0.1% BSA (107 cells/ml), CFSE (Sigma; 1 μl/ml) was added, the suspension was vortexed and incubated, the tube was filled with HF2.5 and centrifuged, then cells were resuspended in PBS for transfer. Vα2+CD4+ cells (3 to 5 × 10⁶) were injected intravenously (300 μl of PBS) into C57BL/6 mice or, in some experiments, congenic CD45.1 mice. OVA was injected 1 to 3 d after transfer. CD4+ Vα2+CFSE+ and propidium iodide–negative OT-II cells were identified in recipient LN. The number of OVA-specific CD4+ (OT-II) cells was determined by multiplying the percentage of CD4+Vα2+CFSE+ cells by the total number of LN cells. Recipient CD4+Vα2+CFSE− cells were observed in experiments. At 72 h, these are not OT-II cells that have undergone more than six divisions and become CFSE− (studies transferring CD45.2+ OT-II cells into congenic CD45.1+ recipients determined that CD4+Va2+CFSE− cells express CD45.1 (i.e., they were recipient cells [data not shown]). For clarity, these irrelevant CFSE− cells are omitted from single parameter histograms in Figures 3 through 6. Experiments used 3 to 5 recipient mice per group.
For determination of the functional role of CD80, CD86, and PD-1, neutralizing Ab to each of the molecules were administered. Ab 16-A410 (CD80) and GL-1 (CD86) were administered (100 μg in 200 μl of PBS intraperitoneally) every second day from the day before OVA injection.32 For PD-1, Ab clone J43 was given intraperitoneally, 500 μg in 200 μl of PBS the day before OVA injection followed by 250 μg 2 d later.33 For 7-d studies, administration of either anti-CD86 or anti–PD-1 Ab continued (250 μg every second day). Nonimmune rat or guinea pig Ab were administered as control Ab. Parallel studies were conducted with the same dosage of subcutaneous OVA, with CFA at a distant subcutaneous site and the draining LN studied.
Antigen-Specific CD4+ Cell IFN-γ Production
OT-II cells were transferred into congenic CD45.1 mice. Single-cell suspensions from renal draining LN were prepared. Because of the small numbers of cells recovered and the ex vivo stimulation, cells were pooled from mice in the same experimental group, then resuspended (1 × 10⁶ in 100 μl). OVA323–339 (1 μM; Auspep, Parkville, VIC, Australia) was added or omitted (negative control). Cells were incubated (37°C, 2h); brefeldin A (5 μg/ml, Sigma) was added (4 h); then cells were harvested and incubated with Fc Block (20 min, on ice), washed, and stained for CD4 and CD45.2 (30 min, on ice). After washing, cells were fixed, permeabilized (BD Cytofix/Cytoperm Kit; BD Biosciences), and stained with anti–IFN-γ-PE (XMG1.2, BD Biosciences).
DISCLOSURES
None.
Supplementary Material
Acknowledgments
These studies were supported by a Program Grant from the National Health and Medical Research Council of Australia.
Parts of these studies were published in abstract form (J Am Soc Nephrol 17: 798A, 2006; Nephrology 11[Suppl 2]: A5, 2006).
We thank Prof. Bill Heath (Walter and Eliza Hall Institute, Melbourne, Australia) for the OT-II mice, Prof. Miyuki Azuma (Tokyo Medical and Dental University, Japan) for the MIH5 mAb, Alice Wright for technical assistance and Assoc. Prof. Michelle Leech, Assoc. Prof. David Finkelstein, and Dr. Brian Howden for advice in the technique of intrarenal injection.
Published online ahead of print. Publication date available at www.jasn.org.
REFERENCES
- 1.Jenkins MK, Khoruts A, Ingulli E, Mueller DL, McSorley SJ, Reinhardt RL, Itano A, Pape KA: In vivo activation of antigen-specific CD4 T cells. Annu Rev Immunol 19: 23–45, 2001 [DOI] [PubMed] [Google Scholar]
- 2.Greenwald RJ, Freeman GJ, Sharpe AH: The B7 family revisited. Annu Rev Immunol 23: 515–548, 2005 [DOI] [PubMed] [Google Scholar]
- 3.Harris NL, Ronchese F: The role of B7 costimulation in T-cell immunity. Immunol Cell Biol 77: 304–311, 1999 [DOI] [PubMed] [Google Scholar]
- 4.Salomon B, Bluestone JA: Complexities of CD28/B7: CTLA-4 costimulatory pathways in autoimmunity and transplantation. Annu Rev Immunol 19: 225–252, 2001 [DOI] [PubMed] [Google Scholar]
- 5.Green JM, Noel PJ, Sperling AI, Walunas TL, Gray GS, Bluestone JA, Thompson CB: Absence of B7-dependent responses in CD28-deficient mice. Immunity 1: 501–508, 1994 [DOI] [PubMed] [Google Scholar]
- 6.Sharpe AH, Wherry EJ, Ahmed R, Freeman GJ: The function of programmed cell death 1 and its ligands in regulating autoimmunity and infection. Nat Immunol 8: 239–245, 2007 [DOI] [PubMed] [Google Scholar]
- 7.Nishimura H, Honjo T: PD-1: An inhibitory immunoreceptor involved in peripheral tolerance. Trends Immunol 22: 265–268, 2001 [DOI] [PubMed] [Google Scholar]
- 8.Nishimura H, Nose M, Hiai H, Minato N, Honjo T: Development of lupus-like autoimmune diseases by disruption of the PD-1 gene encoding an ITIM motif-carrying immunoreceptor. Immunity 11: 141–151, 1999 [DOI] [PubMed] [Google Scholar]
- 9.Khoury SJ, Sayegh MH: The roles of the new negative T cell costimulatory pathways in regulating autoimmunity. Immunity 20: 529–538, 2004 [DOI] [PubMed] [Google Scholar]
- 10.Schoop R, Wahl P, Le Hir M, Heemann U, Wang M, Wuthrich RP: Suppressed T-cell activation by IFN-gamma-induced expression of PD-L1 on renal tubular epithelial cells. Nephrol Dial Transplant 19: 2713–2720, 2004 [DOI] [PubMed] [Google Scholar]
- 11.Kearney ER, Pape KA, Loh DY, Jenkins MK: Visualization of peptide-specific T cell immunity and peripheral tolerance induction in vivo. Immunity 1: 327–339, 1994 [DOI] [PubMed] [Google Scholar]
- 12.Soos TJ, Sims TN, Barisoni L, Lin K, Littman DR, Dustin ML, Nelson PJ: CX3CR1+ interstitial dendritic cells form a contiguous network throughout the entire kidney. Kidney Int 70: 591–596, 2006 [DOI] [PubMed] [Google Scholar]
- 13.Kruger T, Benke D, Eitner F, Lang A, Wirtz M, Hamilton-Williams EE, Engel D, Giese B, Muller-Newen G, Floege J, Kurts C: Identification and functional characterization of dendritic cells in the healthy murine kidney and in experimental glomerulonephritis. J Am Soc Nephrol 15: 613–621, 2004 [DOI] [PubMed] [Google Scholar]
- 14.Dong X, Swaminathan S, Bachman LA, Croatt AJ, Nath KA, Griffin MD: Antigen presentation by dendritic cells in renal lymph nodes is linked to systemic and local injury to the kidney. Kidney Int 68: 1096–1108, 2005 [DOI] [PubMed] [Google Scholar]
- 15.Reinhardt RL, Bullard DC, Weaver CT, Jenkins MK: Preferential accumulation of antigen-specific effector CD4 T cells at an antigen injection site involves CD62E-dependent migration but not local proliferation. J Exp Med 197: 751–762, 2003 [DOI] [PMC free article] [PubMed] [Google Scholar]
- 16.Catron DM, Rusch LK, Hataye J, Itano AA, Jenkins MK: CD4+ T cells that enter the draining lymph nodes after antigen injection participate in the primary response and become central-memory cells. J Exp Med 203: 1045–1054, 2006 [DOI] [PMC free article] [PubMed] [Google Scholar]
- 17.Wells AD, Gudmundsdottir H, Turka LA: Following the fate of individual T cells throughout activation and clonal expansion. Signals from T cell receptor and CD28 differentially regulate the induction and duration of a proliferative response. J Clin Invest 100: 3173–3183, 1997 [DOI] [PMC free article] [PubMed] [Google Scholar]
- 18.Lindstein T, June CH, Ledbetter JA, Stella G, Thompson CB: Regulation of lymphokine messenger RNA stability by a surface-mediated T cell activation pathway. Science 244: 339–343, 1989 [DOI] [PubMed] [Google Scholar]
- 19.Fraser JD, Irving BA, Crabtree GR, Weiss A: Regulation of interleukin-2 gene enhancer activity by the T cell accessory molecule CD28. Science 251: 313–316, 1991 [DOI] [PubMed] [Google Scholar]
- 20.Boise LH, Minn AJ, Noel PJ, June CH, Accavitti MA, Lindsten T, Thompson CB: CD28 costimulation can promote T cell survival by enhancing the expression of Bcl-XL. Immunity 3: 87–98, 1995 [DOI] [PubMed] [Google Scholar]
- 21.Bonnevier JL, Mueller DL: Cutting edge: B7/CD28 interactions regulate cell cycle progression independent of the strength of TCR signaling. J Immunol 169: 6659–6663, 2002 [DOI] [PubMed] [Google Scholar]
- 22.Parry RV, Chemnitz JM, Frauwirth KA, Lanfranco AR, Braunstein I, Kobayashi SV, Linsley PS, Thompson CB, Riley JL: CTLA-4 and PD-1 receptors inhibit T-cell activation by distinct mechanisms. Mol Cell Biol 25: 9543–9553, 2005 [DOI] [PMC free article] [PubMed] [Google Scholar]
- 23.Bird JJ, Brown DR, Mullen AC, Moskowitz NH, Mahowald MA, Sider JR, Gajewski TF, Wang CR, Reiner SL: Helper T cell differentiation is controlled by the cell cycle. Immunity 9: 229–237, 1998 [DOI] [PubMed] [Google Scholar]
- 24.Gudmundsdottir H, Wells AD, Turka LA: Dynamics and requirements of T cell clonal expansion in vivo at the single-cell level: Effector function is linked to proliferative capacity. J Immunol 162: 5212–5223, 1999 [PubMed] [Google Scholar]
- 25.Mempel TR, Henrickson SE, Von Andrian UH: T-cell priming by dendritic cells in lymph nodes occurs in three distinct phases. Nature 427: 154–159, 2004 [DOI] [PubMed] [Google Scholar]
- 26.Tsushima F, Iwai H, Otsuki N, Abe M, Hirose S, Yamazaki T, Akiba H, Yagita H, Takahashi Y, Omura K, Okumura K, Azuma M: Preferential contribution of B7–H1 to programmed death-1-mediated regulation of hapten-specific allergic inflammatory responses. Eur J Immunol 33: 2773–2782, 2003 [DOI] [PubMed] [Google Scholar]
- 27.Yamazaki T, Akiba H, Iwai H, Matsuda H, Aoki M, Tanno Y, Shin T, Tsuchiya H, Pardoll DM, Okumura K, Azuma M, Yagita H: Expression of programmed death 1 ligands by murine T cells and APC. J Immunol 169: 5538–5545, 2002 [DOI] [PubMed] [Google Scholar]
- 28.Kearney ER, Walunas TL, Karr RW, Morton PA, Loh DY, Bluestone JA, Jenkins MK: Antigen-dependent clonal expansion of a trace population of antigen-specific CD4+ T cells in vivo is dependent on CD28 costimulation and inhibited by CTLA-4. J Immunol 155: 1032–1036, 1995 [PubMed] [Google Scholar]
- 29.Reinhardt RL, Khoruts A, Merica R, Zell T, Jenkins MK: Visualizing the generation of memory CD4 T cells in the whole body. Nature 410: 101–105, 2001 [DOI] [PubMed] [Google Scholar]
- 30.Barnden MJ, Allison J, Heath WR, Carbone FR: Defective TCR expression in transgenic mice constructed using cDNA-based alpha- and beta-chain genes under the control of heterologous regulatory elements. Immunol Cell Biol 76: 34–40, 1998 [DOI] [PubMed] [Google Scholar]
- 31.Lyons AB, Parish CR: Determination of lymphocyte division by flow cytometry. J Immunol Methods 171: 131–147, 1994 [DOI] [PubMed] [Google Scholar]
- 32.Odobasic D, Kitching AR, Semple TJ, Timoshanko JR, Tipping PG, Holdsworth SR: Glomerular expression of CD80 and CD86 is required for leukocyte accumulation and injury in crescentic glomerulonephritis. J Am Soc Nephrol 16: 2012–2022, 2005 [DOI] [PubMed] [Google Scholar]
- 33.Salama AD, Chitnis T, Imitola J, Ansari MJ, Akiba H, Tushima F, Azuma M, Yagita H, Sayegh MH, Khoury SJ: Critical role of the programmed death-1 (PD-1) pathway in regulation of experimental autoimmune encephalomyelitis. J Exp Med 198: 71–78, 2003 [DOI] [PMC free article] [PubMed] [Google Scholar]
Associated Data
This section collects any data citations, data availability statements, or supplementary materials included in this article.


