

Abstract
Urethane dimethacrylate (UDMA), an oligomeric poly(ethylene glycol) extended UDMA (PEG-U) and a blend of UDMA/PEG-U were chosen as model systems for introducing both hydrophobic and hydrophilic segments and a range of compliances in their derived polymers. Experimental composites based on these three resins with amorphous calcium phosphate (ACP) as the filler phase were polymerized and evaluated for mechanical strength and ion release profiles in different aqueous media. Strength of all composites decreased upon immersion in saline (pH = 7.4). Both polymer matrix composition and the pH of the liquid environment strongly affected the ion release kinetics. In saline, the UDMA/PEG-U composite showed a sustained release for at least 350 h. The initially high ion release of the PEG-U composites decreased after 72 h, seemingly due to the mineral re-deposition at the composite surface. Internal conversion from ACP to poorly crystallized apatite could be observed by X-ray diffraction. In various lactic acid (LA) environments (initial pH = 5.1) ion release kinetics was much more complex. In LA medium without thymol and/or carboxymethylcellulose, as a result of unfavorable changes in the internal calcium/phosphate ion stoichiometry, the ion release rate greatly increased but without observable conversion of ACP to apatite.
Keywords: amorphous calcium phosphate(s), composite/hard tissue, ion release, mechanical strength, urethane methacrylate
INTRODUCTION
It is well known that bioactive ceramics and glasses can promote hard tissue adhesion in both dental and bioprosthetic applications. Recently, an emphasis has been placed on the bioactivity of various calcium phosphates (CaP), alone or in mixtures, and their potential role in the treatment of defective mineralized tissues. In dental applications, the sustained release of calcium and phosphate is essential in providing supersaturation conditions needed for the arrest of mineral dissolution and new hard tissue formation via mineral re-deposition. Considered a related but unwanted process, dystrophic calcification of polymeric heart valves is the major cause of structural deterioration of these products [1, 2]. In an effort to control this adverse mineralization, heart valve manufacturers have developed various anti-calcification treatments with unknown long-term clinical effectiveness. In both wanted and unwanted mineralization, amorphous calcium phosphate (ACP) is speculated to be a precursor mineral phase. This highly disordered CaP rapidly converts to thermodynamically more stable crystalline form(s), leading to the formation of apatite, the predominant mineral phase of matured bone, while concurrently releasing Ca and PO4 into surrounding media. Understanding the release and conversion kinetics of ACP from various polymeric matrices in simulated bio-environments may further our understanding of the therapeutic use of medical devices and/or materials.
Currently, there are no accepted in vitro or in vivo test protocols to validate or quantify the anti-demineralization/remineralization claims for dental restorative materials. In the case of both synthetic and natural cardiovascular materials, the lack of fundamental understanding of the calcification processes that lead to catastrophic failures of these devices make it practically impossible to propose meaningful evaluation protocols. Recently, the preliminary data on the mechanical strength and aqueous stability of the experimental ACP urethane methacrylate (UDMA), a poly(ethylene glycol) extended UDMA (PEG-U based on PEG 400) and a blend UDMA/PEG-U resin composites have been published [3, 4]. ACP was selected as a model CaP due to its compositional and solubility properties [5] and its reportedly high level presence (as much as 9 % by mass) in young bone [6]. The UDMA, PEG-U, and the blend resins were selected as resin matrix binder phase of ACP-filled composites since their polymers contain both hydrophilic and hydrophobic components spanning a range of mechanical compliances, potentially useful in maxillofacial and dental reconstructive devices [7]. These materials also closely correspond to compliant polyurethanes used in cardiovascular applications [8]. Such an assessment seems necessary in evaluating the remineralizing potential of ACP in dental hard tissue regeneration.
The objectives of this study were: a) to assess the mechanical strength of composites exposed for prolonged time to the various aqueous environments and b) to establish the environmental effect(s) (change in pH and fluid composition) on ion release kinetics and the subsequent apatite formation in these systems. Additionally, understanding the kinetics of ACP to apatite conversion in these synthetic materials as well as the effects of various environmental parameters on this process may be critical in forecasting the ACP's role in early cardiovascular calcification.
METHODS
Synthesis and characterization of ACP filler
Zirconia-hybridized ACP (Zr-ACP) precipitated instantaneously in a closed system at 23 °C upon rapidly mixing equal volumes of a 800 mmol/L Ca(NO3)2 solution, a 536 mmol/L Na2HPO4 solution that contained a molar fraction of 2 % Na4P2O7 as a stabilizing component for ACP, and an appropriate volume of a 250 mmol/L ZrOCl2 solution (mole fraction of 10 % ZrOCl2 based on Ca reactant). The reaction pH varied between 8.6 and 9.0. The suspension was filtered, the solid phase washed subsequently with ice-cold ammoniated water and acetone, and then lyophilized. The amorphous state of the filler was verified by powder X-ray diffraction (XRD: Rigaku X-ray diffractometer, Rigaku/USA Inc., Danvers, MA, USA) and Fourier-transform spectroscopy (FTIR: Nicolet Magna-IR FTIR System 550 spectrophotometer, Nicolet Instrument Corporation, Madison, WI, USA). Morphological/topological features of the filler, after the specimen was sputter-coated with gold, were examined by scanning electron microscopy (SEM; JEOL 35C instrument, JEOL Inc., Peabody, MA, USA). Particle size distribution (PSD) of the filler was determined by gravitational and centrifugal sedimentation analysis (SA-CP3 particle size analyzer, Shimadzu Scientific Instruments, Inc., Columbia, MD, USA) following dispersion of the solid in isopropanol and 10 min ultrasonication of the mixture. Water content of the filler was determined by thermogravimetric analysis, TGA (Perkin Elmer 7 Series Thermal Analysis System, Norwalk, CT, USA). The TGA (3 separate runs/group) was performed by heating (5 to 10) mg of the filler at the rate of 20 °C/ min over a temperature range of (30 to 600) °C in air. The surface or loosely bound water was attributed to the mass loss that occurred from 23 °C to 125 °C. Structural or more tightly bound water was attributed to the mass loss that occurred from 150 °C to 600 °C. Ca/PO4 ratio of the solid after dissolution in HCl was calculated from solution Ca and PO4 values [9, 10] (UV/VIS Carey Model 219 spectrophotometer, Varian Analytical Instruments, Palo Alto, CA, USA).
The rationale for introducing the zirconium cation during ACP's preparation is twofold: 1) to provide a stabilizing additive that inhibits the internal (within the composite) conversion of ACP to apatite, and 2) to provide via higher atomic mass of Zr compared to Ca a measure of radiopacity to to the composite. In addition, previous studies had shown that Zr-ACP composites versus control ACP composites have superior mechanical strength.
Formulation of the resins
The experimental resins were formulated from the commercially available UDMA monomer and PEG-U oligomer, photoactivated for visible light polymerization by addition of the components of the photoinitiator system: camphorquinone, CQ, and ethyl-(4-N,N-dimethylaminobenzoate), 4EDMAB, (Fig. 1; Table 1). Acronyms indicated in Table 1 will be used throughout this manuscript. The molecular masses (Mw) of the resin components were determined by MALDI time of flight mass spectroscopy (Bruker Daltonics Reflux II, Billerica, Ma, USA) as previously described [11].
Fig. 1.

Chemical structure of the monomers/oligomers and photo-curing agents utilized in the study.
Table 1.
Monomers and components of photo-initiator system (% mass fraction) employed in resin formulations.
| Component*/Chemical Name | Acronym | UDMA | PEG-U | UDMA/PEG-U |
|---|---|---|---|---|
| Urethane dimethacrylate | UDMA | 99.00 | - | 74.25 |
| Poly(ethylene glycol)* extended UDMA | PEG-U | - | 99.00 | 24.75 |
| Camphorquinone | CQ | 0.20 | 0.20 | 0.20 |
| Ethyl-(4-N,N-dimethylaminobenzoate) | 4EDMAB | 0.80 | 0.80 | 0.80 |
UDMA and PEG-U were manufactured by Esstech, PA, USA; CQ and 4EDMAB were obtained from Aldrich, WI, USA.
Based on PEG 400 as shown in Fig. 1.
Preparation of composite, polymer and copolymer specimens
Composite pastes were generally made by mixing the resin (mass fraction 60 %) and “as-made” Zr-ACP filler (mass fraction 40 %) by hand spatulation. The homogenized pastes were kept under a moderate vacuum (2.7 kPa) overnight to eliminate the air entrained during mixing. Uncured pastes were examined by XRD and FTIR to verify that ACP had not converted to apatite prior to specimen preparation. The pastes were molded into disks (15.8 mm to 19.6 mm in diameter and 1.55 mm to 1.81 mm thick) by filling the circular openings of flat Teflon molds, covering each side of the mold with a Mylar film plus a glass slide, and then clamping the assembly together with spring clips. The disks were photo-polymerized by irradiating sequentially each face of the mold assembly for 120 s with visible light (Triad 2000, Dentsply International, York, PA, USA). The unfilled UDMA or PEG-U polymer and UDMA/PEG-U copolymer disk specimens were prepared using circular Teflon molds ((14.9 ± 0.3) mm in diameter and (1.0 ± 0.2) mm in thickness) with one open face and a Teflon bottom layer to avoid the resin from seeping out of the bottom of the mold. The resin was poured into the cavity, the filled cavity was covered with Mylar film and a glass slide and the assembly clamped together by spring clips to prevent introducing air voids. The unfilled polymer and copolymer disks were first irradiated for 120 s on the glass slide-side of the mold and then the cured disks were removed from their molds and cured on the reverse side for 120 s.
Evaluation of composites and unfilled polymers and copolymers
The biaxial flexure strength (BFS) of dry and wet (after the immersion in soaking solutions at 23 °C) polymer, copolymer and composite disk specimens (three or more specimen per group) was determined by using a computer-controlled Universal Testing Machine (Instron 5500R, Instron Corp., Canton, MA, USA; crosshead speed: 0.5 mm/min) operated by Testworks4 software. BFS values, a peak biaxial flexure stress before breaking for deflection less than half the thickness, were calculated according to mathematical expressions given in ASTM F394−78 [12].
To determine water sorption (WS) profiles of the unfilled polymer, copolymer and composite disk specimens (a minimum of five/group) were first dried over anhydrous CaSO4 to achieve a constant dry mass (± 0.1 mg). The specimens were then exposed to an air atmosphere of 75 % relative humidity (RH) at 23 °C (suspended over saturated aqueous NaCl slurry in a closed system). Gravimetric changes were recorded at predetermined time intervals of exposure to this RH. The WS (% mass fraction) of the individual specimens was calculated using the expression:
| (1) |
where Wo and Wt represent the mass of specimen mass at t=0 and at any given time interval t, respectively.
Ion release from composites was screened in two separate series. First, the individual UDMA, PEG-U and UDMA/PEG-U disk specimens utilizing the “as-made” ACP were immersed into the buffered saline solutions (pH = 7.40, ionic strength = 0.13 mol/L, 23°C, continuous magnetic stirring) for at least 300 h (series I; three independent runs in each experimental group). Series II evaluated the UDMA/PEG-U composite specimens exposed for to 1200 h at 23 °C to: a) 0.1 mol/L (pH = 5.10) lactic acid solution - assigned LA, b) LA solution containing 1 % mass fraction carboxymethyl cellulose (CMC) – assigned LC, c) LA solution containing thymol (2−3 crystals/L) – assigned LT, and LA solution containing CMC and thymol – assigned LCT. For each data point, aliquots of the soaking solution were taken and analyzed for the Ca and PO4 contents [9, 10]. In addition, the physical dimensions of the disk were measured and the weight monitored to establish the combined change in mass due to liquid absorption and ion release over time. A representative specimen from each experimental group was tested for conversion to apatite by XRD analysis at predetermined time intervals. Ion release data were corrected for variations in the total area of surface disk exposed to the immersion solution. They were normalized to a surface area of 500 mm2 [4]
The thermodynamic stability of immersion solutions containing the maximum levels of Ca and PO4 released from UDMA, PEG-U and UDMA/PEG-U composites (experimental series I), taken as a quantitative measure of the anti-demineralizing/remineralizing potential of the composites, was calculated using the Gibbs free-energy expression:
| (2) |
where IAP is the ionic activity product for the hydroxyapatite (Ca10(OH)2(PO4)6; HAP), Ksp is the HAP's thermodynamic solubility product , R is the ideal gas constant, T is the absolute temperature and n is the number of ions in the IAP (n = 18). Chemist software provided by MicroMath Research, St. Louis, MO, USA, was used for the IAP calculations.
Statistical data analysis
One standard deviation (SD) is indicated in this paper for comparative purposes as the estimated standard uncertainty of the measurements. Experimental data were analyzed by ANOVA (α = 0.05). Significant differences between specific groups were determined by all pair-wise multiple comparisons.
RESULTS
Physicochemical characteristics of Zr-ACP
XRD pattern of Zr-ACP employed in this study showed two diffuse, broad bands resembling the XRD spectra of noncrystalline substances such as glasses and certain polymers (Fig. 2a). A corresponding FTIR spectrum (Fig. 2b) showed wide bands typical for phosphate stretching and phosphate bending in the region of (1200 to 900) cm−1 and (630 to 500) cm−1, respectively. The Zr-ACP had heterogeneous size distribution (size range (0.3 to 80) μm; confirmed by SEM (Fig. 3)) with the median diameter dm = (7.4 ± 2.3) μm and the specific surface area SSA = (0.5 ± 0.1) m2/g. The average water content of the filler was (17.1 ± 1.5) % mass fraction with approx. 2/3 being surface-bound (mobile) water and 1/3 structurally incorporated water (TGA results). Approx. 22 % by mass of the filler comprised the HCl-insoluble amorphous Zr-phosphate (Raman data, not shown) co-precipitate. This amorphous Zr-phosphate accounts for the high Ca/PO4 ratio of the filler (1.91 ± 0.09) determined after its dissolution in HCl.
Fig. 2.

Characteristic XRD pattern (a) and FTIR spectrum (b) of ACP filler utilized in the study.
Fig. 3.
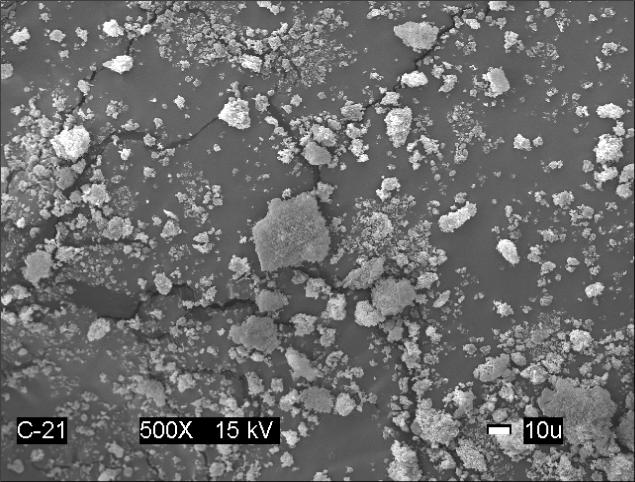
Scanning electron microphotograph of the Zr-ACP filler.
Mechanical strength of copolymers and composites
The results of the BFS testing of dry (before immersion) and wet (after 2 weeks of immersion in saline solutions) unfilled UDMA polymer, unfilled UDMA/PEG-U copolymer and composite specimens are summarized in Fig. 4. The unfilled PEG-U polymer was too compliant to measure using the BFS testing procedure. There was no significant difference between dry and wet BFS values of UDMA polymer [(68.8 ± 15.5) MPa and (65.5 ± 18.2) MPa, respectively] and the BFS of UDMA/PEG-U copolymer [(75.3 ± 7.4) MPa and (74.7 ± 12.4) MPa, respectively]. The average BFS values of dry UDMA, PEG-U and UDMA/PEG-U Zr-ACP composites were (49.1 ± 12.7) MPa, (39.4 ± 5.0) MPa and (59.6 ± 9.5) MPa, respectively. Upon soaking the BFS of these composites was reduced between 25.6 % (PEG-U) and 45.6 % (UDMA/PEG-U).
Fig. 4.

Biaxial flexure strength (BFS; mean value + SD (indicated by bar)) of dry and wet (after 2 weeks immersion in saline solutions) UDMA, PEG-U and UDMA/PEG-U copolymers and their composites. The number of runs in each experimental group n ≥ 3. Standard deviation (SD) is taken as a measure of the standard uncertainty.
The BFS of the Zr-ACP UDMA/PEG-U composite specimens that were exposed for 1200 h to the various aqueous environments is shown in Fig. 5. No difference was seen between the mean BFS values of these composites after soaking in different solutions ((43.6 ± 2.7) MPa).
Fig. 5.

BFS (mean value + SD) of wet UDMA/PEG-U Zr-ACP composites after 1200 h exposure to various aqueous environments vs. the dry control specimen. The number of runs n = 3/group. Single experiment data are shown for the saline solution as a reference point.
Water sorption of copolymers and composites
Based on the WS kinetic profiles (Fig. 6) and the maximum WS levels attained after 35 d of exposure to RH (Fig. 7) the following order of decreasing WS existed in both unfilled resin and composite systems: PEG-U > UDMA/PEG-U > UDMA. The unfilled PEG-U, UDMA/PEGU and UDMA specimens absorbed a maximum of a mass fraction of (2.31 ± 0.09) %, (1.16 ± 0.15) % and (0.85 ± 0.30) %, respectively. The corresponding composites absorbed a maximum of a mass fraction of (2.71 ± 0.29) %, (1.50 ± 0.27) % and (1.29 ± 0.15) %, respectively. The increase in the WS of composites compared to the corresponding unfilled resin specimens was statistically significant (heteroscedastic 2-tail t-test).
Fig. 6.

Water sorption (WS) kinetic profiles for UDMA and PEG-U polymers, UDMA/PEG-U copolymer and the corresponding Zr-ACP composites. The number of specimens in each group ≥ 5. The SD of the measurements was ≤ 0.30 % mass fraction.
Fig. 7.

Maximum WS values (mean + SD (indicated by bars)) of UDMA and PEG-U polymers, UDMA/PEG-U copolymer and the corresponding Zr-ACP composites attained after 35 d of exposure to 75 % relative humidity at room temperature. Number of specimens/group ≥ 5.
Ion release from composites
Kinetic profiles of Ca and PO4 released from UDMA, PEG-U and UDMA/PEG-U composites immersed in buffered saline (series I) are presented in Fig. 8. Resin matrix apparently affected the release kinetics. The PEG-U composites showed a high initial release of both Ca and PO4 that attained a maximum around 72 h followed by a significant decrease in their solution concentrations. In contrast, UDMA/PEG-U composites showed a consistent, sustained release for at least 350 h. Additionally, 24 h release data from the UDMA-PEG-U composites showed very rapid ion release in the lactic acid media compared to saline (Fig. 9). Thermodynamic calculations for the saline solutions containing maximum levels of Ca and PO4 released from all three types of composites (Table 2) reveal that the corresponding, maximum level of supersaturation with respect to stoichiometric hydroxyapatite (taken as a measure of the remineralizing capacity) in Zr-ACP/UDMA, UDMA/PEG-U and PEG-U composites was significantly above the minimum supersaturation necessary for mineral redeposition to take place (ΔG° < 0).
Fig. 8.
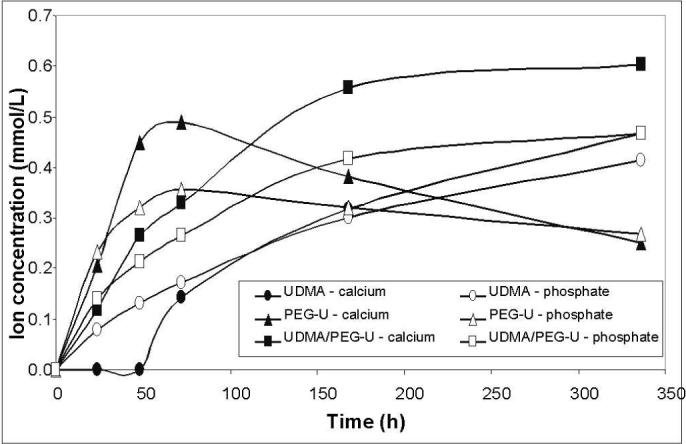
Ca and PO4 release from various composite disk specimens immersed in saline (series I). The number of runs in each experimental group n = 3. The SD ≤ 0.195 mmol/L and ≤ 0.075 mmol/L for Ca and PO4 measurements, respectively.
Fig. 9.

Comparison of early (up to 24 h) Ca and PO4 release from UDMA/PEG-U composites immersed in saline or lactic acid solutions. The number of runs in each experimental group n = 3. The SD for the Ca and PO4 measurements as reported in Fig. 8.
Table 2.
The ion activity product (IAP; mean ± SD) and the thermodynamic stability* (ΔGo, mean ± SD) of the solutions containing the maximum levels of Ca and PO4 released from ACP/UDMA, UDMA/PEG-U and PEG-U composites (calculated from the experimental kinetic data presented in Fig. 8). Negative ΔGo value indicates solution supersaturated with respect to stoichiometric hydroxyapatite. Standard deviation of values is indicated in parentheses.
| Matrix | IAP | ΔGo (kJ/mol) |
|---|---|---|
| UDMA | 108.15 (1.09) | -2.96 (0.43) |
| UDMA/PEG-U | 103.11 (1.19) | -4.49 (0.36) |
| PEG-U | 104.45 (1.43) | -4.08 (0.43) |
Results of the further evaluation (series II) of the effects of the immersion environment on the ion release from UDMA/PEG-U composites are as follows. The initial release rate was high for all four solutions, LA, LC, LT and LCT and then began to plateau at 360 h. The plateau values (averaged for (720 to 1200) h) of the released Ca and PO4 are compared in Fig. 10. Single saline experiment is added for comparison. Assuming the same level of data scattering, Ca release appears higher in all four types of lactic acid-containing media and PO4 release is higher in LA and LT environment compared to the saline systems. During the course of the ion release experiments, the composite disk specimens were weighed at the predetermined time intervals to examine the combined change in mass due to liquid sorption and ion diffusion. An initial increase in mass was observed for the first 48 h due to the liquid uptake, followed by a small decrease at (72 to 144) h. The mass values peaked between (216 to 360) h, then decreased and finally reached a steady-state (plateau) values for the remainder of the experiment [(720 to 1200) h]. Compilation of the normalized peak (the highest) mass values and the plateau mass values is provided in Fig. 11.
Fig. 10.

Maximum (plateau) levels of Ca and PO4 released from UDMA/PEG-U composites (3 repetitive samples/group) immersed in different solutions. The SD of the mean values is indicated by bar. Single experiment performed in saline.
Fig. 11.

Peak and the plateau values of the normalized mass (mean + SD) of UDMA/PEG-U composite disk specimens immersed in various soaking solutions. Single experiment performed in saline.
Intra-composite ACP to apatite conversion
The effect of fluid environment on the conversion of ACP into poorly crystalline apatite was established by XRD screening of the surfaces of UDMA/PEG-U composite specimens exposed to saline and various lactic acid solutions. The results of the XRD screening are summarized in Table 3. For saline-immersed specimens, the first sign of crystallinity was observed at 144 h. In LA medium, however, the first sign of conversion could be seen at 552 h of immersion in this low pH solution. XRD spectra of the typical ACP composite before conversion to HAP had started and the same specimen upon conversion are shown in Fig. 12. The following order of the decreasing rate of ACP to HAP conversion as a function of the type of the immersing medium could be proposed on the basis of the XRD analysis data: LCT > LC > (LT, saline) > LA.
Table 3.
Intra-composite ACP to apatite (HAP) conversion determined by XRD screening of the UDMA/PEG-U composite disk specimens at given time intervals.
| Immersing environment | Time interval (h) | |||||
|---|---|---|---|---|---|---|
| 0 | 48 | 72 | 144 | 216 | 552 | |
| Saline |
ACP |
ACP |
ACP |
HAP |
HAP |
HAP |
| Lactic acid (LA) |
ACP |
ACP |
ACP |
ACP |
ACP |
HAP |
| Lactic acid + carboxymethyl-cellulose (LC) |
ACP |
ACP |
HAP |
HAP |
HAP |
HAP |
| Lactic acid + thymol (LT) |
ACP |
ACP |
ACP |
HAP |
HAP |
HAP |
| Lactic acid + carboxymethyl-cellulose + thymol (LCT) | ACP | ACP | HAP | HAP | HAP | HAP |
Fig. 12.

XRD patterns of the composite disk specimen immersed in saline solution for 48 h and 144 h. Peaks corresponding to the formation of poorly crystalline HAP are indicated by asterisk. Sharp peaks at 2θ ∼ 38° and 2θ ∼ 44.5° are due to the aluminum holder.
DISCUSSION
Introduction of a mass fraction of 40 % of hetero-dispersed Zr-ACP filler into UDMA and UDMA/PEG-U resins reduced their BFS (dry composites) by 29 % and 21 %, and their BFS (wet composites) by 53 % and 57 %, respectively, compared to the unfilled specimens. The observed decrease in the BFS of dry composite specimens compared to the unfilled samples is lower than the drop in the BFS of similarly prepared specimens with other resin matrices based on various base monomers (Table 4). The average BFS value of wet UDMA and UDMA/PEG-U composites compares very well with the BFS of wet composite specimens based on the ACP fillers of comparable particle size distribution (dm = 4.5 to 7.2 μm) in different matrices. The reduction in the mechanical strength of ACP composites can, generally, be attributed to: 1) reduction in ACP's intactness and rigidity at the filler/matrix interface due to spatial changes that may have occurred during the calcium/phosphate ion efflux, internal ACP to apatite conversion, or excessive water absorption. The fact that, after aqueous immersion, relative reduction in the BFS compared to unfilled specimens was practically independent of matrix composition, would suggest that it is the filler's size distribution that controls the composite's susceptibility to softening after water exposure.
Table 4.
Average reduction in the mechanical strength of Zr-ACP composites relative to the unfilled copolymer/polymers specimens, maximum water sorption (WS) of composites and the attained remineralization potential/thermodynamic stability of immersing solutions. Comparison of the UDMA and UDMA/PEG-U matrices with previously evaluated Bis-GMA*-, UDMA**- and EBPADMA***-based resins. Standard deviation of values is indicated in parentheses.
| Resin matrix | BFS reduction (%) | WS (% mass fraction) | ΔGo (kJ/mol) | Reference | |
|---|---|---|---|---|---|
| Dry | Wet | ||||
| UDMA & UDMA/PEG-U |
24.8 |
54.7 |
1.29 − 1.50 |
3.52 (0.79) |
this work |
| Bis-GMA based |
58.6 |
66.0 |
3.09 (0.81) |
5.59 (0.59) |
18 |
| EBPADMA based |
46.2 |
57.8 |
2.86 (0.61) |
7.13 (0.85) |
13, 18, 20 |
| UDMA based | 63.0 | 56.5 | 2.80 (0.46) | 5.72 (0.86) | 18 |
2,2-bis[p-(2′-hydroxy-3′-methacryloxypropoxy)phenyl]propane (Bis-GMA) combined with 2-hydroxyethyl methacrylate (HEMA), hexamethylene dimethacrylate (HmDMA) and triethyleneglycol dimethacrylate (TEGDMA).
Ethoxylated bisphenol A dimethacrylate (EBPADMA) combined with HEMA, HmDMA and TEGDMA.
Urethane dimethacrylate (UDMA) combined with HEMA, HmDMA and TEGDMA or HEMA, TEGDMA and methacryloyloxyethyl phthalate.
Water sorption (WS) by dental composites is generally controlled by the resin matrix [13]. Hydrophilic ACP filler in the composites, however may significantly increase the amount of water absorbed [14]; its effect is proportional to its mass fraction in the composite. The lack of intimate contact between the coarse ACP particles and the UDMA and/or UDMA/PEG-U resin matrix is most likely the critical factor that governs water diffusion and hydration of ACP surfaces. The observed increase in WS ((17 to 52) % depending on the matrix) of ACP composites vs the unfilled resin matrices shows the effect of the hydrophilic ACP and possible interphase differences in these specimens. Existence of numerous voids at the ACP filler/ BisGMA-based resin interface was experimentally documented by FTIR microspectroscopy [15]. It has also been shown that these processes were inhibited or reduced in composites with milled ACP filler [16]. Studies of Bis-GMA-based resin composites [17-19] emphasized the effects of prolonged exposure to aqueous environments on their fracture toughness, elastic modulus, hardness and flexural strength. Water sorption/desorption studies and an extensive mechanical study may be needed in future to establish if similar correlation(s) exist in the UDMA and UDMA/PEG-U resin composites.
We have previously shown that ion release from the coarse ACP-filled composites may be dramatically affected by the chemical structure and the composition of the monomer system and, to much lesser extent, by the type of ACP filler (i.e., silica or zirconia hybridized vs. unhybridized ACP) [20-22]. The anti-demineralizing/remineralizing potential of these composites was enhanced by introducing ethoxylated bisphenol A dimethacrylate (EBPADMA) as a base monomer or including high levels of HEMA in the resin formulation [23]. Higher ion releases obtained with these particular monomers were attributed to EBPADMA's tendency to form more flexible and open cross-linked polymeric networks along with the hydrophilic HEMA's potential for promoting water uptake and mineral saturation. Despite the moderate reduction in the attained levels of Ca and PO4 released from the ACP/UDMA composites compared to UDMA/PEG-U and/or PEG-U composites, their remineralizing potential (Table 2 and 3) remained high enough for the subsequent apatite deposition to occur (apatite formation was confirmed at 336h, Fig. 10). Resin matrices utilized in this study had, on average, lower potential for the formation of apatite compared to Bis-GMA, EBPADMA and UDMA composites formulated primarily for dental applications.
The overall effects the different resin composition has on the kinetics of Ca and PO4 release from the composites (series I) remain unexplained. We can only speculate that the high initial release rate from the PEG-U composites is due to the hydrophilic and relatively low cross-link density of the polymer. The increased water sorption of this polymer (the maximum WS of PEG-U composites is 81 % higher than the WS of UDMA/PEG-U composites and 110 % higher than the WS of UDMA composites) presumably accelerates the ACP conversion and, in turn, leads to the internal redeposition of apatite – evident as a significant drop in both, Ca and PO4 concentration.
Unlike the mass data for the specimens exposed to saline, the composites immersed in either of four lactic acid solutions (series II) showed a substantial decrease in their mass with time (peak vs. plateau values, Fig. 11). That decrease was larger in LA and LT solutions compared to LC and LCT solutions. At the later stage of immersion the mass decrease results from ion release, therefore, highest ion release should be expected with LA and LT solutions, as indeed was observed in Fig. 10. Another important parameter that may affect the ion release kinetics and/or the ACP to HAP conversion seems to be the microbial contamination. For example, the LC solutions showed evidence of contamination at the early stages of the immersion experiments, followed – in chronological order – by LA, LCT and LT solutions. Thymol was added to the solutions to inhibit bacterial growth. The bacterial contamination may lead to changes in pH but no evidence was found that the changes in the pH of the environment had systematically influenced the ion release.
In conclusion, this study reveals that the variations in the fluid environment composition/conditions strongly affect the kinetics of the ion release from composites. Increased hydrophilicity of the resins results in increased water sorption and, in turn, accelerates ACP's intra-composite conversion to HAP.
Acknowledgement
This research was supported by FDA, NIST, ADAF and the National Institute of Dental and Craniofacial Research (Interagency Agreement Y1-DE-1021-04; grant R01 DE13169-07). We gratefully acknowledge generous contribution of the monomers from Esstech, Essington, PA. We also acknowledge the assistance of Dr. C.M. Guttman in determining the average molecular mass of the oligomer, PEG-U, by mass spectrometry.
Footnotes
“Official contribution of the National Institute of Standards and Technology; not subject to copyright in the United States”
Disclaimer: Certain commercial materials and equipment are identified in this work for adequate definition of the experimental procedures. In no instance does such identification imply recommendation or endorsement by FDA, NIST or ADAF, or that the material and the equipment identified is necessarily the best available for the purpose.
References
- 1.GANTA SR, PIESCO NP, LONG P, GASSNER R, MOTTA LF, PAPWORTH GD, STOLZ DB, WATKINS SC, AGARWAL S. J. Biomed. Mater. Res. 2003;64A:242. doi: 10.1002/jbm.a.10402. [DOI] [PMC free article] [PubMed] [Google Scholar]
- 2.BUTTERFIELD M, WHEATLEY DJ, WILLIAMS DF, FISHER J. J. Heart Valve Dis. 2001;10(1):105. [PubMed] [Google Scholar]
- 3.REGNAULT WF, FITZGERALD RM, ANTONUCCI JM, SKRTIC D. Polym. Preprints. 2004;45(2):407. [Google Scholar]
- 4.ICENOGLE TB, REGNAULT WF, ANTONUCCI JM, SKRTIC D. Polym. Preprints. 2005;46(2):693. [Google Scholar]
- 5.EANES ED. Amorphous calcium phosphate: Thermodynamic and kinetic considerations. Kluwer Academic Publ.; Boston: 1998. p. 21. [Google Scholar]
- 6.BLUMENTAL NC. Clin. Orthopaedics & Rel. Res. 1989;247:279. [Google Scholar]
- 7.RICH J, TUOMINEN J, KYLMA J, SEPPALA J, NAZHAT SN, TANNER KE. J. Biomed. Mater. Res. 2002;63(3):346. doi: 10.1002/jbm.10232. [DOI] [PubMed] [Google Scholar]
- 8.TAI NR, SALACINSKI HJ, EDWARDS A, HAMILTON G, SEIFALIAN AM. Br. J. Surg. 2000;87(11):1516. doi: 10.1046/j.1365-2168.2000.01566.x. [DOI] [PubMed] [Google Scholar]
- 9.VOGEL GL, CHOW LC, BROWN WE. Caries Res. 1983;7:23. doi: 10.1159/000260645. [DOI] [PubMed] [Google Scholar]
- 10.MURPHY J, RILEY JP. Anal Chim Acta. 1962;27:31. [Google Scholar]
- 11.FARAHANI M, WALLACE WE, ANTONUCCI JM, GUTTMAN CM. J. Appl. Polym. Sci. 2006;99:1842. [Google Scholar]
- 12.ASTM F394−78 (re-approved 1991)
- 13.VENZ S, DICKENS B. J. Biomed. Mater. Res. 1991;25:1231. doi: 10.1002/jbm.820251005. [DOI] [PubMed] [Google Scholar]
- 14.SKRTIC D, ANTONUCCI JM. Biomaterials. 2003;24:2881. doi: 10.1016/s0142-9612(03)00119-4. [DOI] [PubMed] [Google Scholar]
- 15.SKRTIC D, ANTONUCI JM, EANES ED, EIDELMAN N. Biomaterials. 2004;25:1141. doi: 10.1016/j.biomaterials.2003.08.001. [DOI] [PubMed] [Google Scholar]
- 16.SKRTIC D, LEE SY, ANTONUCCI JM, LIU DW. Key Eng. Mater. 2005;284−286:737. [Google Scholar]
- 17.FEILZER AJ, DeGEE AJ, DAVIDSON CL. J. Dent. Res. 1991;69:36. doi: 10.1177/00220345900690010501. [DOI] [PubMed] [Google Scholar]
- 18.SARRETT DC, RAY S. Dent. Mater. 1994;10:5. doi: 10.1016/0109-5641(94)90015-9. [DOI] [PubMed] [Google Scholar]
- 19.FERRACANE JL, BERGE XH, CONDON JR. J. Biomed. Mater. Res. 1998;42:465. doi: 10.1002/(sici)1097-4636(19981205)42:3<465::aid-jbm17>3.0.co;2-f. [DOI] [PubMed] [Google Scholar]
- 20.SKRTIC D, ANTONUCCI JM, EANES ED, EICHMILLER FC, SCHUMACHER GE. J. Biomed. Mater. Res. (Appl. Biomater.) 2000;53:381. doi: 10.1002/1097-4636(2000)53:4<381::aid-jbm12>3.0.co;2-h. [DOI] [PubMed] [Google Scholar]
- 21.SKRTIC D, ANTONUCCI JM, EANES ED. J. Res. Natl. Inst. Stands. Technol. 2003;108:167. doi: 10.6028/jres.108.017. [DOI] [PMC free article] [PubMed] [Google Scholar]
- 22.SKRTIC D, ANTONUCCI JM, EANES ED. Polym. Adv. Technol. 2001;12:369. [Google Scholar]
- 23.ANTONUCCI JM, SKRTIC D. J. Bioact. Compat. Polym. 2005;20:29. doi: 10.1177/0883911506064476. [DOI] [PMC free article] [PubMed] [Google Scholar]