Abstract
A question often posed in protein folding/unfolding studies is whether the process is fully cooperative or whether it contains sequential elements. To address this question, one needs tools capable of resolving different events. It seems that, at least in certain cases, two-dimensional (2D) IR correlation spectroscopy can provide answers to this question. To illustrate this point, we have turned to the Cro-V55C dimer of the λ Cro repressor, a protein known to undergo thermal unfolding in two discrete steps through a stable equilibrium intermediate. The secondary structure of this intermediate is compatible with that of a partially unfolded protein and involves a reorganization of the N terminus, whereas the antiparallel β-ribbon formed by the C-terminal part of each subunit remains largely intact. To establish whether the unfolding process involves sequential events, we have performed a 2D correlation analysis of IR spectra recorded over the temperature range of 20–95°C. The 2D IR correlation analysis indeed provides evidence for a sequential formation of the stable intermediate, which is created in three (closely related) steps. A first step entails the unfolding of the short N-terminal β-strand, followed by the unfolding of the α-helices in a second step, and the third step comprises the reorganization of the remaining β-sheet and of some unordered segments in the protein. The complete unfolding of the stable intermediate at higher temperatures also undergoes sequential events that ultimately end with the breaking of the H bonds between the two β-strands at the dimer interface.
It is commonly assumed that the protein-unfolding process is a fully cooperative event when different probes for secondary and/or tertiary structure have identical unfolding curves. However, it is imaginable that the probes used to monitor this phenomenon are not always sensitive enough to detect minor noncooperative events or closely related changes introduced sequentially into the unfolding process. The detection of such sequential events might help us to understand the folding/unfolding mechanism in proteins, because intermediate states play an important role in the protein-folding puzzle (1, 2). Kinetic intermediates have been observed for a number of proteins on folding but seldom on unfolding. Stable species that exist under equilibrium conditions with the native state slightly destabilized, such as in molten globules, are attractive, because such species provide information on the structure and the forces involved in stabilizing the intermediate (3).
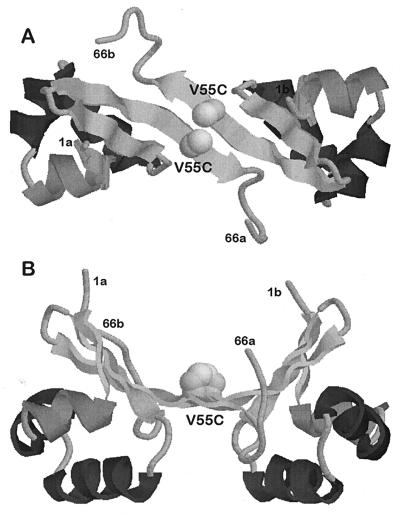
The λ Cro repressor of the bacteriophage λ, a small DNA-binding protein, is one of the rare proteins whose unfolding proceeds through stable equilibrium intermediates. In the active state of the λ Cro repressor protein, two monomeric units, each 66 amino acids long, form a dimer by aligning the C termini of each monomer (4, 5). This alignment allows the formation of an antiparallel β-ribbon across the dimer. The N-terminal parts form small globular subdomains that consist of three α-helices and a short N-terminal β-strand connected to the β-ribbon. The engineered λ Cro repressor variant, in which Val-55 is replaced by Cys (Cro-V55C), spontaneously forms a disulfide cross-link between the protein subunits in the dimer (see Fig. 1). This disulfide bridge does not perturb the basic Cro repressor fold (6) but increases the thermal stability of the protein. Furthermore, the crosslink also induces a two-step unfolding through a highly populated and stable intermediate state (7, 8). Concentration-dependent scanning calorimetry profiles show that the first thermal transition of Cro-V55C is accompanied by an oligomerization of the covalently cross-linked dimers. Conventional Fourier transform IR and dynamic light-scattering experiments showed that the first thermal transition of the Cro-V55C dimer involves the unfolding of the three α-helices and the short β-strand in the N-terminal part of the protein (9). The intermediate has a well structured intermolecular β-sheet domain still formed by the C-terminal parts of each polypeptide chain and associates in a tetrameric structure. This stable intermediate unfolds during a second thermal transition at higher temperatures, a process that is also accompanied by the dissociation of the tetramers.
Figure 1.
Structure of the λCro repressor V55C variant (Val in position 55 replaced by Cys), based on the structure of the wild-type dimer. B shows a 90° rotation of A. The sites of amino acid substitution are indicated by spheres. The orientation of the two cysteine residues in Cro V55C allows the formation of a disulfide bridge. Coordinates for the wild-type protein were taken from Matsuo et al. (5).
Herein, we report the results of a two-dimensional (2D) correlation analysis performed on the IR spectra of Cro-V55C as a function of temperature, by using the generalized 2D correlation procedure of Noda (10). This approach provides a sensitive means of detecting a potential sequence of events in response to changes induced by external perturbing factors, such as temperature. Our analysis provides direct evidence for sequential events in the formation and also the unfolding of the stable intermediate.
Materials and Methods
IR Spectroscopy.
Details regarding the sample preparation and the recording of IR spectra have been described (9). IR experiments were carried out with a 16-mg/ml Cro-V55C solution (containing 10 mM sodium cacodylate in 2H2O, pH 4.0) after hydrogen deuterium exchange was complete. Spectra at discrete temperatures were obtained by heating the protein solution from 20°C to 95°C in steps of 5°C. Buffer spectra were recorded under identical conditions and subtracted from the protein spectrum at the same temperature. In addition, residual water vapor was subtracted from each spectrum by using a set of water-vapor spectra as described (11), a critical step when deriving protein structures from the analysis of IR spectra in this spectral region.
2D Correlation Analysis.
Synchronous and asynchronous correlation intensities were computed for the IR spectra at different temperatures by applying the generalized 2D correlation algorithm of Noda (10). Although it was possible to obtain 2D correlation plots from the original spectra, we took advantage of the beneficial effects of resolution enhancement obtained by band narrowing. The IR spectra selected for the 2D correlation analysis were Fourier self-deconvolved before the actual analysis was performed. We have tested a range of resolution enhancement parameters (k) from k = 1.4 to k = 2.2, which resulted in remarkably reproducible 2D correlation plots. The plots shown here were all generated with the standard parameters of k = 1.8 and a half bandwidth of 16 cm−1 by using the region 1,590–1,710 cm−1 with mean spectra as reference or without generating a particular reference spectrum at all (winir-pro software, Bio-Rad). The 2D IR correlation plots were rotated 180° to meet the representation of IR spectra recommended by International Union of Pure and Applied Chemistry (increasing wavenumbers from left to right and from bottom to top) and should therefore be read starting on the right side from the diagonal axis (12).
Results and Discussion
Unfolding of the Cro Repressor Dimer.
Based on scanning calorimetry and circular dichroism experiments (7), the heat-induced denaturation of Cro-V55C was approximated initially by a sequential three-state model: N2 ⇌ I2 ⇌ U2. Later, it was shown (8) that the intermediate state of Cro-V55C can be approximated more accurately by assuming the formation of a tetramer (2 N2 ⇌ I4 ⇌ 2 U2), a conclusion recently corroborated by dynamic light-scattering experiments (9).
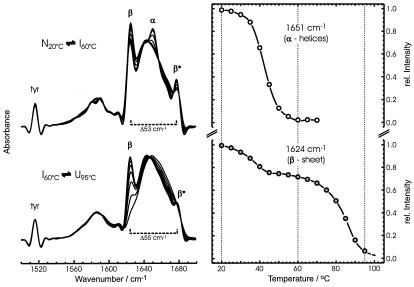
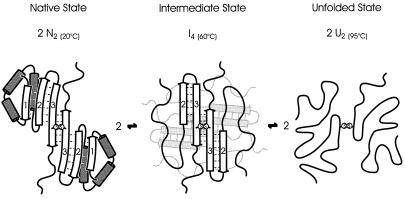
Stacked IR spectra, starting with the spectrum of the native protein (at 20°C), through the stable intermediate (at 60°C), and onto the fully unfolded state of Cro-V55C (at 95°C), are shown in Fig. 2. The spectrum of the native protein is dominated by three bands in the secondary structure-sensitive amide I region: bands at 1,624 (β) and 1,677 cm−1 (β*) that affirm the presence of antiparallel β-strands and a band at 1,651 cm−1 that indicates the presence of α-helical structures. The α-helical band disappears in the spectrum of the protein at 60°C, which is now dominated by a band at 1,642 cm−1, typical of irregular polypeptide chains. The fraction of structure versus temperature plotted in Fig. 2 shows that the first thermal transition involves a complete unfolding of the α-helices. In contrast, the characteristic β-sheet bands show only partial loss of intensity in the spectrum at 60°C, indicating that only part of the native β-sheets unfold between 20°C and 60°C. Assuming that the β-ribbon in Cro-V55C contains the same amino acid residues as in the wild-type protein, residues 3–6, 40–45, and 50–55 are forming the three β-strands. Because the first thermal transition involves a complete unfolding of the α-helices in the N-terminal domain, it is quite likely that this transition also causes the short N-terminal β-strand (residues 3–6) to become detached from the β-sheet. This process would affect about 30% of all residues in the β-ribbon, which is in excellent agreement with what can be derived from the intensity loss (25–33%) of the β-sheet “marker bands” at 1,624 and 1,677 cm−1 (9). We therefore conclude that the intermediate state retains the intermolecular β-sheet domain between the two C-terminal β-strands, implying that the β-strand composed of residues 40–45 remains intact. The overall hydrogen-bonding pattern, however, is affected by the unfolding of the N-terminal domains, as indicated by the small but significant increase in the splitting between the low and high frequency components (β and β*, respectively) of the antiparallel β-sheet bands (53 cm−1 at 20°C vs. 55 cm−1 at 60°C). These spectroscopic changes suggest that, in the stable intermediate, the remaining β-sheets experience slightly stronger hydrogen bonding, possibly induced by leveling the distorted sheet conformation into a more planar arrangement. It may also suggest that the formation of a tetrameric intermediate stabilizes the modified β-ribbon structure by realigning exposed hydrophobic parts between the two dimers. The β-sheets that remain in the stable intermediate start to unfold only at relatively high temperatures (above 70°C; see Fig. 2). When the thermal denaturation is complete (at 95°C), the spectrum shows a broad, featureless amide I band contour, typical of irregular protein structures. A pictorial representation of this process is shown in Fig. 3, which includes the tetrameric association in the intermediate state whose tertiary structure has not yet been solved. The IR spectrum obtained after cooling the protein from 95°C down to 20°C was practically identical with that at 20°C before heating (9), indicating that no irreversible aggregation occurs on thermal unfolding of Cro-V55C. Similar experiments were performed on the wild-type protein, but its thermal denaturation typically leads to the formation of the unfolded form without expressing a stable, partly unfolded intermediate. Moreover, the thermal denaturation of the wild-type protein can lead to irreversible aggregation (9).
Figure 2.
(Left) IR spectra of Cro-V55C as a function of temperature, from the native structure (at 20°C), through the intermediate state (at 60°C), to the heat-denatured state (at 95°C). Spectra are shown after band narrowing by Fourier self-deconvolution (band-narrowing factor k = 2 and a half bandwidth of 16 cm−1). (Right) Intensity vs. temperature plot of the 1,651-cm−1 band, reflecting the unfolding of the α-helices (Upper), and of the band at 1,624 cm−1, reflecting the two-step unfolding of the β-sheets (Lower).
Figure 3.
Pictorial description of the sequential unfolding of the Cro-V55C repressor protein. Two units of the covalently connected dimer (2 N2) form an intermediate complex of two associated dimers (I4) and dissociate into two unfolded dimers (2 U2) connected by a disulfide bridge. This process is fully reversible when refolding is induced. The quaternary structure of I4 (the orientation of the two dimers relative to one another) is currently unknown.
2D IR Correlation Analysis of the Protein Unfolding Process.
The 2D correlation methodology for an analysis of IR spectra (or other types of spectra) was developed initially by Noda (10) and then advanced in multiple steps to a more generalized mathematical application. The 2D IR methodology was developed to emulate techniques currently used in NMR. However, vibrational relaxation rates are orders of magnitude faster than typical spin relaxation rates (picoseconds compared with microseconds), and therefore, ordinary IR spectrometers cannot provide the rapid excitation and detection necessary for such experiments. To generate 2D IR correlation spectra, a much slower relaxation process must be introduced to perturb the molecular system of interest. The present 2D IR correlation approach exploits deviations of spectral intensities from an expected value when IR spectra collected sequentially as a function of a perturbing parameter (in our case, temperature) are compared at two discrete and independent wavenumbers. This comparison is achieved by Fourier transforming the temperature variable as shown in Eq. 1, following the nomenclature of Noda with t replaced by T (10):
 |
1 |
This transformation is followed by calculating the correlation between Y(ν1,ω) and Y*(ν2,ω) as shown in Eq. 2, where ν and ω are the spectral and the Fourier frequencies, respectively, T the temperature, and y (ν, T) the dynamic intensity fluctuations:
 |
2 |
The real part of the correlation intensity, Φ(ν1, ν2), is the synchronous part of the correlation intensity, and the imaginary part, Ψ(ν1, ν2), is the asynchronous part of the correlation intensity. Each of the two parts of the correlation intensity can be plotted as a contour over the ν1,ν2 plane.
The synchronous 2D IR correlation plot recognizes the similarity between the variations of spectral intensities to a perturbation, whereas the asynchronous 2D IR correlation plot detects differences between the variations of spectral intensities. Although the synchronous spectrum is always required for interpretation, the asynchronous spectrum is of particular interest, because it permits the distinction of spectral intensity changes that occur out-of-phase (that is, delayed or accelerated), as a function of the applied perturbation (in our case, temperature). Similar 2D plots were used previously to illustrate the chain of events in the dissociation of amide hydrogen bonds in N-methylacetamide (13), to improve the resolution of individual band components in the spectrum of myoglobin (14), to resolve the temperature-dependent spectra of helix-forming peptides (15), and to detect sudden changes in the hydration of ovalbumin that precede the unfolding of the protein (16). Very recently, Hochstrasser et al. (17) reported a different form of 2D (nonlinear) IR spectroscopy in which perturbations to the system are introduced by ultrafast IR laser pulses, allowing the detection of ultrafast vibrational relaxation times in small model peptides, an approach more akin to 2D NMR.
Formation and Unfolding of the Stable Intermediate.
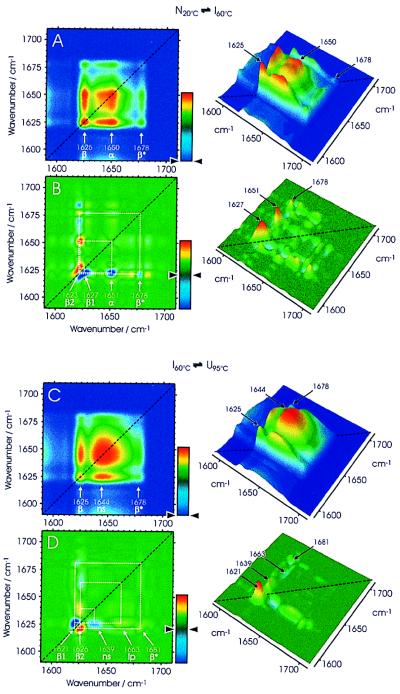
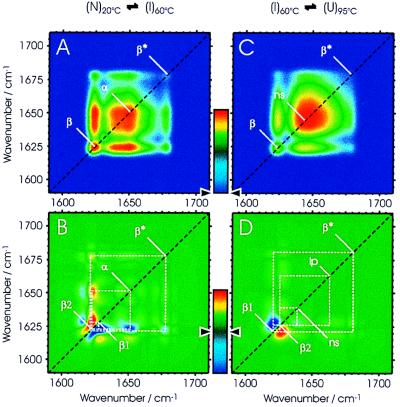
Fig. 4 shows synchronous (Fig. 4 A and C) and asynchronous (Fig. 4 B and D) 2D IR correlation plots of the formation and unfolding of the intermediate. IR spectra were separated into two sets (see Fig. 2), one covering the temperature interval 20–60°C (Fig. 4 A and B) and a second one covering the interval 60–95°C (Fig. 4 C and D). In the synchronous 2D IR plot in Fig. 4A, which delineates the formation of the stable intermediate, there are two prominent auto peaks on the diagonal at 1,625 (β) and 1,650 cm−1 (α) and a weak auto peak at 1,678 cm−1 (β*), thus identifying the changes that occur simultaneously in the secondary structure during unfolding of the native protein. The synchronous plot shows only positive cross peaks (colored from green to yellow to red), which means that all peak intensities are changing in the same (positive) direction. This plot is in good agreement with the spectroscopic data shown in Fig. 2 and substantiates the fact that in the synchronous plot the formation of the intermediate is apparent as the disappearance of prominent features of the native state (unfolding of the α-helices and of some β-sheets). A similar picture emerges from the synchronous 2D IR plot shown in Fig. 4C—this time for the unfolding of the intermediate. Only a single broad auto peak at 1,644 cm−1 is observed, which reflects the unfolding of non-β-sheet structures. There are also two positive cross peaks to a significant auto peak at 1,625 cm−1, indicating synchronous changes in the residual β-sheet of the intermediate. The weak positive cross peaks in the synchronous plots connecting the bands at 1,625 and 1,678 cm−1 indicate that the two features are interconnected. Essentially, no additional information is gained from the synchronous plots when compared with the conventional analysis of IR spectra described earlier. New information, however, is obtained from the analysis of the asynchronous plots.
Figure 4.
The 2D correlation analysis of the IR spectra of Cro-V55C between 20°C and 60°C (A, synchronous; B, asynchronous plots) and of spectra between 60°C and 95°C (C, synchronous; D, asynchronous plots). The correlation plots are represented as 2D color intensity maps (Left) and also as pseudo-3D maps (Right) with the following color coding: blue, set to zero in the synchronous plots; green, set to zero in the asynchronous plots (see color bars). β and β*, the low and high frequency components, respectively, of the antiparallel β-sheet band; α, α-helices; ns, non-β-sheet structures; lp, loop structures.
If one were to assume that the secondary structures in the native protein (2 N2) all change simultaneously to form the intermediate I4 and that the same process holds true for the unfolding I4 → 2 U2, then no cross peaks should appear in the corresponding asynchronous correlation plots. This hypothetical scenario does not apply because both asynchronous 2D IR correlation plots (Fig. 4 B and D) contain a number of distinctive features, suggesting that both the formation and the unfolding of the stable intermediate involve sequential events. As mentioned earlier, cross peaks between two spectral features can develop only when their intensities vary out-of-phase. The presence of a number of cross peaks in the asynchronous 2D correlation spectrum in Fig. 4B indeed indicates that different parts of the secondary structure of Cro-V55C must respond differently during the partial unfolding of the dimer. The elongated cross peaks in the range of 1,620–1,632 cm−1 (normally two distinct circular peaks when there are only two bands) suggest multiple band components and reflect the involvement of different β-strands in the unfolding and reorganization of the β-ribbon. In addition, one of the bands at 1,623 cm−1 has a strong pair of cross peaks with the band at 1,651 cm−1, which is typical for α-helices. Because there are no cross peaks for the α-helices, the three α-helices appear very similar (at least spectroscopically) and seem to unfold simultaneously in one step. Information extracted from the plot shown in Fig. 4B allows a detailed view of the formation of the stable intermediate. The sign of the cross peaks in the asynchronous plot indicates that a β-sheet component at 1,627 cm−1 starts the unfolding, which is then closely followed by the unfolding of the α-helices as revealed by a cross peak at 1,651 cm−1. In a third step, a different β-sheet component at 1,623 cm−1 concludes the process, leading to the formation of the stable intermediate. This third step indicates a reorganization of the β-sheet, which could also involve the formation of the proposed tetrameric structure I4.
A different picture emerges for the unfolding of the intermediate I4 − 2 U2 at higher temperatures. In the asynchronous plot in Fig. 4D, there are four prominent cross peaks: two β-sheet components (at 1,621 and 1,626 cm−1) and two broad cross peaks of unordered structures (centered at 1,639 cm−1). Again, the elongated shape of the β-sheet cross peaks suggests that there are two components that respond differently to the unfolding of the intermediate. Interestingly, the sign of the two cross peaks is reversed from that in the asynchronous plot for the formation of the intermediate (Fig. 4, compare B and D). This reversal indicates that the β-sheet component with the band at 1,621 cm−1 unfolds earlier than the component with the band at 1,626 cm−1 and suggests that the stronger part of the β-sheet (lower wavenumber) unfolds slightly before the weaker part of the β-sheet (higher wavenumber). In addition, the non-β-sheet structure represented by two cross peaks at 1,639 cm−1 correlates with negative signs (in dark blue) with one of the β-sheet bands at 1,626 cm−1, leading to the conclusion that it unfolds slightly after the first β-sheet component. Furthermore, there is neither an auto peak nor a cross peak at 1,651 cm−1, a result that agrees with the lack of α-helices in the stable intermediate.
Simulating the Formation and Unfolding of the Stable Intermediate.
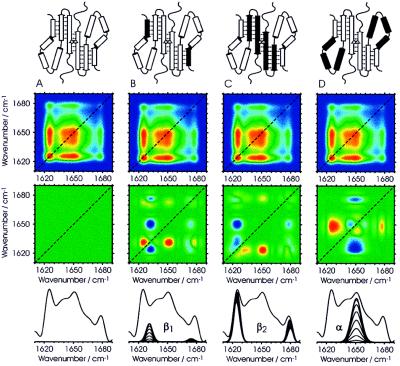
Though a visual inspection of the asynchronous 2D IR correlation plots in Fig. 4 provides clear evidence for sequential events with respect to the involvement of different structural elements, this evidence would be more convincing if it were validated by other means. To substantiate the interpretation of the experimental 2D IR data, therefore, we simulated 2D IR correlation plots that generate auto peaks and cross peaks for single and multiple sequential events, based on IR spectra fitted with known band compositions. The simulations are based on the fact that IR bands within the amide I band contour are related to a particular secondary structure. Individual bands can then be introduced earlier or later in the two-state unfolding process, thus simulating an earlier or a later disappearance of certain secondary structures. This process is illustrated in Fig. 5 for a number of simple scenarios that approximate the formation of the stable intermediate (all based on a two-state model). The model in Fig. 5A assumes fully cooperative changes and was generated by simultaneously changing the intensities of all bands. Whereas the simulated synchronous plot (blue background) is almost identical to the experimental synchronous plot in Fig. 4A, the simulated asynchronous plot (green background) shows no cross peaks at all, a feature that would be typical for fully cooperative transitions (10). The models in Fig. 5 B–D simulate different noncooperative events obtained by shifting the unfolding process of the small β-sheet (I1,625 cm−1), the larger β-sheet (ν1,624 cm−1), and the α-helices (I1,651 cm−1) by 0.3°C ahead of the main transition. The similarity of all simulated synchronous 2D IR correlation plots (Fig. 5 Top) with the experimental data reveals that small out-of-phase variations do not affect the synchronous 2D IR plot significantly. Minor out-of-phase changes, on the other hand, have a dramatic impact on the asynchronous 2D IR correlation plots as seen in Fig. 5 (Bottom). The history of events can then easily be obtained from these simulations and compared with the 2D IR correlation obtained from the experimental data. The introduction of two bands (at 1,632 and 1,675 cm−1), set 0.3°C ahead of the main unfolding, causes a variety of cross peaks to appear in the asynchronous plot (see Fig. 5B). Because red cross peaks indicate positive correlations (an earlier event) and blue cross peaks negative correlations (a later event), the following conclusions can be inferred directly from the asynchronous 2D IR plot in Fig. 5B: (i) the negative correlation of the β-sheet band at 1,625 cm−1 with the band at 1,632 cm−1 identifies the latter as the earlier event; (ii) the positive correlation of this band with the α-helix band at 1,651 cm−1 validates the fact that this β-sheet band is the earlier event. A similar chain of events can also be derived for the second β-sheet band at 1,675 cm−1. The other two scenarios illustrate a similar approach of simulating changes in the bands of the intermolecular β-sheet (Fig. 5C) and the α-helices (Fig. 5D). In both models, the events were set to precede the main transition by 0.3°C. Again, the asynchronous spectra have a variety of cross peaks, indicating correlations between different secondary structures, which can then be used to establish the same chain of events that were set in the models. These simulations help us to understand the effect of single and multiple changes in secondary structure during the process of protein unfolding.
Figure 5.
Computed synchronous plots (panels with blue background) and asynchronous plots (panels with green background) obtained by simulating the spectral changes that occur during the formation of the stable intermediate assuming that there is a fully cooperative change of all band components (A), that the minor β-strand unfolds before the major part of the structure unfolds (B), that structural changes in the major β-sheet precede the overall unfolding (C), and that the disruption of the secondary structure starts with unfolding of the α-helical domain (D). Individual band components were obtained by curve fitting the experimental spectra. Segments marked in black in the pictorial description (Top) and in the stacked plots (Bottom) identify those secondary structure elements that were assumed to respond out-of-phase (i.e., earlier) during the simulated unfolding process.
Fig. 6 shows the simulated synchronous (Fig. 6 A and C) and asynchronous (Fig. 6 B and D) 2D IR correlation plots of the formation and the unfolding of the stable intermediate, based on multiple changes in secondary structure. These plots are to be compared directly with the experimental data shown in Fig. 4 and can therefore be translated into structural changes that occur with the protein. Thus, at least two β-strands per Cro repressor monomer respond differently to an increase in temperature during the transformation of the native protein into the stable intermediate, as seen in the asynchronous spectrum in Fig. 6B. Two low-frequency (1,624 and 1,632 cm−1) and two high-frequency bands (1,673 and 1,678 cm−1) were used to simulate the experimentally observed changes in the antiparallel β-strands of the β-ribbon. In addition, it was necessary to add a band at 1,650 cm−1 to simulate the contribution of the α-helical structure and to match the single cross peak in the experimental 2D IR correlation plot. The simulated single-structure changes shown in Fig. 5 B–D were all included in the complete simulation of events that lead to the formation of the stable intermediate. Although the simulated asynchronous plots in Fig. 5 B and D (Bottom) closely resemble the experimental data shown in Fig. 4, the signs of all cross peaks in Fig. 5C are reversed, meaning that the changes in the intermolecular β-sheet are induced only after the main transition and not before. On the other hand, the signs in the asynchronous plots of Fig. 5 B and D match the experimental data, thus placing these events before the main transition. The overall picture of the formation of the stable intermediate (based on the simulation in Fig. 6B) is that the transition is a three-step process. It starts with the unfolding of the short N-terminal β-strand (loss of intensity at 1,632 cm−1), closely followed by the unfolding of the α-helices (loss of intensity at 1,650 cm−1), and ends with the rearrangement of the remaining β-sheet (simulated by changing the intensity and shifting the band at 1,624 cm−1).
Figure 6.
Synchronous (A) and asynchronous (B) 2D IR correlation plots simulating the transition from the native to the stable intermediate state of the protein and synchronous (C) and asynchronous (D) 2D IR correlation plots simulating the unfolding of the intermediate state. For the simulation of the final 2D IR correlation plots, five bands were shifted relative to the first transition [1,632 and 1,674 cm−1 (−0.6°C); 1,650 cm−1 (−0.3°C); 1,624 and 1,678 cm−1 (+0.3°C)], and three bands were shifted relative to the second transition [1,623 cm−1 (−0.6°C); 1,639 cm−1 (−0.3°C); 1,625 cm−1 (+0.3°C)].
An analogous analysis was performed for the unfolding of the intermediate (compare Fig. 4D with Fig. 6D). To optimize the match between the simulated plot and the experimental data, we had to use two closely spaced band components, centered at 1,624 cm−1, whereby one of these (the lower frequency components at 1,622 cm−1) preceded the main unfolding. Because the latter represents the stronger β-strand component, it is suggested here that the disulfide bridge stabilizes the weaker β-strands interconnecting the dimer and that the unfolding of the stable intermediate starts with the stronger β-strand. The asynchronous plot of the unfolding of the intermediate (Fig. 6D) also suggests that changes in non-β-sheet structures (the band at 1,639 cm−1) precede the main unfolding event, leading to the conclusion that the unfolding of the stable intermediate begins with the stronger β-strand (residues 40–45), followed by changes in non-β-sheet structures, and is completed finally by breaking the interconnecting β-strand (residues 50–55).
Conclusions and Perspectives.
What have we learned from the 2D correlation analysis of the IR spectra of the engineered Cro repressor protein? This study revealed that the engineered Cro repressor protein can form a stable intermediate only after certain secondary structures changed first, indicating that the transitions do not occur in a single step. Obviously, there may be weaker (and stronger) parts in a highly folded protein that can cause a sequential breakdown of the native secondary structure. It can be speculated that, with the wild-type Cro repressor protein, a partly unfolded intermediate, similar to that observed with the cross-linked protein, is also formed temporarily but that it is not stabilized during the transition from the folded to the thermally denatured state. The ability of the 2D IR methodology to detect small differences in individual spectral features and to determine the sequence of events in response to external factors that perturb the protein structure is very attractive for the analysis of unfolding/folding events. It may help us to understand where the process begins and how it proceeds and thus provide new information on an old problem of protein chemistry. With protein engineering, the 2D IR approach may provide insight into the impact of point mutations on the stability of proteins and the presence of folding intermediates as predicted from molecular modeling (18, 19). The 2D IR approach could also be applied to studies focused on substrate binding (protein-domain stabilization) or direct protein–protein (nucleic acid or lipid) interactions. In combination with site-directed isotope labeling, the 2D-correlation methodology offers possibilities to pinpoint individual unfolding/folding sites in proteins under equilibrium and nonequilibrium conditions.
Acknowledgments
We thank Drs. Rogov and Filimonov from the Institute for Protein Research in Pushchino, Russia, for a sample of the Cro-V55C repressor protein and Prof. Robert Curl for suggesting a number of constructive changes to this manuscript. The work was supported, in part, by Deutsche Forschungsgemeinschaft Grant Ga 175/12-1 (to H.F.) and a travel grant from the Humboldt Foundation.
Abbreviation
- 2D
two-dimensional
References
- 1.Privalov P L. J Mol Biol. 1996;258:707–725. doi: 10.1006/jmbi.1996.0280. [DOI] [PubMed] [Google Scholar]
- 2.Baldwin R L. Nat Struct Biol. 1997;4:965–966. doi: 10.1038/nsb1297-965. [DOI] [PubMed] [Google Scholar]
- 3.Dobson C M. Curr Opin Struct Biol. 1992;2:6–12. [Google Scholar]
- 4.Anderson W F, Ohlendorf D H, Takeda Y, Matthews B W. Nature (London) 1981;290:754–758. doi: 10.1038/290754a0. [DOI] [PubMed] [Google Scholar]
- 5.Matsuo H, Shirakawa M, Kyogoku Y. J Mol Biol. 1995;254:668–680. doi: 10.1006/jmbi.1995.0646. [DOI] [PubMed] [Google Scholar]
- 6.Baleja J D, Sykes B D. Biochem Cell Biol. 1994;72:95–108. doi: 10.1139/o94-016. [DOI] [PubMed] [Google Scholar]
- 7.Griko Y V, Rogov V V, Privalov P L. Biochemistry. 1992;31:12701–12705. doi: 10.1021/bi00165a022. [DOI] [PubMed] [Google Scholar]
- 8.Filimonov V V, Rogov V V. J Mol Biol. 1996;255:767–777. doi: 10.1006/jmbi.1996.0062. [DOI] [PubMed] [Google Scholar]
- 9.Fabian H, Fälber K, Gast K, Reinstädler D, Rogov V V, Naumann D, Zamyatkin D F, Filimonov V V. Biochemistry. 1999;38:5633–5642. doi: 10.1021/bi982120d. [DOI] [PubMed] [Google Scholar]
- 10.Noda I. Appl Spectrosc. 1993;47:1329–1336. [Google Scholar]
- 11.Fabian H, Schultz C P, Backmann J, Hahn U, Saenger W, Mantsch H H, Naumann D. Biochemistry. 1994;33:10725–10730. doi: 10.1021/bi00201a021. [DOI] [PubMed] [Google Scholar]
- 12.Schultz C P, Fabian H, Mantsch H H. Biospectroscopy. 1998;4:S19–S29. doi: 10.1002/(SICI)1520-6343(1998)4:5+<S19::AID-BSPY3>3.0.CO;2-N. [DOI] [PubMed] [Google Scholar]
- 13.Noda I, Liu Y, Ozaki Y. J Phys Chem. 1996;100:8665–8673. [Google Scholar]
- 14.Nabet A, Pezolet M. Appl Spectrosc. 1997;51:466–469. [Google Scholar]
- 15.Graff D G, Pastrana-Rios B, Venyaminov S Y, Prendergast F G. J Am Chem Soc. 1997;119:11282–11294. [Google Scholar]
- 16.Wang Y, Murayama K, Myojo Y, Tsenkova R, Hayashi N, Ozaki Y. J Phys Chem B. 1998;102:6655–6662. [Google Scholar]
- 17.Hamm P, Lim M, DeGrado W F, Hochstrasser R M. Proc Natl Acad Sci USA. 1999;96:2036–2041. doi: 10.1073/pnas.96.5.2036. [DOI] [PMC free article] [PubMed] [Google Scholar]
- 18.Brooks C L., III Curr Opin Struct Biol. 1998;8:222–226. doi: 10.1016/s0959-440x(98)80043-2. [DOI] [PubMed] [Google Scholar]
- 19.Kazmirki S L, Daggett V. J Mol Biol. 1998;284:793–806. doi: 10.1006/jmbi.1998.2192. [DOI] [PubMed] [Google Scholar]


