Abstract
We have micromachined a silicon-chip device that transports DNA with a Brownian ratchet that rectifies the Brownian motion of microscopic particles. Transport properties for a DNA 50-mer agree with theoretical predictions, and the DNA diffusion constant agrees with previous experiments. This type of micromachine could provide a generic pump or separation component for DNA or other charged species as part of a microscale lab-on-a-chip. A device with reduced feature size could produce a size-based separation of DNA molecules, with applications including the detection of single-nucleotide polymorphisms.
The Human Genome Project aims to provide the complete sequence of the 3 billion base pairs of the human genome. While the dominant method for analyzing DNA fragments remains gel electrophoresis, new technologies that have the potential to increase the rate and decrease the cost of DNA sequencing and analysis, such as mass spectrometry and hybridization arrays, are critical to the project’s success (1).
Here we describe a method of DNA transport and separation based on a Brownian ratchet. As described originally by Smoluchowski (2) and noted by Feynman (3), a Brownian particle can undergo net transport on a potential energy surface that is externally driven to fluctuate between several distinct states. Brownian ratchets have attracted theoretical attention (4–12) because of their description of molecular motors (13–15) and their similarity with phenomena termed stochastic resonance and resonance activation (16, 17).
Brownian ratchets have been demonstrated to transport micrometer- to millimeter-sized particles in experiments with ratchets generated by dielectrophoresis (18), optical tweezers (19), and electrocapillary forces (20, 21). Other devices based on entropic ratchets (22) or physical barriers (23, 24) have been proposed as well. More recently, a geometrical sieve device has been used to separate phospholipids (25).
Despite these successes, the Brownian ratchet mechanism has not before proved capable of transporting DNA fragments in the size ranges applicable to DNA sequencing (<1000 nt) because the interactions used to establish the ratchet potential were too weak. In contrast to previous devices using polarization interactions to generate ratchets (18, 19), the device that we have fabricated uses charge–charge interactions to generate the ratchet potential. As seen below, the charge–charge interactions have sufficient strength to establish ratchets that can trap small DNA fragments.
The ratchet-like wells that trap DNA are generated by charging a series of patterned electrodes. When the electrodes are discharged, the traps vanish and the molecules undergo Brownian motion. Next the potential is reapplied, and the particles again collect in the traps. A spatial asymmetry in the shape of each ratchet-shaped well rectifies the Brownian motion and produces net transport as the on–off cycle is repeated. Each molecule’s transport rate depends on its diffusion constant, allowing the possibility of size-based separations. We have implemented the device by microfabrication on a silicon chip.
This report describes the Brownian ratchet theory, provides a derivation of the transport rate, and presents experimental results for a single sized DNA oligomer. Greater details regarding the fabrication methods and a more extensive presentation of the experimental results for a variety devices and oligomer sizes are available elsewhere (26).
Theory and Methods
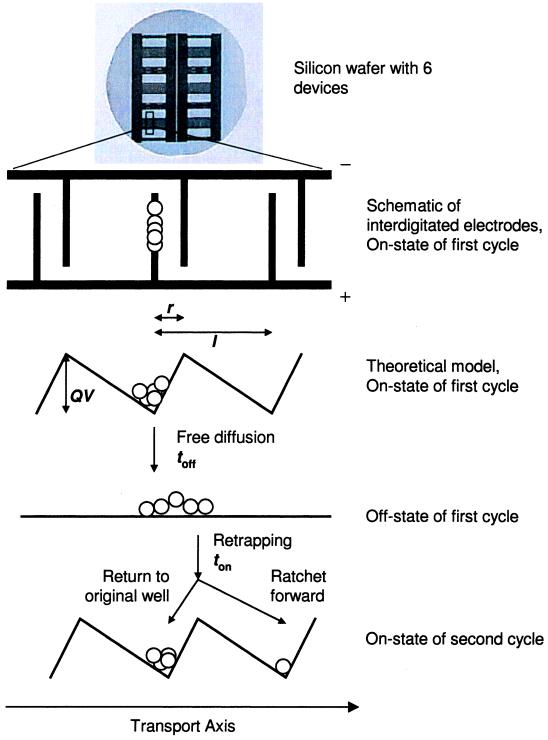
A silicon wafer with six micromachined devices is shown in Fig. 1, with a schematic design below. The electric potential that creates the ratcheting traps is generated by two arrays of interdigitated electrodes that are perpendicular to the transport axis. The two sets of arrays each extend from bond pads on opposite sides of the device. The spacing between electrodes extending from the same bond pad is l. The asymmetric pattern creates two different spacings, r and l − r, between electrodes extending from opposite bond pads. The smaller spacing r defines the feature size of the device.
Figure 1.
The Brownian ratchet device is shown in schematic. Modulating the electric potential at the electrodes generates a ratchet-like potential energy surface for charged molecules such as DNA. Cycling the ratchet between an on-state and an off-state generates transport.
As also shown in Fig. 1, a simplified one-dimensional description of the potential approximates the electrodes as infinitely thin wires. To simplify the theoretical model, we have neglected the finite width of the electrode, the dependence of the electric potential on the distance normal to the surface, and the corresponding detailed calculation of the potential along the transport axis.
When a voltage difference V is applied across the two electrode arrays during the on-state, with duration ton, sawtooth-shaped ratcheting traps are created for charged particles. The electrodes are discharged to V = 0 during the off-state, with duration toff, and particles undergo isotropic Brownian diffusion. When the potential is reapplied, the particles are again trapped in potential wells. The times ton and toff are within the low-frequency, quasistatic approximation; nonadiabatic effects and current reversals, reported elsewhere (27, 28), are not applicable in this regime. Due to the asymmetry of the sawtooth shape and the choice of toff, a particle starting from well 0 has a measurable probability to be trapped in well 1 and virtually zero probability to be trapped in well −1. Transport can be generated by repetitive cycling between the on-state and the off-state. The transport properties of a particle are determined by its diffusion constant D and its charge Q, along with the thermal energy kBT and the device parameters defined previously.
Each cycle begins by applying the potential V for a time ton that is sufficient to localize particles at the bottoms of the trapping wells. A particle at the barrier-top drifts down the side of the sawtooth of length l − r to find the bottom of the well, which defines the time required for complete trapping,
 |
1 |
according to overdamped Brownian motion. At the end of the trapping, the particle distribution at the bottom of a well is assumed to be much narrower than the feature size r.
In the next phase of the cycle, the potential is turned off for time toff. When the potential is reapplied, particles that have diffused farther than the barrier to the left (roughly distance l away) will hop to the previous well, and particles that have diffused farther than the barrier to the right (roughly distance r away) will be transported to the next well. Since r ≪ l, we can choose an intermediate time toff such that toff ∼ r2/2D ≪ l2/2D and particles always move right, never left.
To compute the probability α that a particle moves one well to the right in a single cycle, we note that the effective distance reff it must travel is between r (the inner edge-to-edge distance between electrodes) and 3r (the outer edge-to-edge distance). The probability distribution (or equivalently Green’s function) for a particle starting at the origin undergoing one-dimensional Brownian motion for time toff is
 |
2 |
An expression for α is then obtained by integrating P(x; toff) from reff to infinity:
 |
3 |
The distance reff2 has been written in terms of the characteristic diffusion time 2Dtr, where tr = reff2/2D is the time required to diffuse a distance equal to the short side reff of the trapping well. In this derivation, we assumed that toff is short enough that particles diffuse less than a single ratchet—i.e., P(x; toff) ≈ 0 for x > l. An expression for α valid in the limit of large toff is α = ∑k=−∞∞ k∫(k−1)l+reffkl+reffdx P(x; toff).
After each cycle, the particle distribution shifts to the right the distance αl. After n cycles, the envelope of the distribution of particles in each well evolves as a Gaussian with center x(n) and square width σ2(n):
 |
4a |
 |
4b |
Here we have assumed that all the particles are in well 0 at the start of the first cycle.
Both α and the steady-state flux of particles through the device,
 |
5 |
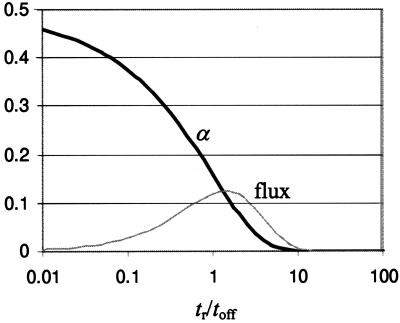
are plotted in Fig. 2. The transport fraction α (black line) increases with toff and approaches a maximum value of 1/2 when back-diffusion is neglected. The flux in units of the characteristic time tr is αtr/(ton + toff) and is shown for ton = toff/3. The flux is nonmonotonic and exhibits a maximum when toff ≈ tr. Other voltage modulations more complicated than the on–off pattern described here are also possible and can change the direction of particle flow according to particle size (4). Other similar types of nonmonotonic behavior have been termed stochastic resonance and resonance activation (16, 17), although they may also be described by dispersion and linear response (29).
Figure 2.
Probability α that a particle hops one well to the right during a single cycle of device operation is shown as a function of the ratio tr/toff (black line). For large toff, α approaches 0.5 as we do not consider back-diffusion. The flux in units of the characteristic time tr is αtr/(ton + toff) and is shown for ton = toff/3 (gray line). The flux is reminiscent of a stochastic resonance with a maximum when toff ≈ tr.
Devices were fabricated from Pt, a nonreactive, corrosion-resistant metal chosen to avoid electrolysis of water, using relatively standard micromachining technologies (26). The fabrication began with thermally oxidized 100-mm diameter silicon wafers. A 200-Å-thick Ti layer was used as an adhesion layer between the subsequent Pt layer and the silicon dioxide. Next, a 200-nm-thick layer of Pt was deposited on top of the Ti. The electrodes were defined in the metal layers by using photolithography and ion milling. For the devices used in this work, the electrodes and the gaps between nearest electrodes were 2 μm and the spatial period was 20 μm.
Oligomers labeled with fluorescent rhodamine dye (Amitof Biotech, Boston) were placed on the surface of the chip at 4 pmol/μl in deionized water. A microscope slide cover glass (Macalaster Bicknell, New Haven, CT) cut to size was used to confine the solution to a uniform thickness of approximately 10 μm. A sealing compound was used to obtain a liquid tight seal along the edges, leaving the ends open. Square wave modulation (Synthesized Function Generator DS345, Stanford Research Systems, Sunnyvale, CA) with an amplitude of 1.6 V and offset of 0.8 V (one set of electrodes at 0 V and the second set at 1.6 V) was applied to the electrodes to generate the flashing ratchet potential. Frequencies ranging from 0.7 Hz to 8 Hz were used, with a ratio ton/toff = 1/3.
Video images of the analyte fluorescence were used to record the DNA transport. Images were captured by using a low light imaging charge-coupled device camera (VE1000SIT; Dage-MTI, Michigan City, IN) mounted on an epifluorescence microscope (Zeiss Axioskop) using a 10× Fluor objective. The chip was illuminated by using the output of a 50-W mercury lamp filtered with a green bandpass filter. The bright-field fluorescence was imaged through a red low-pass filter. The video images were recorded on video tape and transferred to a PC by using a composite color PCI bus frame grabber (DT3153 Data Translation, Marlboro, MA). The fluorescence intensity resulting from the fluorescently labeled DNA fragments was analyzed in a line across the video image synchronized to the ton period (HL Image; Foresight Imaging, Chelmsford, MA).
According to Eq. 1, the expected time required to focus a DNA 50-mer is 0.006 sec, based on a thermal energy of 26 meV, a charge of 1e− per nucleotide yielding QV = 80 eV, and a diffusion constant of 1.8 × 10⁻⁷ cm2/sec [estimated from a rhodamine-labeled 30-mer on a quartz surface (30)¶]. We visually ascertained that the trapping time ton was sufficient to permit complete focusing of the DNA on the positive electrodes, even for the fastest switching rate of 8 Hz (ton = 0.03 sec).
Results and Discussion
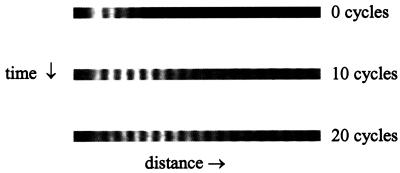
In Fig. 3 we show three images from a typical experiment using a device with 2-μm electrodes and a 0.7-Hz switching frequency to transport a rhodamine-labeled DNA 50-mer. These images were saved during the trapping phase of the cycle, and fluorescence maxima are clearly seen from DNA molecules captured on the positive electrodes. At the start of the experiment, the DNA oligomers are focused on left-most three electrodes. As the potential cycles between on- and off-states, the packet moves to the right and broadens. The transport rate α can be estimated by noting that the intensity maximum moves from electrode 1 to electrode 3 after 10 cycles, then to electrode 5 after 10 more cycles, yielding α ≈ 0.2. For a more precise value, we extracted the intensity profile across the image, set a baseline at the 85th percentile of intensity, calculated the average position x(n) from the intensity above baseline, normalized x(n) by the 10-pixel spacing between electrodes, then measured the slope of x(n) to obtain α. For this experiment α = 0.18.
Figure 3.
Three images are shown from a typical experiment using a device with 2-μm electrodes and a 0.7-Hz switching frequency to transport a rhodamine-labeled DNA 50-mer. These images were saved during the trapping phase of the cycle, and fluorescence maxima are clearly seen from DNA molecules captured on the positive electrodes. At the start of the experiment, the DNA oligomers are focused on left-most three electrodes. As the potential cycles between on- and off-states, the packet moves to the right and broadens.
The square width also increases linearly with the number of cycles (data not shown); because we used a baseline threshold that narrows the width of the distribution, however, the formula of Eq. 4b no longer provides an accurate relationship between σ2(n) and α.
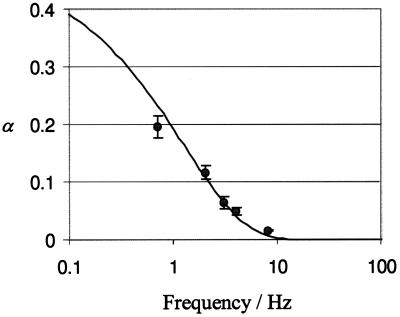
Fig. 4 shows the experimental results for α, along with ±1σ error bars from repeated runs. As predicted, α decreases with increasing frequency. Also shown in Fig. 4 is a theoretical curve from Eq. 3. Least-squares fitting to the data from all but the highest frequency yielded D(r/reff)2 = 3.5 × 10⁻⁸ cm2/sec. The good agreement between the experimental results and the single-parameter theoretical fit supports our conclusion that transport is due to a Brownian ratchet.
Figure 4.
Experimental results for the transport of a DNA 50-mer by a device with 2-μm electrodes and 20-μm periodicity (points with 1σ error bars) are compared with theoretical predictions (line). The theory requires a single adjustable parameter related to the diffusion constant of DNA.
Furthermore, since reff ≈ (2–3)r, we find that D = 1.4–3 × 10⁻⁷ cm2/sec. This indirect measure of the diffusion constant brackets the estimated diffusion constant for a DNA 50-mer close to a glass surface, 1.8 × 10⁻⁷ cm2/sec (30).
The experimental results demonstrating transport permit an examination of the feasibility of fabricating a device to provide useful size-based separations of DNA. Separating two chemical species requires that they have different diffusion constants D and D′ and different hopping probabilities α and α′. The resolution between the species, defined as
 |
6 |
improves as n1/2. The number of cycles required to reach the resolution of 1 typical for DNA separation applications is
 |
7 |
where we have assumed that the two packets acquire a similar width. The separation parameter toff (and, through toff, the quantities α and α′) can be selected to optimize various quantities associated with a resolved separation—for example, the device length, approximately l × [α/(α − α′)]2, or the total separation time, n × (ton + toff).
A typical application requiring the separation of DNA fragments is the analysis of single nucleotide polymorphisms (SNPs). An SNP is a position in the genome where multiple nucleotides are likely. Characterizing genetic diversity through SNPs has applications including the identification of genes for disease inheritance and susceptibility, the development of personalized medicines, and the documentation of human evolutionary history and migrations through a genetic record (31–34). Preliminary sets of thousands of SNPs, identified by the 12 nt on either side of a polymorphism, have been reported (35). Validating and detecting these SNPs can be accomplished by resequencing specific 25-nt regions of the genome.
Here we investigate the use of a Brownian ratchet device for the resequencing and detection application. Calculations are based on a device with feature size r = 0.1 μm, periodicity 1 μm, and a potential difference of 0.1 V between electrodes in the on-state. We estimate the effective DNA diffusion constant D(r/reff)2 from the theoretical scaling for a self-avoiding walk, D ∼ (length)−0.6 (36, 37), and our experimental results for the 50-mer. The persistence length of single-stranded DNA is 4 nm, or 13.6 nt (38), indicating that the self-avoiding walk should be adequate (although not quantitative) for fragment sizes we consider.
The detection of an SNP requires, at most, the ability to sequence the 25-nt region surrounding the polymorphism, which can be accomplished by separating a DNA 24-mer from a 25-mer. Using the theoretical scaling of diffusion constant with DNA length, we extrapolate D(r/reff)2 of 5.44 × 10⁻⁸ cm2/sec and 5.31 × 10⁻⁸ cm2/sec for the 24-mer and 25-mer. The time required to focus the DNA at the start of each cycle is ton ≈ 1.8 × 10⁻⁴ sec. The optimized separation parameters, calculated by using Eq. 7, require toff = 2.5 × 10⁻⁴ sec and 12,000 cycles for a total separation time of 5.4 sec on a 1.25-cm chip.
In conclusion, we have fabricated a Brownian ratchet device that is capable of transporting small DNA molecules in aqueous solution, rather than the inconvenient gel and polymer solutions required for electrophoresis. This type of device could be used as a pump component for transport or separation of charged species in a microfabricated analysis chip. Multiple miniaturized devices can also be arrayed side-by-side for high-throughput operation. On the basis of experimental measurements, we suggest the feasibility of using this type of device for biological applications, for example the validation of SNPs.
Acknowledgments
We acknowledge the assistance of Rajen Raheja for image analysis. We also acknowledge the support of Small Business Innovation Research Grant 1 R43 HG01535-01 from the National Human Genome Research Institute and Advanced Technology Program Award 1996-01-0141 from the National Institute of Standards and Technology.
Abbreviation
- SNP
single-nucleotide polymorphism
Footnotes
The diffusion constant of dye-labeled 30-mer on quartz was measured to be approximately 1/2.6 as large as the free-solution value of 6.2 × 10⁻⁷ cm2/sec. Similarly, the diffusion constant of the bare dye was 1/7 the bulk value of 2.8 × 10⁻⁶ cm2/sec. We estimate the diffusion constant of a 50-mer based on the self-avoiding walk scaling, D50-mer/D30-mer = (50/30)−0.6, which gives D = 1.8 × 10⁻⁷ cm2/sec.
References
- 1.Rowen L, Mahairas G, Hood L. Science. 1997;278:605–607. doi: 10.1126/science.278.5338.605. [DOI] [PubMed] [Google Scholar]
- 2.von Smoluchowski M. Physik Z. 1912;13:1069–1078. [Google Scholar]
- 3.Feynman R P, Leighton R B, Sands M. Feynman Lectures in Physics. Vol. 1. Reading, MA: Addison-Wesley; 1966. , Chapter 46. [Google Scholar]
- 4.Bier M, Astumian R D. Phys Rev Lett. 1996;76:4277–4280. doi: 10.1103/PhysRevLett.76.4277. [DOI] [PubMed] [Google Scholar]
- 5.Astumian R D, Bier M. Phys Rev Lett. 1993;72:1766–1769. doi: 10.1103/PhysRevLett.72.1766. [DOI] [PubMed] [Google Scholar]
- 6.Astumian R D, Bier M. Biophys J. 1996;70:637–653. doi: 10.1016/S0006-3495(96)79605-4. [DOI] [PMC free article] [PubMed] [Google Scholar]
- 7.Astumian R D. Science. 1997;276:917–922. doi: 10.1126/science.276.5314.917. [DOI] [PubMed] [Google Scholar]
- 8.Magnasco M O. Phys Rev Lett. 1993;71:1477–1481. doi: 10.1103/PhysRevLett.71.1477. [DOI] [PubMed] [Google Scholar]
- 9.Doering C R, Horsthemke W, Riordan J. Phys Rev Lett. 1994;72:2984–2987. doi: 10.1103/PhysRevLett.72.2984. [DOI] [PubMed] [Google Scholar]
- 10.Hänggi P, Bartussek R. In: Lecture Notes in Physics. Parisi J, Müller S C, Zimmerman W, editors. Vol. 476. New York: Springer; 1996. pp. 294–308. [Google Scholar]
- 11.Prost J, Chauwin J-F, Peliti L, Ajdari A. Phys Rev Lett. 1994;72:2652–2655. doi: 10.1103/PhysRevLett.72.2652. [DOI] [PubMed] [Google Scholar]
- 12.Jülicher F, Ajdari A, Prost J. Rev Mod Phys. 1997;69:1269–1281. [Google Scholar]
- 13.Howard J, Hudspeth A J, Vale R D. Nature (London) 1989;342:154–158. doi: 10.1038/342154a0. [DOI] [PubMed] [Google Scholar]
- 14.Kuo S C, Sheetz M P. Science. 1993;260:232–234. doi: 10.1126/science.8469975. [DOI] [PubMed] [Google Scholar]
- 15.Svoboda K, Schmidt C H, Schnapp B J, Block S M. Nature (London) 1993;365:721–727. doi: 10.1038/365721a0. [DOI] [PubMed] [Google Scholar]
- 16.Gammaitoni L, Hänggi P, Jung P, Marchesoni F. Rev Mod Phys. 1998;70:223–287. [Google Scholar]
- 17.Doering C J, Gadoua J C. Phys Rev Lett. 1992;69:2318–2321. doi: 10.1103/PhysRevLett.69.2318. [DOI] [PubMed] [Google Scholar]
- 18.Rousselet J, Salome L, Ajdari A, Prost J. Nature. 1994;370:446–448. doi: 10.1038/370446a0. [DOI] [PubMed] [Google Scholar]
- 19.Faucheux L P, Bourdieu L S, Kaplan P D, Libchaber A J. Phys Rev Lett. 1995;74:1504–1507. doi: 10.1103/PhysRevLett.74.1504. [DOI] [PubMed] [Google Scholar]
- 20.Gorre L, Ioannidis E, Silberzan P. Europhys Lett. 1996;33:267–272. [Google Scholar]
- 21.Gorre-Talini L, Spatz J P, Silberzan P. Chaos. 1998;8:650–656. doi: 10.1063/1.166347. [DOI] [PubMed] [Google Scholar]
- 22.Slater G W, Guo H L, Nixon G I. Phys Rev Lett. 1997;78:1170–1173. [Google Scholar]
- 23.Ertas D. Phys Rev Lett. 1998;80:1548–1551. [Google Scholar]
- 24.Duke T A J, Austin R H. Phys Rev Lett. 1998;80:1552–1555. [Google Scholar]
- 25.van Oudenaarden A, Boxer S G. Science. 1999;285:1046–1048. doi: 10.1126/science.285.5430.1046. [DOI] [PubMed] [Google Scholar]
- 26.Hammond, R. W., Bader, J. S., Henck, S. A., Deem, M. W., McDermott, G. A., Bustillo, J. M. & Rothberg, J. M. (1999) Electrophoresis, in press. [DOI] [PubMed]
- 27.Bartussek R, Hänggi P, Kissner J G. Europhys Lett. 1994;28:459–464. [Google Scholar]
- 28.Jung P, Kissner J G, Hänggi P. Phys Rev Lett. 1996;76:1166–1169. [Google Scholar]
- 29.Robertson B, Astumian R D. J Chem Phys. 1991;94:7414–7419. [Google Scholar]
- 30.Xu X-H, Yeung E S. Science. 1997;275:1106–1109. doi: 10.1126/science.275.5303.1106. [DOI] [PubMed] [Google Scholar]
- 31.Risch N, Merikangas K. Science. 1996;273:1516–1517. doi: 10.1126/science.273.5281.1516. [DOI] [PubMed] [Google Scholar]
- 32.Lander E S. Science. 1996;274:536–539. doi: 10.1126/science.274.5287.536. [DOI] [PubMed] [Google Scholar]
- 33.Collins F S, Guyer M S, Chakravarti A. Science. 1997;278:1580–1581. doi: 10.1126/science.278.5343.1580. [DOI] [PubMed] [Google Scholar]
- 34.Kruglyak L. Nature Genet. 1997;17:21–24. doi: 10.1038/ng0997-21. [DOI] [PubMed] [Google Scholar]
- 35.Wang D, Fan J B, Siao C J, Berno A, Young P, Sapolsky R, Ghandour G, Perkins N, Winchester E, Spencer J, et al. Science. 1998;280:1077–1082. doi: 10.1126/science.280.5366.1077. [DOI] [PubMed] [Google Scholar]
- 36.Flory P J. Principles of Polymer Chemistry. Ithaca, NY: Cornell Univ. Press; 1953. [Google Scholar]
- 37.Doi M. The Theory of Polymer Dynamics. New York: Clarendon; 1986. [Google Scholar]
- 38.Grosberg A Y. Statistical Physics of Macromolecules. New York: Am. Inst. Phys.; 1994. [Google Scholar]


