Abstract
We have combined high-resolution atomic force microscopy (AFM) imaging and force spectroscopy to gain insight into the interaction forces between the individual protomers of the hexagonally packed intermediate (HPI) layer of Deinococcus radiodurans. After imaging the HPI layer, the AFM stylus was attached to individual protomers by enforced stylus-sample contact to allow force spectroscopy experiments. Imaging of the HPI layer after recording force-extension curves allowed adhesion forces to be correlated with structural alterations. By using this approach, individual protomers of the HPI layer were found to be removed at pulling forces of ≈300 pN. Furthermore, it was possible to sequentially unzip entire bacterial pores formed by six HPI protomers. The combination of high-resolution AFM imaging of individual proteins with the determination of their intramolecular forces is a method of studying the mechanical stability of supramolecular structures at the level of single molecules.
Keywords: binding strength, conformational change, force spectroscopy, hexagonally packed intermediate layer
Atomic force microscopy (AFM; ref. 1) has become an unique tool for observing biological structures in aqueous solution (2, 3). As demonstrated recently, the AFM can be used to observe proteins at work (4, 5) with subnanometer resolution (5, 6), providing insight into the structure and function relationship of biological systems. Beside its imaging capability, AFM can be applied to measure the intermolecular forces between various ligand and receptor molecules (7–9) and the unfolding forces of individual proteins (10, 11). To this end, the force spectra of molecules attached to a support and to an AFM stylus have been recorded while separating both surfaces. Although force spectroscopy has the sensitivity to detect interactions between individual molecules, the direct correlation between the force spectra and changes in the supramolecular structure is required to interpret the force-extension curves fully. Herein, we present the combination of high-resolution AFM imaging and force spectroscopy on individual proteins.
The biological sample selected was the hexagonally packed intermediate (HPI) layer of Deinococcus radiodurans, a representative of regularly arrayed surface layers that are ubiquitous in bacteria and archae (12–15). As an interface to the environment, surface layers mediate adhesion to biotic and abiotic surfaces and provide protection. The structure of the HPI layer has been studied extensively by both electron microscopy (16) and AFM (17–20). There are six identical protomers that form the HPI layer pore, which has a mass of 655 kDa (21, 22). Each pore can reversibly switch from an unplugged to a plugged conformation (18). The outer surface of the HPI layer is hydrophilic as a result of the hydrophilic C-terminal region (amino acids 985–1,030) of the protomers (22). The hydrophobic N-terminal region (amino acids 60–250) of the HPI polypeptide, located at its inner surface, covalently links fatty acids (22) and anchors the HPI layer to the outer membrane via hydrophobic bonding (23). As a protective barrier, the HPI layer has an unusual stability to aggressive detergents of extreme ionic strengths over a wide pH range (24) as well as to mechanical and osmotic damage. Thus, it has been a challenge to determine the forces holding the individual hexameric protomers together as well as those driving the assembly of the HPI layer.
Methods
Sample Preparation.
The HPI layer from D. radiodurans was extracted from whole cells (strain SARK) with lithium dodecyl sulfate and purified on a Percoll density gradient (Amersham Pharmacia; ref. 24). A stock solution (1 mg/ml protein) was stored in ultrapure water at 4°C. Protein layers were adsorbed onto freshly cleaved mica in 300 mM KCl/10 mM Tris⋅HCl, pH 7.8 (25), while high-resolution imaging was performed in 150 mM KCl/20 mM MgCl2/10 mM Tris⋅HCl, pH 7.8.
AFM Setup.
We used a Nanoscope III AFM (Digital Instruments, Santa Barbara, California) equipped with a J scanner (80 μm) and an oxide sharpened Si3N4 stylus on cantilevers with a spring constant of k = 0.1 N/m (Olympus, Tokyo). Topographs were recorded in contact mode at a stylus loading force of 100 pN, and a line frequency of typically 4–6 Hz. Signals acquired in trace and retrace scanning directions showed no significant differences.
Combined AFM Imaging and Force Spectroscopy.
To correlate topographs and force-extension curves, a 300-nm-wide frame of the protein surface containing 512 × 512 pixels was first recorded. The number of pixels was then reduced to 128 × 128, and we zoomed into the center of the topograph (frame width = 100 nm) to acquire the force-extension curve at this location. Subsequently, the AFM stylus was pressed with an applied force of ≤2 nN (outer surface) or ≤1 nN (inner surface) onto the protein layer coming into contact at some point within the further magnified region. The AFM stylus was held in this position for 1 s before the stylus and protein surfaces were separated at a velocity of 0.2 μm/s, while recording the cantilever deflection (512 pixels). Finally, a full frame (512 × 512 pixels) of 300-nm width was taken of the surface to visualize structural changes. During this procedure, the image shift was less than 20 nm. All measurements were carried out in buffer solution at room temperature.
Results and Discussion
The HPI Layer Outer Surface Does Not Adhere to the AFM Stylus.
The hydrophilic outer surface of the HPI layer adsorbs strongly to freshly cleaved mica (18), exposing the inner surface toward the AFM stylus. Occasionally, two HPI layers form a stable double layer by the interaction of their hydrophobic inner surfaces to give the AFM stylus access to the outer surface (18). On examination, the outer surfaces withstood a stylus loading force of 2 nN without undergoing irreversible structural changes (Fig. 1 A and C) and did not adhere to the silicon nitride surface of the AFM stylus (Fig. 1B). This mechanical stability and inertness is compatible with the putative protective function of the HPI layer.
Figure 1.
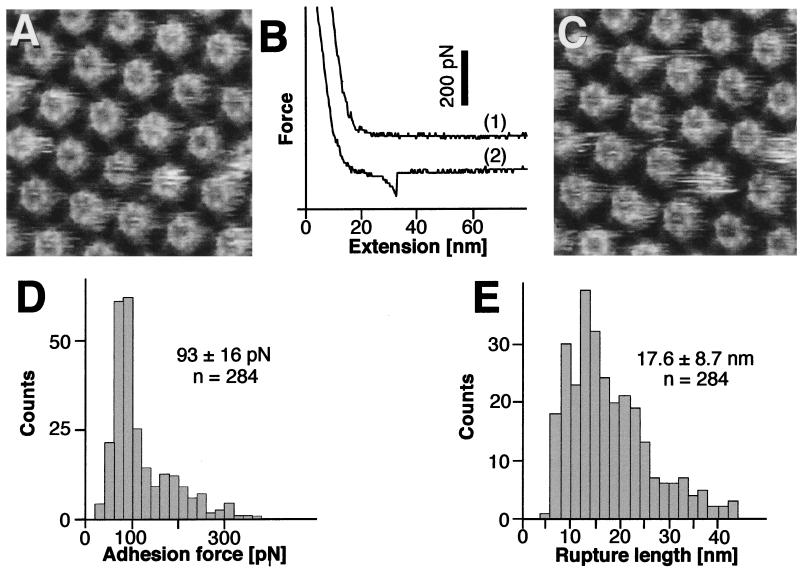
Topographs of the HPI layer outer surface and force-extension curve recorded during retraction of the stylus after indenting the protein layer with a force of 2 nN. (A) Control AFM topograph of the outer surface before indentation. The hexameric cores with six V-shaped protrusions and emanating arms are clearly resolved. Both structural details have been previously observed by three-dimensional electron microscopy and AFM (17) and were confirmed more recently (18–20, 29). The distance between the core centers is 18 nm. (B) The force-extension curves acquired on the outer surface indicating the absence of adhesion forces. (C) The same surface area imaged after recording the force curve; no structural changes have occurred. The defect core on the left was used to align topographs C and A. Full gray-level range of the topographs corresponds to 2.5 nm.
The HPI Layer Inner Surface Adheres to the AFM Stylus.
The hydrophobic inner surface is designed to anchor the HPI layer in the outer membrane of D. radiodurans (16). High-resolution topographs of the inner HPI layer surfaces revealed cores with central channels that were connected by slender arms (Fig. 2A). Areas that showed only minor or no contaminants were approached with the stylus until a force of 1 nN had been reached. No adhesion to the AFM stylus was measured on retraction for 75% of the approaches (Fig. 2B, trace 1), whereas two different types of force-extension curves were observed from the remaining 25%.
Figure 2.
Adhesion forces detected between the AFM stylus and the inner surface of the HPI layer. (A) Control AFM topograph of the inner surface of the HPI layer. The hexameric cores with their emanating arms have a central pore that can reversibly switch from a plugged to an unplugged conformation with a central plug (4, 18). The distance between the core centers is 18 nm. (B) On retraction of the stylus after indenting the protein with a loading force of 1 nN, 75% of the force-extension curves were similar to those recorded on the outer surface (trace 1; compare with Fig. 1B). The major fraction of the remaining force-extension curves (type I) showed an adhesion force of about 100 pN. Rupture occurred after extension of the molecular bridge by more than 10 nm (trace 2). (C) The same inner surfaces imaged after recording force curves; no structural changes occurred. The defect core on the right was used to align topographs C and A. (D) Histogram of the adhesion forces measured from 284 extension curves. The peak is at 93 ± 16 pN. (E) The corresponding distances between the stylus and the protein surface at the rupture point have a wide length distribution with an average of 17.6 ± 8.7 nm. Full gray-level range of the topographs corresponds to 3 nm.
In the first case (type I), a force peak of typically 90 pN emerged after retracting the stylus approximately 15 nm from the contact point (Fig. 2B, trace 2), indicating that a molecular structure bridged the surfaces between AFM stylus and HPI layer. Subsequent imaging of the same area did not reveal any detectable structural change (Fig. 2C). Compiling forces from force-extension curves that had no destructive effect yielded a histogram with a sharp peak at 93 pN and a tail toward higher values (Fig. 2D). The higher values were relatively infrequent and resulted from interaction with the occasional contaminants that were difficult to eliminate entirely from the hydrophobic inner HPI layer surface (18). Distances between the contact point and the rupture point in the force-extension curves had a wide distribution that started at small values and declined rather quickly above 20 nm (Fig. 2E). Again, the extended tail of longer distances was probably the result of spurious contaminants.
Measuring Intramolecular Binding Forces.
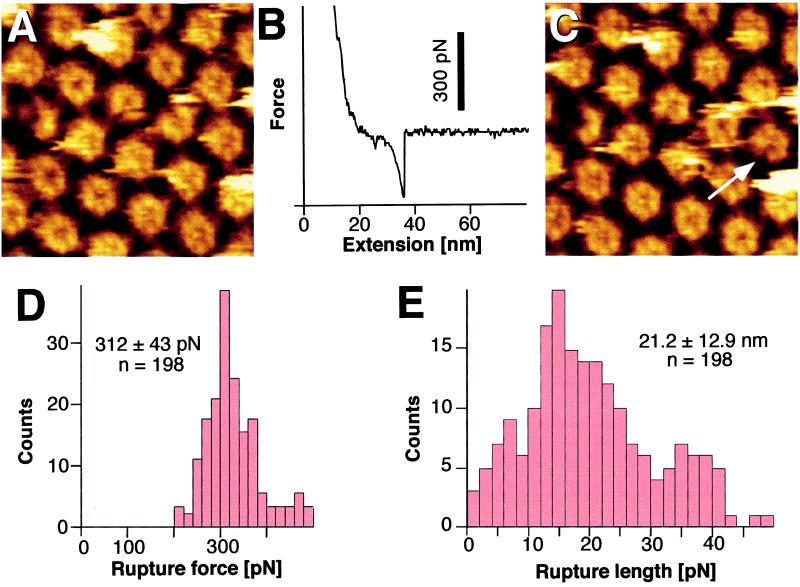
In the second case (type II), the force peaks were approximately three times higher (Fig. 3B) than those giving rise to type I force-extension curves, although the control image taken before the force-extension curve (Fig. 3A) did not reveal any structural difference to other images recorded from the inner HPI surface. However, on close inspection, the topograph recorded subsequently showed a striking change. A single protomer was always missing from one HPI hexamer, as illustrated by comparing the central region (Fig. 3C, arrow) of the frame displayed in Fig. 3A to that in Fig. 3C. Accumulating peak values from force curves (type II) that were related to the extraction of single protomers yielded a Gaussian distribution with an average of 312 pN and a standard deviation of 43 pN (Fig. 3D). Distances between the contact point and the rupture point had a wide distribution (Fig. 3E).
Figure 3.
Individual protomers can be pulled out of the HPI layer. (A) Control AFM topograph of the inner surface of the HPI layer. (B) Force-extension curve (type II) recorded on the inner surface with an adhesion force of about 300 pN at a separation of several nanometers from the protein surface. (C) The same inner surface area imaged after recording the force curves; a molecular defect corresponding to the size of an individual protomer is clearly discernible. The defective core on the left was used to correlate topographs C and A. (D) Histogram of the adhesion forces measured from 198 single-event extension curves. The peak is at 312 ± 43 pN. (E) The corresponding distances between the stylus and the protein surface at the rupture point. A peak is at 21.2 ± 12.9 nm. The bending of the cantilever was taken into account for evaluating the stretching lengths. Full gray-level range of the topographs corresponds to 3 nm.
Unzipping an Entire Bacterial Pore.
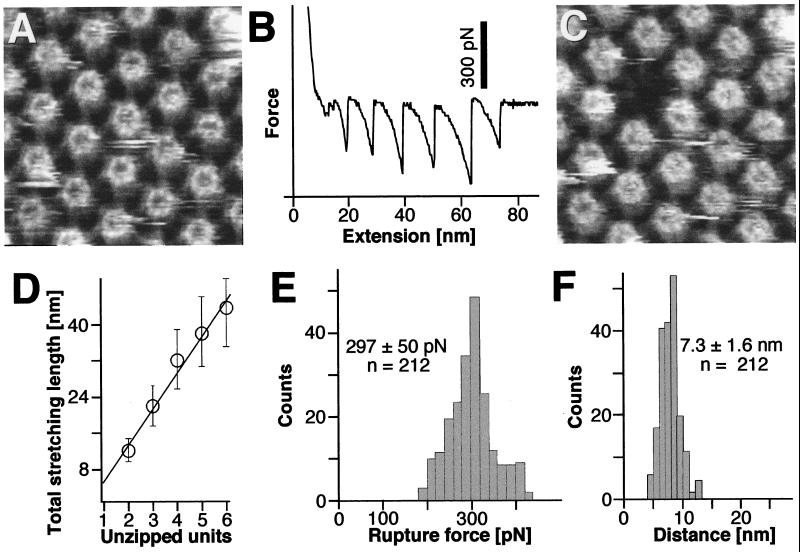
Although weak adhesive forces were seen more often than those that lead to the extraction of an individual protomer, an even less frequent but amazing event is shown in Fig. 4. In Fig. 4B, the force-extension curve has six major (200- to 300-pN) equally spaced peaks, whereas the corresponding control topograph shows that, during retraction of the stylus, an entire HPI hexamer has been zipped out of the surface layer (Fig. 4, compare C with A). We have also observed rupture events with two to five peaks in the force-extension curve, which could unambiguously be correlated with the loss of two to five monomers, respectively, as documented by the analysis in Fig. 4D. The probability to pull out several protomers in one event decreased with their increasing number. However, in no experiment did we observe a force-extension curve that had more than six distinct peaks. In addition, the force histogram of multiple-peak extension curves (Fig. 4E) is indistinguishable from the force histogram of single-peak events (Fig. 3D). In contrast, there is a significant difference in the distribution of distances between force peaks, which is much narrower (7.3 ± 1.6 nm; Fig. 4F) than the length distributions shown in Figs. 2E and 3E, arising from type I and II single-peak extension curves, respectively.
Figure 4.
Multiple protomers can be sequentially pulled out of the HPI layer. (A) Control AFM topograph of the inner surface of the HPI layer. (B) The force-extension curve recorded from this inner surface region shows a saw-tooth pattern with six force peaks of about 300 pN. (C) The same inner surface area imaged after recording the force curve; a molecular defect the size of a hexameric HPI protein complex has clearly been created. (D) Histogram of the distances corresponding to the separation of the force curve peaks against the number of missing protomers. The straight line obtained indicates a direct correlation between the force peaks and protomer extraction. (E) Histogram showing the adhesion forces measured from 212 force-extension curves. The peak is at 297 ± 50 pN. (F) Stretching distances between protomer disruption events have a sharp peak at 7.3 ± 1.6 nm. The defect core in the upper half of the frame was used to correlate topographs C and A. Full gray-level range of the topographs corresponds to 3 nm.
The Molecular Bridge Between AFM Stylus and Protomer.
The smaller adhesion forces (type I) compare favorably to those previously measured between DNA strands (26) and for cell adhesion mediated by proteoglycans (27). However, the rupture forces required to pull out a protomer (type II) are close to the interaction forces between streptavidin and biotin, one of the strongest ligand–receptor interactions ever measured (8, 9, 28). This high force holding the protomers together explains the unusual stability of the HPI layer (24). Strong adhesion of the inner HPI layer surface to the silicon nitride stylus is likely to be mediated by the hydrophobic sequence segments near the N terminus, which itself also carries an alkyl moiety. All of these regions are thought to interact with the outer membrane (22).
When the rupture occurs between stylus and N terminus, a rather narrow peak force distribution is measured (Fig. 2D), suggesting a single type of bond. However, the wide distribution of the lengths between contact point and rupture (Fig. 2E) indicates that different parts of the N-terminal region bind to the stylus, depending on its landing point. A much stronger bond between stylus and N terminus happens less frequently and probably involves the fatty acid chains. In this case, rupture occurs at the level of the HPI hexamer: a single protomer is ripped out on retraction of the stylus. Although these two rupture events differ in force, the extension length distributions are similar (Figs. 2E and 3E), as expected from the nonspecific binding of the N terminus to the stylus.
The Interaction Between Protomers.
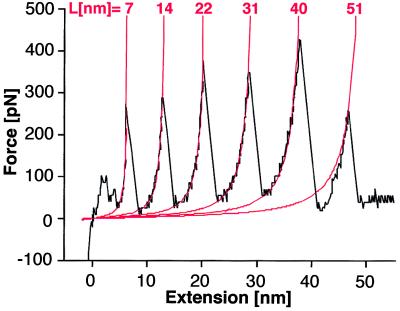
Equally spaced force peaks (Fig. 4 B and F) indicate a strong interaction between protomers through a flexible link that has a length of 7.3 ± 1.6 nm, close to the thickness of the HPI layer. It is interesting to compare our results with the forces required to unfold Ig segments of native and recombinant titin (10). These force-extension curves have peaks that are quite similar in shape and magnitude to those we report here for the HPI layer. As illustrated in Fig. 5, in fitting force-extension curves from the HPI layer with the worm-like chain equation, the best fit was found for a persistence length b = 0.4 nm, identical to the persistence length of the titin chain (10). This fit supports the idea of a polypeptide chain comprised of 26 residues with an extended length of 7.3 nm connecting HPI monomers. In the experiments with recombinant titin, the maximum number of peaks seen in one force curve corresponded to the number of Ig segments (either four or eight). We observe an analogous maximum of six peaks for the hexameric HPI protein complex. However, the titin peaks were separated by 28–29 nm, compatible with the unfolding of a polypeptide chain comprising 89 residues. With the HPI layer, the retracting stylus seems to extract the first protomer without unfolding it by simply stretching the intermolecular link until the neighboring protomer is pulled out, eventually leading to the unzipping of a complete HPI hexamer. The fact that several protomers can be pulled out sequentially implies that the interaction forces within hexamers are stronger than the forces between them. Thus, extraction of each protomer involves breakage of the spoke that connects hexamers within the HPI layer.
Figure 5.
Fit of the characteristic saw-tooth pattern obtained by the unzipping of the hexameric HPI protein complex (Fig. 4B). Each monomer is connected to its neighbor by a polypeptide whose extended length is 7.3 nm on average (Fig. 4F). Peaks can be fitted by using the worm-like chain equation: F(x) = (kT/b)[0.25(1 − x/L)−2 − 0.25 + x/L], taking a persistence length b = 0.4 nm. F represents the force, k the Boltzmann constant, T the absolute temperature, b the persistence length of the polypeptide chain, x the extension, and L the contour length of the polypeptide chain. This behavior compares favorably to the force-extension curves of titin molecules (10).
This explanation is a hypothesis that must await the availability of the HPI layer structure. Nevertheless, the results corroborate the chemical and mechanical stability of this bacterial surface layer. More importantly, however, we demonstrate that the AFM allows not only the measurement of intermolecular forces but also the direct visualization and correlation of resulting structural changes. This method will allow not only the study of the mechanical properties of biological membranes but also the assessment of the forces required to unfold membrane proteins.
Acknowledgments
We are grateful to Drs. Hermann Gaub, Jonathan Howard, Joerg Kistler, Shirley Müller, Filipp Oesterhelt, Kai Simons, and Calvin Quate for critically discussing the present work and for their support. This work was supported by the Swiss National Fund. We are grateful to the Max-Planck-Institute for Molecular Cell Biology and Genetics in Dresden for providing the AFM used.
Abbreviations
- AFM
atomic force microscopy
- HPI
hexagonally packed intermediate
References
- 1.Binnig G, Quate C F, Gerber C. Phys Rev Lett. 1986;56:930–933. doi: 10.1103/PhysRevLett.56.930. [DOI] [PubMed] [Google Scholar]
- 2.Drake B, Prater C B, Weisenhorn A L, Gould S A C, Albrecht T R, Quate C F, Cannell D S, Hansma H G, Hansma P K. Science. 1989;243:1586–1588. doi: 10.1126/science.2928794. [DOI] [PubMed] [Google Scholar]
- 3.Miles M. Science. 1997;277:1845–1846. doi: 10.1126/science.277.5333.1845. [DOI] [PubMed] [Google Scholar]
- 4.Engel A, Lyubchenko Y, Müller D J. Trends Cell Biol. 1999;9:77–80. doi: 10.1016/s0962-8924(98)01415-9. [DOI] [PubMed] [Google Scholar]
- 5.Müller D, Engel A. J Mol Biol. 1999;285:1347–1351. doi: 10.1006/jmbi.1998.2359. [DOI] [PubMed] [Google Scholar]
- 6.Müller D J, Sass H-J, Mülller S, Büldt G, Engel A. J Mol Biol. 1999;285:1903–1909. doi: 10.1006/jmbi.1998.2441. [DOI] [PubMed] [Google Scholar]
- 7.Lee G U, Kidwell D A, Colton R J. Langmuir. 1994;10:354–357. [Google Scholar]
- 8.Florin E-L, Moy V T, Gaub H E. Science. 1994;264:415–417. doi: 10.1126/science.8153628. [DOI] [PubMed] [Google Scholar]
- 9.Moy V T, Florin E-L, Gaub H E. Science. 1994;266:257–259. doi: 10.1126/science.7939660. [DOI] [PubMed] [Google Scholar]
- 10.Rief M, Gautel M, Oesterhelt F, Fernandez J M, Gaub H E. Science. 1997;276:1109–1112. doi: 10.1126/science.276.5315.1109. [DOI] [PubMed] [Google Scholar]
- 11.Oberhauser A F, Marszalek P E, Erickson H P, Fernandez J M. Nature (London) 1998;393:181–185. doi: 10.1038/30270. [DOI] [PubMed] [Google Scholar]
- 12.Beveridge T J. Int Rev Cytol. 1981;72:229–317. doi: 10.1016/s0074-7696(08)61198-5. [DOI] [PubMed] [Google Scholar]
- 13.Sleytr U B, Messner P. Annu Rev Microbiol. 1983;37:311–339. doi: 10.1146/annurev.mi.37.100183.001523. [DOI] [PubMed] [Google Scholar]
- 14.Baumeister W, Wildhaber I, Engelhardt H. Biophys Chem. 1988;29:39–49. doi: 10.1016/0301-4622(88)87023-6. [DOI] [PubMed] [Google Scholar]
- 15.Sleytr U B, Messner P, Pum D, Sára M. J Appl Bacteriol Symp Suppl. 1993;74:21S–32S. [Google Scholar]
- 16.Baumeister W, Barth M, Hegerl R, Guckenberger R, Hahn M, Saxton W O. J Mol Biol. 1986;187:241–253. doi: 10.1016/0022-2836(86)90231-7. [DOI] [PubMed] [Google Scholar]
- 17.Karrasch S, Hegerl R, Hoh J, Baumeister W, Engel A. Proc Natl Acad Sci USA. 1994;91:836–838. doi: 10.1073/pnas.91.3.836. [DOI] [PMC free article] [PubMed] [Google Scholar]
- 18.Müller D J, Baumeister W, Engel A. J Bacteriol. 1996;178:3025–3030. doi: 10.1128/jb.178.11.3025-3030.1996. [DOI] [PMC free article] [PubMed] [Google Scholar]
- 19.Müller D J, Fotiadis D, Engel A. FEBS Lett. 1998;430:105–111. doi: 10.1016/s0014-5793(98)00623-1. [DOI] [PubMed] [Google Scholar]
- 20.Möller C, Allen M, Elings V, Engel A, Müller D J. Biophys J. 1999;77:1050–1058. doi: 10.1016/S0006-3495(99)76966-3. [DOI] [PMC free article] [PubMed] [Google Scholar]
- 21.Engel A, Baumeister W, Saxton W. Proc Natl Acad Sci USA. 1982;79:4050–4054. doi: 10.1073/pnas.79.13.4050. [DOI] [PMC free article] [PubMed] [Google Scholar]
- 22.Peters J, Peters M, Lottspeich F, Schäfer W, Baumeister W. J Bacteriol. 1987;169:5216–5223. doi: 10.1128/jb.169.11.5216-5223.1987. [DOI] [PMC free article] [PubMed] [Google Scholar]
- 23.Thompson B G, Murray R G E, Boyce J F. Can J Microbiol. 1982;28:1081–1088. [Google Scholar]
- 24.Baumeister W, Karrenberg F, Rachel R, Engel A, Ten Heggeler B, Saxton W O. Eur J Biochem. 1982;125:535–544. doi: 10.1111/j.1432-1033.1982.tb06715.x. [DOI] [PubMed] [Google Scholar]
- 25.Müller D J, Amrein M, Engel A. J Struct Biol. 1997;119:172–188. doi: 10.1006/jsbi.1997.3875. [DOI] [PubMed] [Google Scholar]
- 26.Lee G U, Chrisey L A, Colton R J. Science. 1994;266:771–773. doi: 10.1126/science.7973628. [DOI] [PubMed] [Google Scholar]
- 27.Dammer U, Popescu O, Wagner P, Anselmetti D, Guntherodt H J, Misevic G N. Science. 1995;267:1173–1175. doi: 10.1126/science.7855599. [DOI] [PubMed] [Google Scholar]
- 28.Merkel R, Nassoy P, Leung A, Ritchie K, Evans E. Nature (London) 1999;397:50–53. doi: 10.1038/16219. [DOI] [PubMed] [Google Scholar]
- 29.Müller D J, Fotiadis D, Scheuring S, Müller S A, Engel A. Biophys J. 1999;76:1101–1111. doi: 10.1016/S0006-3495(99)77275-9. [DOI] [PMC free article] [PubMed] [Google Scholar]


