Abstract
Aggregation of Ig light chains to form amyloid fibrils is a characteristic feature of light-chain amyloidosis, a light-chain deposition disease. A recombinant variable domain of the light chain SMA was used to form amyloid fibrils in vitro. Fibril formation was monitored by atomic force microscopy imaging. Single filaments 2.4 nm in diameter were predominant at early times; protofibrils 4.0 nm in diameter were predominant at intermediate times; type I and type II fibrils 8.0 nm and 6.0 nm in diameter, respectively, were predominant at the endpoints. The increase in number of fibrils correlated with increased binding of the fluorescent dye thioflavin T. The fibrils and protofibrils showed a braided structure, suggesting that their formation involves the winding of protofibrils and filaments, respectively. These observations support a model in which two filaments combine to form a protofibril, two protofibrils intertwine to form a type I fibril, and three filaments form a type II fibril.
Anumber of fatal diseases are associated with the deposition of insoluble protein fibrils (amyloid) in various organs. Some examples are Alzheimer’s, systemic amyloidoses, prion disease, and type II diabetes mellitus. As determined by electron microscopy (EM) and x-ray fiber diffraction, the overall morphology of fibrils from different polypeptides is surprisingly similar. However, little is known about the underlying molecular structure.
In recent years, it has become possible to study biological samples by using atomic force microscopy (AFM) imaging, particularly when the sample is deposited on a solid support such as mica (1). AFM provides accurate measurements of the height of the sample above the mica substrate, but the large size of the scanning tip relative to the sample leads to an overestimation of the sample width. Despite the inaccuracy in widths, AFM has several advantages over EM and other techniques in imaging biological samples (2–4). In particular, AFM is a noninvasive technique by which the fibrils are observed directly. Therefore, the images represent true morphology, in contrast to the negative staining used in EM studies, which may affect the morphology of the fibrils.
One of several light-chain deposition diseases, light-chain amyloidosis involves the aggregation of the variable domain of Ig light chains into fibrils. It is the most common systemic amyloidosis (5–8). In the present investigation, the protein studied was SMA, a variable domain from amyloid fibrils of a light-chain amyloidosis patient (9). Recombinant SMA (10) forms fibrils in vitro that are indistinguishable from naturally occurring light-chain fibrils by EM (5). Light-chain domains such as SMA have a natural tendency to dimerize (analogous to the light-chain–heavy-chain interaction); for SMA, the Kd for dimerization is 40 μM (11). The present work is part of an ongoing investigation into the mechanism of fibril formation in which the time evolution of the different fibrillar species were observed and correlated with other methods of monitoring fibril formation, such as dye-binding studies. Typically, the time course of amyloid fibril formation has been monitored by light scattering (12–14) and occasionally by binding of the dyes like thioflavin (15); these techniques show specificity toward fibrils.
AFM has been used for the study of a few protein systems that form amyloid: Alzheimer’s Aβ peptides (2, 3, 16), α-synuclein (17), and amylin fibrils (18). The kinetics of amylin fibril formation were observed in an elegant study by using a liquid AFM cell in which the increase in the length of the same fibril was observed over a period of time (18). However, the final amylin fibril diameters observed in these experiments were different from those observed when the fibrils were grown in a test tube because of constraints on the fibril caused by the attachment to the surface of the mica (19). In the present study, we followed the approach used by Harper et al. (16) by which fibril formation was studied by AFM imaging of samples extracted at different time points in the aggregation reaction. A fibril formation model involving a hierarchical assembly process from the filaments (the smallest fibrillar species) to fibrils (the largest ones) was proposed based on our observations. This model contrasts the one in which fibril growth occurs by extension of existing fibrils through accretion of soluble subunits (monomers or oligomers).
Materials and Methods
Protein Purification.
The SMA expression system was a gift from Fred Stevens (Argonne National Laboratories). SMA was purified by using the following modifications to the reported protocol (10). The periplasmic extraction was done with sucrose and water extraction without addition of lysozyme. The extract was dialyzed in 10 mM sodium acetate (pH 5.6), loaded on an SP Sepharose column (Amersham Pharmacia), and eluted with 10 mM phosphate buffer (pH 8.0). Fractions were assayed with SDS/PAGE, and the pure fractions were pooled and filtered through a 0.22-μm filter to remove any precipitates or large aggregates. Samples were stored at 4°C at which aggregation is undetectable on a time scale of months.
Aggregation was typically initiated by stirring solutions of 0.5 mg⋅ml−1 SMA at 37°C. Fibril formation showed the typical lag-exponential growth kinetics in which the length of the lag was highly dependent on the pH and ionic strength. In this study, fibrils were grown at pH 5.6 in 50 mM sodium acetate buffer (100 mM salt) and at pH 2.0 in 20 mM HCl. Fibril formation was monitored by measuring the fluorescence of 10-μl aliquots added to 1.0 ml of 10 μM thioflavin T (17). The excitation was at 450 nm, and the fluorescence emission was monitored at 484 nm.
AFM Imaging.
The samples were imaged with an Autoprobe CP AFM (Park Scientific, Sunnyvale, CA). In the AFM, a laser beam is reflected from the top of a small metal cantilever into a split photodiode. When the sharp tip of the cantilever (radius of 10 nm) comes into contact with the sample, the deflection of the laser beam can be detected by the difference in the signal from the top and bottom halves of the photodiode. A piezoelectric tube raster scans the sample underneath the tip; it also moves the sample up and down to keep the deflection of the cantilever constant. AFM images are obtained by plotting the z movement as a function of xy position. The tube scanner was a 100-μm Scanmaster (Park Scientific). NC Ultralevers (Park Scientific) were used as cantilevers.
The images shown were taken in the noncontact AFM imaging mode. Noncontact AFM is an imaging mode in which the cantilever is set vibrating in the z direction at a resonant frequency of about 100 kHz. Approaching the sample results in a dampening of the amplitude of vibration of the cantilever. The piezo raster scans the sample and moves it in the z direction to keep the amplitude of vibration constant. The advantage of the noncontact AFM imaging mode over the conventional AFM mode described above (contact mode) is that the tip–sample forces are greatly reduced; thus, the damage to biological samples is also reduced. The images were taken in air, in ambient conditions, and at a scan frequency of 1–2 Hz.
Samples were prepared for AFM imaging by drying a 5-μl sample from the reaction mixture on freshly cleaved mica with nitrogen gas. The buffer was washed from the surface of the mica with double-distilled water, and the mica was dried again. For samples of fibrillar material at higher pHs, it was necessary to remove amorphous aggregated material by washing and centrifugation.
Height, Periodicity, and Amplitude Measurements.
Height measurements were made from scan size of 5- × 5-μm or less by measuring height profiles perpendicular to the fibril over a region greater than the periodicity of height variations and averaging the peak height of the profile. Heights for the different fibril species were obtained by averaging measurements from a large number of individual fibrils (>50), with errors being calculated as one standard deviation from the mean. Fibril periodicities were determined by drawing straight lines along the length of the fibrils and averaging the peak-to-peak distances. Amplitudes were determined by averaging peak-to-trough height differences (all errors were standard deviations from the mean).
Results and Discussion
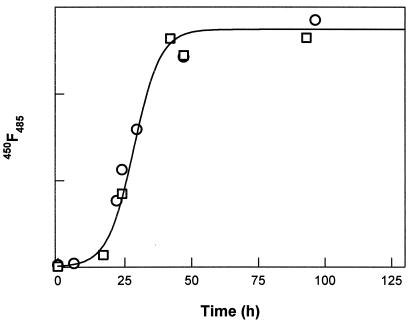
The SMA variable domain formed amyloid fibrils in vitro under a wide variety of conditions. Fibril formation arises from a partially folded intermediate that is preferentially populated at acidic pH values (A. Talapatra, J.R.G., R.K., and A.L.F., unpublished work). Fibril formation was monitored by thioflavin T fluorescence (see Fig. 5) and transmission EM with uranyl acetate staining (data not shown). Some incubation conditions favored individual fibrils, whereas others led to clusters or clumps of fibrils. EM images of fibrils grown at a variety of pH values from pH 2 to 8 were indistinguishable, suggesting that the fibril morphology is independent of pH. The rate of fibril formation is very dependent on the incubation conditions, but typically mature fibrils predominate after 2–3 weeks in the pH 5–6 range (corresponding to pH values found in the kidneys) and after 1 week at pH 2–3. At higher acidic pH values, both amorphous aggregation and fibril formation were observed, making the kinetics analysis with AFM rather difficult (J.R.G., R.K., and A.L.F, unpublished work). For the time-lapsed AFM studies, fibrils were grown at pH 2.0 at 37°C with gentle stirring. Under these conditions, no amorphous aggregate was formed, permitting direct observation of the fibrillar material by AFM. The amorphous aggregates have much higher heights than those of the fibrils, thus complicating imaging of the fibrils when both types of aggregates are present. The fibrillar species observed at pH 2 are indistinguishable by AFM from the corresponding species grown at higher pH. Under the experimental conditions used to study the aggregation of SMA, 50% will initially be present as the dimer, because the concentration used in the incubation mixtures corresponds to the dimerization constant. At early times of incubation under conditions leading to aggregation, species consistent with both monomer (2.5 ± 0.5 nm) and dimer (4.5 ± 0.5 nm) were observed (Fig. 1, blue arrows).
Figure 5.
The increase in the thioflavin T dye binding monitored by fluorescence emission during the fibril formation reaction for two different incubations is shown by open circles and squares; the line is a sigmoid fit to data. This increase in the thioflavin T dye binding correlates well with the increase in total length and number of fibrillar species (data not shown).
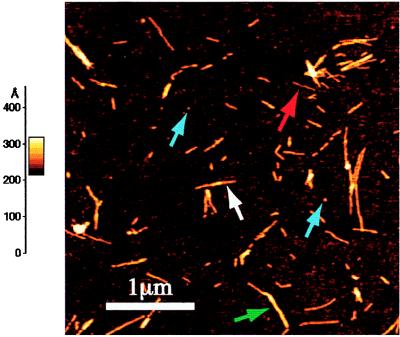
Figure 1.
An AFM image after a 10-h incubation at 37°C with stirring. The scale on the left represents the height of pixels in the image; the lighter the color the higher the feature is from the surface. This image is dominated by protofibrils (white arrow), with a small population of fibrils (green arrow), a filament (red arrow), and some monomers and dimers (blue arrows) in the field of view.
Fibril Dimensions.
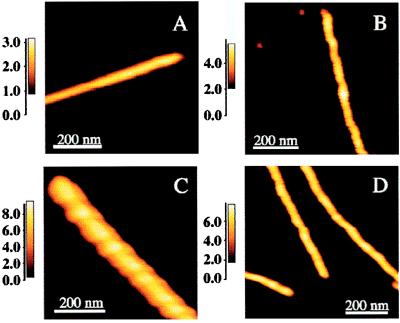
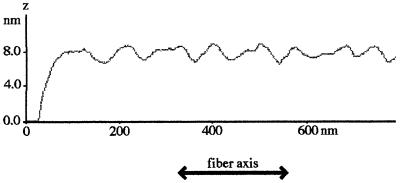
Analysis of AFM images of SMA fibril preparations identified four types of fibril species: filaments, protofibrils, and two types of fibrils. A typical field of view at an early intermediate incubation time showing monomers, dimers, and fibrillar species is shown in Fig. 1. Filaments have a height of 2.4 ± 0.4 nm and no significant height variation along their axis (Fig. 2A). Protofibrils have an average height of 4.0 ± 0.5 nm (Fig. 2B) and show periodicities of 60 ± 10 nm with amplitudes of 0.8 ± 0.4 nm (the average height was determined by averaging the cross-sectional height profiles, i.e., perpendicular to the fibril axis, over a significant length of the fibril). The protofibril lengths varied but typically were 100–700 nm. Type I fibrils (Fig. 2C) have a mean fibril height of 8.3 ± 1.0 nm. In addition, type II fibrils of a mean height of 5.9 ± 0.6 nm were also observed. The fibril lengths varied but were typically on the order of 0.1–1 μm. The type I fibrils have a periodicity of 100 ± 10 nm and an amplitude of 16 nm (Fig. 3). Assuming that the fibril is symmetric about its axis, the maximum diameter is represented by the sum of its average height (8.3 nm) and half of its amplitude (1.6 ± 0.3 nm). Thus, type I fibrils have a maximum diameter of 9.1 nm. The large numbers of relatively short fibrillar species observed at low pH are probably caused by the large number of nucleation sites formed rapidly under these conditions; thus, there is insufficient monomer to allow fibrils (etc.) to grow to their potential full length. The overall dimensions from the AFM images of SMA fibrils and protofibrils are in excellent agreement with those made for the ex vivo light-chain fibrillar deposits imaged on tissue sections by using high-resolution transmission EM (ref. 5; Fig. 2).
Figure 2.
A typical SMA filament (A), protofibril (B), type I fibril (C) and type II fibril (D) as observed by using AFM. The average heights for several filaments, protofibrils, and type I and type II fibrils were measured to be 2.4 ± 0.3, 4.0 ± 0.4, 8.3 ± 0.9, and 5.9 ± 0.5 nm, respectively. Note that the widths depend on tip geometry and that the vertical scales are different.
Figure 3.
A typical fibril height profile along the fibril axis. The average peak-to-trough variation in the height on the surface of the type I fibril is 1.6 ± 0.3 nm. This height variation is consistent with braiding of two protofibrils in the type I fibril.
Kinetics of Fibril Formation.
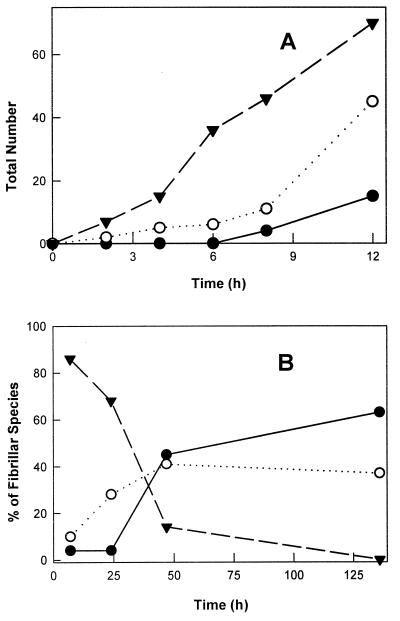
At early time points, filaments predominated over protofibrils and fibrils. The number of the filaments increases up to 12 h, followed by a decrease in the next few days. Very few protofibrils and fibrils are observed up to 10 h (Fig. 4A), but their numbers increase and predominate after a few days (Fig. 4B). The increase in the number of filaments at very early time points (Fig. 4A) and a simultaneous increase in their length (data not shown) suggest the sequential association of monomers to form filaments. The decrease in filaments and a simultaneous increase in the protofibrils and fibrils (Fig. 4B) are indicative of the assembly process involving filaments intertwining to form protofibrils and fibrils, as explained in the model described below.
Figure 4.
(A) The number of filaments (triangles and dashed lines), protofibrils (open circles and dotted lines), and fibrils (filled circles and solid lines) observed in a 5- × 5-μm scan as a function of time, showing a more rapid increase in the number of filaments relative to protofibrils and fibrils at early time points. (B) The relative distribution of filaments, protofibrils, and fibrils (symbols as in A) for later time points, illustrating a decrease in the number of filaments with a simultaneous increase in protofibrils and fibrils.
The thioflavin T dye binding (Fig. 5), as monitored by fluorescence emission at 484 nm, also increases on a time scale similar to that of the increase of the numbers of protofibrils and fibrils. This similarity indicates that thioflavin T is binding to fibrillar species and hence is a good probe for the growth of the amyloid fibrils.
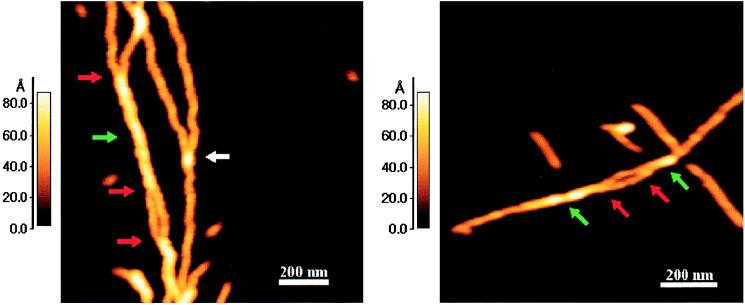
In support of the hierarchical assembly of two protofibrils forming a fibril, occasional branching of a fibril into two protofibrils was observed (see Fig. 6; the red arrows point to regions in which a fibril branches into two protofibrils). That the region shown by the green arrow is indeed a fibril and not two overlaying protofibrils is evident, because the measured height of the fibril at the periodic low points is less then the sum of the two adjacent protofibrils at their maximum heights (see Fig. 3) and because the region’s periodicity is 100 nm. It is important to distinguish between true branch points and artifacts arising from overlapping fibril ends. Such artifacts are readily distinguished by the increased height at the overlap, e.g., the white arrow in Fig. 6. Examples of protofibrils branching into two filaments were also observed, and frequently, fibrillar species were seen in which the height corresponded to a protofibril up to a certain point and to a filament thereafter, indicating interaction between a shorter and longer filament. Similar observations were also made with fibrils, which had extensions corresponding to a single protofibril.
Figure 6.
Examples of branched fibrils indicating that they are composed of intertwined protofibrils. Both panels show fibrils (indicated by green arrows) that have a maximum height of 8.8 and a minimum height of 6.8 nm. Red arrows represent the regions in which two protofibrils (maximum height of 4.5 nm) were observed to branch out of the fibril. The regions in between the two red arrows in both the panels represent short portions of protofibrils that have come apart and are not intertwined. The white arrow represents a false branch point at which one protofibril simply lies on top of another and there is no intertwining.
It is interesting to note the similarities and differences between the fibrillar species of SMA and those of Aβ and amylin. Smooth thin filaments are observed for SMA and amylin but not Aβ, whereas similar-looking braided fibrils of 7–8 nm are seen for all three polypeptides. Interestingly, although the periodicity of Aβ fibrils is half of that of SMA fibrils, for both, the ratio of the fibril periodicity to the protofibril periodicity is the same (a factor of ≈2). Both branched and staggered fibrils also have been reported for Aβ (16).
SMA Fibril Model.
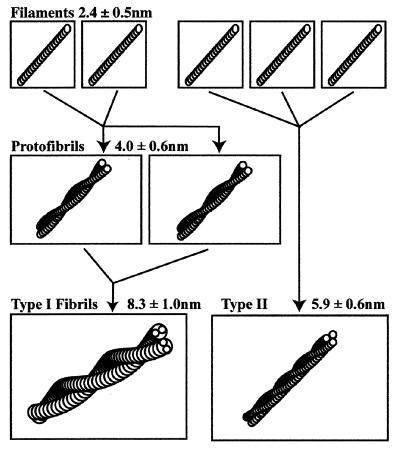
The simplest model for the formation of SMA fibrils is as follows: two filaments intertwine to form a protofibril, whereas two protofibrils intertwine to form a type I fibril. The dimensions of type II fibrils are consistent with the dimensions of three intertwining filaments (Fig. 7).
Figure 7.
This model describes the formation of protofibrils and type I and type II fibrils from filaments. The model posits that two filaments intertwine to form a protofibril. Two protofibrils pack against each other, as shown, to form a type I fibril, in which the average height of the fibril is less than twice the average protofibril height. Based on the filament and protofibril dimensions, the model predicts a maximum height (diameter) for type I fibrils of 9.1 nm, which is in good agreement with the observed value, 8.8 ± 0.4 nm. The model also predicts that the type II fibrils are made of three filaments.
Starting with the measured filament diameter of 2.4 nm, our model predicts the maximum protofibril diameter to be the sum of two filament diameters, 4.8 nm. The minimum diameter would then be 1.5 times the filament diameter because of the fact that, at low points, the protofibril will be raised off the substrate. This conclusion is supported by the observation that the protofibril periodicity is 50 times the filament diameter, indicating that the filaments are behaving like stiff rods. The predicted minimum protofibril diameter is 3.6 nm. The measured protofibril diameter should then be the mean of the two or 4.2 nm. This value is within the standard deviation of our measured value for the average protofibril diameter, 4.0 ± 0.5 nm. By using the same method, the average type I fibril height is predicted to be 1.75 times the protofibril average height, 7.4 nm. The measured value was 8.0 ± 0.9 nm.
The presence of some short fibrils raises the question of whether, in addition to the intertwining of protofibrils, fibril seeds can grow through the addition of tetramers (or four monomers or two dimers) on their ends.
Although no crystallographic structure for SMA is available, SMA is highly homologous to a related variable domain, LEN, whose structure has recently been reported (20). Thus, monomeric, native SMA can be assumed to be an elongated molecule. The minimum dimension is ≈2.4 nm; the maximum is ≈4.5 nm. Interestingly, the diameter of the filaments is close to the minimum dimension of monomeric SMA. This similarity suggests that, if the filaments are formed from SMA in a relatively native conformation and topology, the SMA monomers are initially polymerizing with the axis of the filament parallel to the long dimension of the monomeric native state. This polymerization would result in the β-strands running parallel to the axis of the fiber. However, such a structure is in contradiction to x-ray fiber diffraction data of fibrils from various proteins (21, 22), which indicate that the β-strands run orthogonal to the axis of the fibril. Thus, it is more likely that, in the partially folded intermediate from which the filament is formed, the secondary structure and especially the topology are significantly different from those in the native state. In particular, if the β-strands present in the native conformation rearrange, they could form a β-sheet structure that was no more than 2.5 nm long in the direction of the β-strands. Such a structure would allow a filament to involve an essentially continuous twisted sheet in which the strands ran orthogonal to the axis, as suggested by fiber x-ray diffraction data. The proposed model for protofibril structure is similar to that suggested for transthyretin fibrils based on x-ray diffraction (22).
Stevens et al. (23) have proposed a model for SMA fibrils in which native-like dimers interact by a 90° rotation about their 2-fold axis to form filaments ≈5 nm in diameter, which then form fibrils (10 nm in diameter) by antiparallel lateral interaction. Although the filaments observed by AFM are clearly too small to correspond to the dimers in Stevens’ model, such dimers might be compatible with the observed protofibrils. Additional evidence against a model involving native-like conformations is the fact that fibrils grow more readily at low pH. Further support for our model comes from the studies on amylin that showed that, if fibril growth was constrained by attachment to the mica surface, only filaments (called protofibrils for amylin) and protofibrils were observed by AFM, whereas, under otherwise identical conditions, if the fibrils were grown in solution and unattached to a surface, then fibrils consisting of intertwined protofibrils were observed (18, 19).
The data reported here thus support a model for fibril formation in which the key species, in terms of elongation, are the filaments, the initially formed fibrillar species. The filaments thus intertwine to form the protofibrils and fibrils.
Acknowledgments
We thank Fred Stevens and Rosemarie Raffen (Argonne National Laboratories) for the expression systems and for helpful discussions and Beat Ruhstaller and Valery Bliznyuk for helpful discussions on imaging techniques. This work was supported by grants from the National Science Foundation (to A.L.F.) and by the Packard Foundation (to S.A.C.).
Abbreviations
- EM
electron microscopy
- AFM
atomic force microscopy
Footnotes
This paper was submitted directly (Track II) to the PNAS office.
References
- 1.Muller D J, Amrein M, Engel A. J Struct Biol. 1997;119:172–188. doi: 10.1006/jsbi.1997.3875. [DOI] [PubMed] [Google Scholar]
- 2.Stine W B, Jr, Snyder S W, Ladror U S, Wade W S, Miller M F, Perun T J, Holzman T F, Krafft G A. J Protein Chem. 1996;15:193–203. doi: 10.1007/BF01887400. [DOI] [PubMed] [Google Scholar]
- 3.Harper J D, Wong S S, Lieber C M, Lansbury P T. Chem Biol. 1997;4:119–125. doi: 10.1016/s1074-5521(97)90255-6. [DOI] [PubMed] [Google Scholar]
- 4.Hansma H G, Kim K J, Laney D E, Garcia R A, Argaman M, Allen M J, Parsons S M. J Struct Biol. 1997;119:99–108. doi: 10.1006/jsbi.1997.3855. [DOI] [PubMed] [Google Scholar]
- 5.Shirahama T, Cohen A S. J Cell Biol. 1967;33:679–708. doi: 10.1083/jcb.33.3.679. [DOI] [PMC free article] [PubMed] [Google Scholar]
- 6.Glenner G G, Ein D, Eanes E D, Bladen H A, Terry W, Page D L. Science. 1971;174:712–714. doi: 10.1126/science.174.4010.712. [DOI] [PubMed] [Google Scholar]
- 7.Shirahama T, Benson M D, Cohen A S, Tanaka A. J Immunol. 1973;110:21–30. [PubMed] [Google Scholar]
- 8.Linke R P, Tischendorf F W, Zucker-Franklin D, Franklin E C. J Immunol. 1973;111:24–26. [PubMed] [Google Scholar]
- 9.Pras M, Schubert M, Zucker-Franklin D, Rimon A, Franklin E C. J Clin Invest. 1968;47:924–933. doi: 10.1172/JCI105784. [DOI] [PMC free article] [PubMed] [Google Scholar]
- 10.Stevens P W, Raffen R, Hanson D K, Deng Y L, Berrios-Hammond M, Westholm F A, Murphy C, Eulitz M, Wetzel R, Solomon A, et al. Protein Sci. 1995;4:421–432. doi: 10.1002/pro.5560040309. [DOI] [PMC free article] [PubMed] [Google Scholar]
- 11.Kolmar H, Frisch C, Kleemann G, Gotze K, Stevens F J, Fritz H J. Biol Chem Hoppe-Seyler. 1994;375:61–70. doi: 10.1515/bchm3.1994.375.1.61. [DOI] [PubMed] [Google Scholar]
- 12.Turnell W, Sarra R, Baum J O, Caspi D, Baltz M L, Pepys M B. Mol Biol Med. 1986;3:409–424. [PubMed] [Google Scholar]
- 13.Shen C L, Scott G L, Merchant F, Murphy R M. Biophys J. 1993;65:2383–2395. doi: 10.1016/S0006-3495(93)81312-2. [DOI] [PMC free article] [PubMed] [Google Scholar]
- 14.Lomakin A, Chung D S, Benedek G B, Kirschner D A, Teplow D B. Proc Natl Acad Sci USA. 1996;93:1125–1129. doi: 10.1073/pnas.93.3.1125. [DOI] [PMC free article] [PubMed] [Google Scholar]
- 15.LeVine H., III Protein Sci. 1993;2:404–410. doi: 10.1002/pro.5560020312. [DOI] [PMC free article] [PubMed] [Google Scholar]
- 16.Harper J D, Lieber C M, Lansbury P T., Jr Chem Biol. 1997;4:951–959. doi: 10.1016/s1074-5521(97)90303-3. [DOI] [PubMed] [Google Scholar]
- 17.Conway K A, Harper J D, Lansbury P T. Nat Med. 1998;4:1318–1320. doi: 10.1038/3311. [DOI] [PubMed] [Google Scholar]
- 18.Goldsbury C, Kistler J, Aebi U, Arvinte T, Cooper G J. J Mol Biol. 1999;285:33–39. doi: 10.1006/jmbi.1998.2299. [DOI] [PubMed] [Google Scholar]
- 19.Goldsbury C S, Cooper G J, Goldie K N, Muller S A, Saafi E L, Gruijters W T, Misur M P, Engel A, Aebi U, Kistler J. J Struct Biol. 1997;119:17–27. doi: 10.1006/jsbi.1997.3858. [DOI] [PubMed] [Google Scholar]
- 20.Huang D B, Chang C H, Ainsworth C, Johnson G, Solomon A, Stevens F J, Schiffer M. Mol Immunol. 1997;34:1291–1301. doi: 10.1016/s0161-5890(98)00002-9. [DOI] [PubMed] [Google Scholar]
- 21.Inouye H, Fraser P E, Kirschner D A. Biophys J. 1993;64:502–519. doi: 10.1016/S0006-3495(93)81393-6. [DOI] [PMC free article] [PubMed] [Google Scholar]
- 22.Blake C, Serpell L. Structure (London) 1996;4:989–998. doi: 10.1016/s0969-2126(96)00104-9. [DOI] [PubMed] [Google Scholar]
- 23.Stevens F J, Myatt E A, Chang C H, Westholm F A, Eulitz M, Weiss D T, Murphy C, Solomon A, Schiffer M. Biochemistry. 1995;34:10697–10702. doi: 10.1021/bi00034a001. [DOI] [PubMed] [Google Scholar]


