Abstract
The Edman Sequencing Research Group (ESRG) designs studies on the use of Edman degradation for protein and peptide analysis. These studies provide a means for participating laboratories to compare their analyses against a benchmark of those from other laboratories that provide this valuable service. The main purpose of the 2006 study was to determine how accurate Edman sequencing is for quantitative analysis of polypeptides. Secondarily, participants were asked to identify a modified amino acid residue, N-ɛ-acetyl lysine [Lys(Ac)], present within one of the peptides. The ESRG 2006 peptide mixture consisted of three synthetic peptides. The Peptide Standards Research Group (PSRG) provided two peptides, with the following sequences: KAQYARSVLLEKDAEPDILELATGYR (peptide B), and RQAKVLLYSGR (peptide C). The third peptide, peptide C*, synthesized and characterized by ESRG, was identical to peptide C but with acetyl lysine in position 4. The mixture consisted of 20% peptide B and 40% each of peptide C and its acetylated form, peptide C*. Participating laboratories were provided with two tubes, each containing 100 picomoles of the peptide mixture (as determined by quantitative amino acid analysis) and were asked to provide amino acid assignments, peak areas, retention times at each cycle, as well as initial and repetitive yield estimates for each peptide in the mixture. Details about instruments and parameters used in the analysis were also collected. Participants in the study with access to a mass spectrometer (MALDI-TOF or ESI) were asked to provide information about the relative peak areas of the peptides in the mixture as a comparison with the peptide quantitation results from Edman sequencing. Positive amino acid assignments were 88% correct for peptide C and 93% correct for peptide B. The absolute initial sequencing yields were an average of 67% for peptide (C+C*) and 65.6 % for peptide B. The relative molar ratios determined by Edman sequencing were an average of 4.27 (expected ratio of 4) for peptides (C+C*)/B, and 1.49 for peptide C*/C (expected ratio of 1); the seemingly high 49% error in quantification of Lys(Ac) in peptide C* can be attributed to commercial unavailability of its PTH standard. These values compare very favorably with the values obtained by mass spectrometry.
Keywords: Edman sequencing, phenylthiohydantoin (PTH) amino acid, polypeptide quantitation, quantitative analysis
Automated Edman degradation as implemented in current sequencers removes amino acids sequentially as anilinothiozolinone (ATZ) derivatives from the amino terminus of a polypeptide. This relatively labile ATZ derivative is then converted to a more stable phenylthiohydantoin (PTH) derivative. The PTH amino acids (PTH-AAs) are identified by their retention times and quantified from their peak areas or peak heights during analysis by high-performance liquid chromatography (HPLC). In order to assure accurate quantitation, a carefully measured volume of a solution containing PTH-AA standards at a known concentration is typically analyzed just before the first amino acid from the sample being sequenced. By automating the initial transfer of the PTH amino acid standards, initially to the conversion flask on the sequencer and then to the online HPLC system so that it occurs via the same hardware that is used for transferring PTH-AAs from the polypeptide being sequenced, contemporary sequencers eliminate losses during transfer to the HPLC system as a source of error for quantitative determination of amino acids derived from the protein. Nevertheless, losses may occur at earlier stages in the sequencing process. For example, some fraction of a peptide placed in a sequencer may fail to adhere to the sequencing support and wash out, or it may fail to react with the sequencing reagents to produce a PTH amino acid. Also, extraction of the liberated amino acid from the sample support and transfer to the conversion flask may be incomplete. Nonspecific losses during sequencing affect all peptides in the mixture equally, resulting in absolute initial yields that are lower than expected for all peptides. The ratio of peptides in a mixture should not change if there are nonspecific losses. Losses that are peptide dependent decrease the initial yield of one peptide more than that of another, resulting in relative yields of the peptides in the mixture different from the expected values.
To evaluate quantitative aspects of Edman sequencing in contemporary instruments, we provided study participants with a sample containing three well-characterized polypeptides. Two of the polypeptides were provided by the ABRF Peptide Standards Research Group. The third was a homologue of one of these peptides. The homologous peptide was synthesized by a member of the ESRG and differed in a single amino acid modification. The homologous peptide was quantified from its absorbance at 280 nm and by amino acid analysis. Including this homologous peptide gave participants the additional challenge of identifying the modified amino acid. Participants were asked to provide sequencing data used to determine both the absolute and relative amounts of the different polypeptides in the mixture.
The ESRG 2006 study is the eighteenth in a series on Edman sequencing conducted for the ABRF by the Edman Sequencing research group. The objectives and results of the 17 previous studies are summarized in Table 1 (1–17).
TABLE 1.
Summary of Previous ABRF Edman Sequencing Studies
| Sample | Description | Study Purpose | Amount (pmol) | Positive Accuracy | Tentative Accuracy | No. of Participants |
|---|---|---|---|---|---|---|
| STD-1 | Peptide | Sequence analysis | 100 | 95% | 48% | 54 |
| ABRF-89SEQ | 2 peptides | Differentiation of 2 sequences | 240/48 | 95% | 57% | 48 |
| ABRF-90SEQ | Peptide conjugated to acetylated protein (PVDF) | Evaluate PVDF-bound sample | 30 | 82% | 43% | 55 |
| ABRF-91SEQ | Peptide conjugated to acetylated protein | Compare solution sample to PVDF | 50 | 83% | 55% | 90 |
| ABRF-92SEQ | Peptide | Determine 2 posttranslational modifications (PSer & HyPro) | 500 | 94% | 64% | 74 |
| ABRF-93SEQ | Rearrangement of STD1 | Determine improvement | 50 | 91% | 56% | 80 |
| ABRF 94SEQ | Protein | Cys & Trp determination | 50 | 96% | 55% | 78 |
| ABRF-95SEQ | Protein | 4 Cycles of microheterogeniety, length of sequence read | 45 | 78% | 45% | 71 |
| ABRF-96SEQA | Dataset | Single sequence calling ability | 40 | 100% | 86% | 95 |
| ABRF-96SEQB major | Dataset | Sequence calling ability in a mixture | 10 | 96% | 58% | 95 |
| ABRF-96SEQB minor | Dataset | Sequence calling ability in a mixture | 2 | 86% | 38% | 95 |
| ABRF-97SEQ major | Peptide, rear-rangement of 96SEQB major | Compare lab-generated data to previous year’s dataset | 10 | 92% | 54% | 50 |
| ABRF-97SEQ minor | Peptide, rear-rangement of 96SEQB minor | Compare lab-generated data to previous year’s dataset | 2 | 72% | 38% | 50 |
| ABRF-98SEQ | Peptide | Read low-level sequence & use MS/MS data if possible | 2.8 | 91% | 45% | 56 |
| ABRF-99SEQ protein | Protein/peptide mix | Distinguish 2 sequences, protein ID using BLAST search | 10 | 99% | 58% | 45 |
| ABRF-99SEQ peptide | Protein/peptide mix | Distinguish 2 sequences | 5 | 95% | 62% | 45 |
| ABRF-00SEQ | Rearrangement of ABRF-92SEQ | Determine 2 post translational modifications | 5 | 86% | 47% | 46 |
| ESRG-2002 | Protein | Heterogeneous N-terminus, protein ID using BLAST | 35 | 76% | 73% | 31 |
| ESRG-2003 | Protein | Homogeneous N-terminus, protein ID | 13.5 | 97% | 77% | 46 |
| ESRG-2004 | Peptide | Identify 7 post translational modifications | 775 | 96% | 57% | 20 |
| ESRG-2005 | Peptide | Identify 7 additional post translational modifications | 2000 | 80% | 42% | 27 |
| ESRG-2006 | 3 Peptide Mix | Sequence & quantify peptides identify modified amino acid | 40/40 (2 homologs) | 88% | 67% | 18 |
| 20 (third peptide) | 93% | 44% |
MATERIALS AND METHODS
Sample preparation
Peptide standards (NIST Peptide Set for Biomolecular Measurements, SRM2397) were synthesized and purified by the Peptide Standards Research Group of the ABRF in collaboration with the National Institute of Standards and Technology (NIST). This set of standards consists of three polypeptides, each at least 95% pure and supplied in separate vials containing 1 mg of the dried peptide. In addition, a version of peptide C was synthesized that was modified by incorporation of an acetylated Lys residue at position 4 in the sequence. That peptide, designated peptide C*, was synthesized on a Milligen 9050+ peptide synthesizer using Fmoc chemistry starting with Fmoc-L-Arg(Pbf)-PEG-PS resin (Applied Biosystems) with HCTU (1-H-benzotriazolium-1-[bis(dimethylamino)-methylene]-5-chloro-hexafluoro-phosphate-(1-), 3-oxide) as the coupling reagent except for Fmoc-Val, where HATU (N-{(dimethylamino)-1H-1,2,3-triazolo[4,5-b]pyridino-1-ylmethylene}-N-methylmethanaminium hexafluorophosphate N-oxide) was used. Fmoc-L-Lys(Ac)-OH was from AnaSpec. Other Fmoc amino acids were from NovaBiochem, AnaSpec, and Peptides International. After synthesis, the peptide was cleaved from the resin using 92.5% trifluoroacetic acid (TFA) containing 2.5% each of triisopropylsilane, water, and ethanedithiol for 3 h, followed by precipitation and washing three times with diethyl ether. After drying overnight under vacuum, about half of the crude peptide was dissolved in water and purified by HPLC using a 2.12 × 25 cm Jupiter Proteo C12 column (Phenomenex) operated at a flow rate of 17 mL/min and using a gradient of 15% to 28% acetonitrile in water containing 0.1% TFA over 15 min and monitoring absorbance at 220 nm. A large peak at 12 min (ca. 25% acetonitrile) due to the peptide was collected, analyzed by MALDI-TOF mass spectrometry and Edman sequencing, and dried in a SpeedVac (Savant). This peptide was dissolved in water to give a 525 μM stock solution, the concentration of which was determined initially from its 280 nm absorbance and then corrected by amino acid analysis performed on a dried 5 μL aliquot at the Keck Biotechnology Resource Laboratory at Yale University.
The peptides used in this study were therefore as follows:
Peptide B (20 pmol): KAQYARSVLLEKDAEPDILELATGYR
Peptide C (40 pmol): RQAKVLLYSGR
Peptide C* (40 pmol): RQAK(ɛ-acetyl)VLLYSGR
Samples for distribution to study participants were prepared as follows. Peptide standards B and C (1 mg) were dissolved separately in 5 mL of 30% acetonitrile in water containing 10 mM trifluoroacetic acid (TFA), resulting in stock solutions containing 67.8 μM Peptide B and 155 μM Peptide C. The final peptide mixture was then prepared by adding 15.25 μL C*, 59 μL B, and 51.6 μL C to 1874 μL of 30% acetonitrile in water with 10 mM TFA to give a stock solution containing 4.0 μM C*, 4.0 μM C, and 2.0 μM B. Ten-microliter samples of this mixture were placed in 0.6-mL Eppendorf tubes and dried in a Speed-Vac. These sample tubes, each containing 40 pmol each of peptides C and C* and 20 pmol of peptide B, were stored at –20°C until mailing to study participants.
Sample Distribution
The ESRG announced the 2006 study by e-mail via the ABRF discussion board, as well as on the main ABRF Web page under “Open Research Studies” and on the ESRG Web page. A total of 34 requests for samples were received. Each person requesting samples received duplicate tubes containing the peptide mixture via regular mail.
Sample Analysis
Preliminary Edman degradation analysis by members of the ESRG showed that the sample contained peptides with the expected sequences in approximately the expected amounts. Data from the ESRG are included in the summary of quantitative results from sequencing this sample.
An amino acid analysis was performed on this peptide mixture by a member of the ESRG to confirm that its amino acid composition corresponded quantitatively to the amounts of the peptides that were added. For this measurement, 100 μL of the dried sample was dissolved in 20% acetonitrile containing 0.1% TFA and transferred to a hydrolysis tube. This sample was taken to dryness and subjected to vapor-phase acid hydrolysis—6 N HCl containing 1% (v/v) phenol—at 150°C for 90 min. The resulting amino acids were separated over an ion-exchange HPLC column and subjected to post-column ninhydrin derivatization using a Hitachi L-8800 amino acid analyzer. Amino acids in 0.1 mol/L hydrochloric acid (NIST Standard Reference Material 2389) were used to calibrate each amino acid peak area and to show chromatographic reproducibility. Bovine serum albumin (7% solution) (NIST Standard Reference Material 927c) control was used to verify that a proper hydrolysis had occurred. An internal standard, norvaline (Sigma Cat. No. N7627), was added to account for injection-to-injection variability on the analyzer. This analysis showed an average recovery of 92.5% for the amino acids present in this mixture (Table 2).
TABLE 2.
Amino Acid Analysis of the Peptide Mixture Used for the ESRG06 Study
| Amino Acid | Yield (nmol) | Corrected for 85/100 μL Injection | Peptide B Comp | Peptide B Expected nmol Yield | Peptide C Comp | Peptide C Expected nmol Yield | Total Expected nmol Yield | % Recovery |
|---|---|---|---|---|---|---|---|---|
| Asx | 0.3197 | 0.3761 | 2 | 0.4 | 0 | 0 | 0.4 | 94.02% |
| Thr | 0.1598 | 0.1880 | 1 | 0.2 | 0 | 0 | 0.2 | 94.00% |
| Ser | 0.8064 | 0.9488 | 1 | 0.2 | 1 | 0.8 | 1 | 94.88% |
| Glx | 1.1864 | 1.3958 | 4 | 0.8 | 1 | 0.8 | 1.6 | 87.24% |
| Pro | 0.0980 | 0.1153 | 1 | 0.2 | 0 | 0 | 0.2 | 57.65% |
| Gly | 0.8926 | 1.0502 | 1 | 0.2 | 1 | 0.8 | 1 | 105.02% |
| Ala | 1.1725 | 1.3794 | 4 | 0.8 | 1 | 0.8 | 1.6 | 86.21% |
| Cys | 0.0000 | 0 | 0 | 0 | 0 | 0 | 0 | - |
| Val | 0.7115 | 0.8371 | 1 | 0.2 | 1 | 0.8 | 1 | 83.71% |
| Met | 0.0000 | 0 | 0 | 0 | 0 | 0 | 0 | - |
| Ile | 0.1545 | 0.1817 | 1 | 0.2 | 0 | 0 | 0.2 | 90.85% |
| Leu | 1.7220 | 2.0259 | 4 | 0.8 | 2 | 1.6 | 2.4 | 84.41% |
| Tyr | 0.8451 | 0.9943 | 2 | 0.4 | 1 | 0.8 | 1.2 | 82.86% |
| Phe | 0.0000 | 0 | 0 | 0 | 0 | 0 | 0 | - |
| Lys | 0.8644 | 1.0170 | 2 | 0.4 | 1 | 0.8 | 1.2 | 84.75% |
| His | 0.0154 | 0.0181 | 0 | 0 | 0 | 0 | 0 | - |
| Arg | 1.1850 | 1.3942 | 2 | 0.4 | 2 | 1.6 | 2 | 69.71% |
| Trp | N.D. | N .D. | 0 | 0 | 0 | 0 | 0 | - |
| NorVal | 1.9718 | 2.3198 | 92.79% | |||||
| Ave. | 85.79% | |||||||
| NorVal cor. | 92.46% |
This analysis was performed on 100 μL of the peptide mixture, expected to contain 400 pmol each of peptides C and C* and 200 pmol of peptide B. N.D., not detected.
Study participants were informed that the test sample consisted of a mixture of three peptides present in amounts between 10 pmol and 50 pmol each, and that two of the peptides were homologues, one of which contained at least one modified amino acid. Everyone was asked to dissolve the dried peptide mixture in 20 μL of 30 % (v/v) aqueous acetonitrile containing 0.1% TFA. Those with access to mass spectrometry equipment were asked to analyze a small portion of the sample in order to obtain the molecular masses of the component peptides and to report these masses as well as the areas for the peaks due to each peptide along with the sequence data.
Data Reporting
The sequencing data were reported electronically in an anonymously submitted Excel spreadsheet. The spreadsheet included cells for reporting the fraction of the sample sequenced, the amino acids observed on each cycle of sequencing, the retention time and peak area for each amino acid, as well as the peak areas, retention times, and picomolar amounts of a set of PTH-AA standards. Three separate areas were included for arranging the amino acids in the three peptides in order according to the peptide sequences. Laboratories were asked to report known amino acids using the common three-letter amino acid code, to report “X” for unidentified modified amino acids, and to report “–” for no observed amino acid peaks for each cycle. They were asked to indicate their confidence level in the call by placing parentheses around tentative calls. The spreadsheet also included entry slots for the mass spectrometry data, including masses and peak areas for the three peptides and information about the type of instrument and analysis mode.
In order to facilitate accurate quantitation, participants were encouraged to use freshly prepared standards of the best quality available for this analysis. They were also encouraged, but not required, to calculate and report the relative and absolute amounts of the peptides in the mixture. In order to ensure that quantitative determinations were done in a uniform manner, the relative and absolute amounts of the peptides were also calculated by the ESRG using the data provided.
Finally, an instrument and analytical conditions survey was included on the spreadsheet to determine how the participating laboratories conduct Edman degradation. Each laboratory was asked to provide information on their instruments, including HPLC gradient conditions, buffers and solvents, chemistry cycles, and other parameters that could affect the results of the study.
RESULTS AND DISCUSSION
Survey of Instrumentation
The sequencers and reagents used by participants in the 2006 study are summarized as follows. The instruments used by study participants were all manufactured by Applied Biosystems and consisted of 8 Procise HT sequencers and 10 of the cLC model. In nearly all cases, participants used sequencing reagents provided by the manufacturer. One participant prepared reagent S4 instead of purchasing it. Fifteen of the 18 participating facilities used pulsed liquid TFA cleavage, while 3 used gas-phase TFA cleavage, and 15 of the 18 participants also sequenced from glass fiber filters, while 3 loaded the sample onto a polyvinylidenedifluoride (PVDF) membrane.
Instrumentation used by members of the ESRG was generally similar. Although ESRG data are excluded from the part of the study dealing with sequencing accuracy, these data are included in the study on peptide quantitation. ESRG member facilities providing quantitative data used the following instruments (included in Table 4 below): 1. Porton 2090e, 2. ABI Procise 494HT, 3. ABI 494 HT, 4. ABI Procise cLC, and 5. ABI 494 HT.
TABLE 4A.
Picomolar Amounts of Amino Acids Calculated by the ESRG for the First 10 Sequencing Cycles of Peptides C+C*.
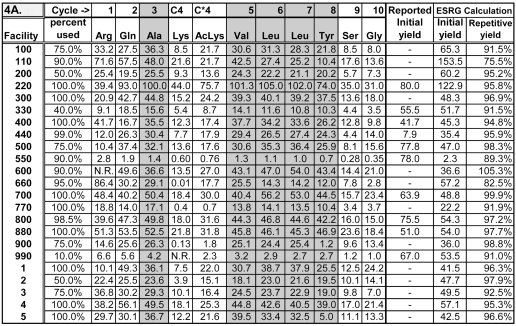 |
Initial yields in picomoles and repetitive yields calculated by the ESRG are given, as are initial yields reported by participants who calculated an initial yield. The initial yields in this table and in Table 4B for facility 550 calculated by the ESRG are low because that facility reported peak areas for the amino acid standards but was only able to provide peak heights for the amino acids found during sequencing.
Sequencing Accuracy
Sequences called by study participants are shown in Table 3. As shown here, most laboratories did very well in calling the sequences of the peptides in the mixture. Six of the 18 laboratories correctly identified all of the amino acid residues in all three peptides. Of those six, four used the Procise cLC sequencer and two the HT model. Positive amino acid assignments were 88% correct for peptides C and C*, and 93% correct for the longer peptide B, whereas tentative assignments were 67% and 44% correct for (C + C*) and for B, respectively (See Table 1 for comparison with previous studies).
TABLE 3.
Submitted Amino Acid Calls by Participating Facilities
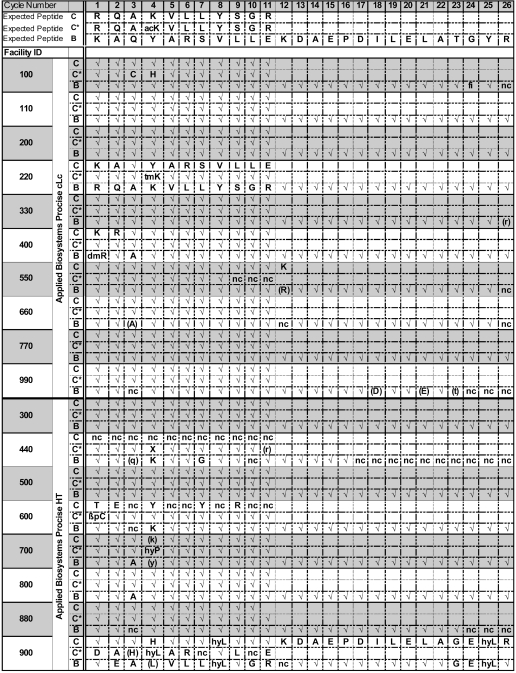 |
✓ Correct assignment. Lower case letter in parentheses: Tentative Correct assignment. Upper case letter: Positive Wrong assignment. Upper case letter in parentheses: Tentative Wrong assignment. X: Unidentified amino acid.
Abbreviations: acK: N-ɛ-Acetyl lysine. tmK: N-ɛ-Trimethyl lysine. βpC: Cysteine-S-β-propionamide. hyP - Hydroxyproline; hyL: 5-Hydroxylysine; dmR: Dimethylarginine. nc: no call. fi: failed injection.
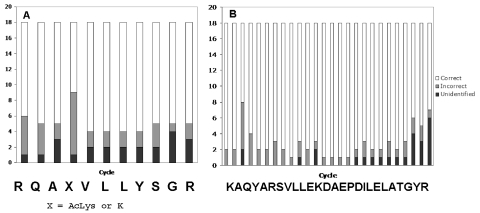
Figure 1 shows plots of sequencing accuracy as a function of amino acid residue in the two peptides. Besides the final residues (24 through 26) of peptide B, the residues presenting the most difficulty were residue 3 (Gln) of peptide B, where Gln lag from residue 2 of the fourfold more abundant peptides C + C* apparently led to uncertainty about the source of Gln on that cycle. The most common error for that cycle was to assign Ala as residue 3 in peptide B as well as in peptides C and C*. Although most participants correctly identified residue 4 of peptide C* as Lys(Ac), in several instances it was misidentified. Incorrect identifications included His, hydroxy-Lys, methylated Lys, and hydroxy-Pro. There were also several instances in which amino acids belonging to major peptides (C and C*) were assigned to the minor peptide (B).
FIGURE 1.
Sequencing accuracy as a function of residue number in the sequences of the peptides. A. The short peptide (C+C*). B. The long peptide (B).
Repetitive and Initial Yields
Tables 4A and 4B show the calculated picomolar amounts for the first 10 amino acids in the sequences of peptides C+C* and for the first 12 amino acids in peptide B, respectively. The ESRG calculated these picomolar amounts from data supplied by participating facilities using the formula
TABLE 4B.
Picomolar Amounts of Amino Acids Calculated by the ESRG for the First 12 Sequencing Cycles of Peptide B
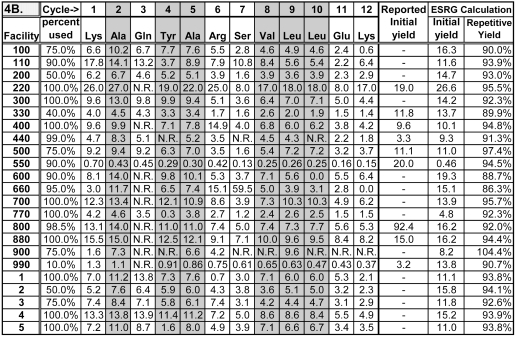 |
Initial yields in picomoles and repetitive yields calculated by the ESRG are also given, as are initial yields reported by participants who calculated an initial yield. N.R.: Peak areas need to calculate picomolar amounts were not reported.
Thus picomolar quantities were obtained by dividing reported peak areas from the appropriate cycles by the peak area per pmol of the corresponding amino acid standard.
Because only one facility (No. 110) actually ran a PTH standard for Lys(Ac), an approximate value for the picomolar quantity of this residue for the other facilities was calculated by assuming that its peak area/pmol was 1.11 times the average area/pmol for Ala and Tyr. This assumption is based on the fact that the observed Lys(Ac) peak area was found to average 1.11 times the area whose log lay on the trendline of a plot of log area vs. sequencing cycle using logs of regularly spaced Ala and Tyr residues in the ESRG 2004 study.16 Although different sequencers in that study gave different ratios between the Lys(Ac) peak area and the observed area on the sequencing cycle where that residue occurred, the factor of 1.11 was the average for both HT and cLC sequencers from ABI. Lys(Ac) values obtained in this way are included in Table 4A.
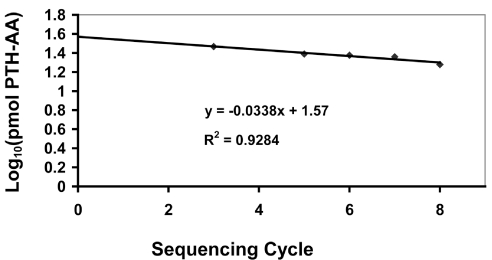
Initial and repetitive yields were determined using the Excel trendline function to plot logs of the picomolar amounts of Ala, Val, Leu, and Tyr (residues 3, 5, 6, 7, and 8 in peptides C+C*, and residues 2, 4, 5, 8, 9, and 10 in peptide B (cells containing these values are shaded in Table 4), as a function of the sequencing cycle. These residues were selected as being likely to give stable PTH derivatives with well-resolved peaks during analysis by HPLC. The anti-log of the y-intercept of the log plot is the initial yield, and thus the picomolar amount theoretically present in the sample loaded. This corresponds to the yield from sequencing cycle 0, and eliminates declines in yield due to lag and other repetitive losses.18 The antilog of the slope of the log plot is the repetitive yield. Figure 2 shows an example of how these values were calculated.
FIGURE 2.
Excel trendline plot of sequencing data used to determine initial and repetitive yields during sequencing. The data points used for this plot were from ESRG facility 3 for picomolar amounts of residues in peptides C + C*. The equation on the plot is for the straight line that best fits the data points. R2, the coefficient of determination, is a measure of the fraction of the variability of the data points that is accounted for by the equation for the trendline, the remainder of the variability usually being due to random error. A value of 1 indicates a perfect fit. The y intercept in the equation (1.57 in this example) corresponds to the log of the initial yield in picomoles, while the slope (–0.0338) corresponds to the log of the repetitive yield. Thus, the initial yield for sequencing in this example was 37.2 pmol, and the repetitive yield was 0.925, or 92.5%.
Values for the initial and repetitive yields calculated as described above are included in Table 4. Initial yields can differ substantially from the calculated picomolar amounts of the first amino acids (Lys and Arg) in the sequences of the peptides. In most cases, yields of Arg on cycle 1 were lower than the calculated initial yield for peptides C+C*, indicating a low recovery for that amino acid during sequencing. The Lys residue observed from cycle 1 of peptide B varied considerably between participating laboratories. Low yields indicate poor recovery of this amino acid, while high yields indicate that the Lys standard has deteriorated, resulting in an anomalously low peak area for the standard. Problems due to poor recovery or instability of the PTH AAs can be controlled by calculating initial yields based on slopes of trendlines determined from a set of PTH amino acids from the peptide that are considered likely to exhibit consistent recoveries.
Most of the repetitive yield values were in the range between 90% and 98%, which is reasonable for contemporary sequencers performing automated Edman degradation. A few values lay outside this range. In one instance (Facility 110) a low repetitive yield (76%) was primarily due to an anomalously high peak area for the Tyr standard (residue 8), resulting in a low yield for Tyr relative to other amino acids in the sequence. Leaving out this residue in the calculations (for facility 110) changes the initial and repetitive yields to more reasonable values of 92.5 pmol and 84%, respectively. This shows the potentially large effect of an error in the calculated amount of one amino acid when several different amino acids are used for repetitive and initial yield calculations.
One way to avoid problems of this sort is to base repetitive yields on a single type of amino acid that occurs repeatedly throughout the sequence. This procedure has been used in several previous ESRG studies, e.g., refs. 16, 17) and was also used in the careful analysis of repetitive yields by Smithies et al.18 It also is commonly used to check sequencer performance with β-lactoglobulin, which has well-spaced pairs of Leu, Ile, and Val residues, as a standard. We could not use this procedure in the study partially because we chose to use the well-characterized peptide standards prepared by the ABRF Peptide Standards Research Group and because we wanted our results to apply to actual samples that might not contain a regularly recurring amino acid residue. As a result, this study represents a fairly severe test of the accuracy of Edman degradation in obtaining absolute and relative concentrations of polypeptides in a mixture.
Absolute Amounts of the Peptides in the Mixture
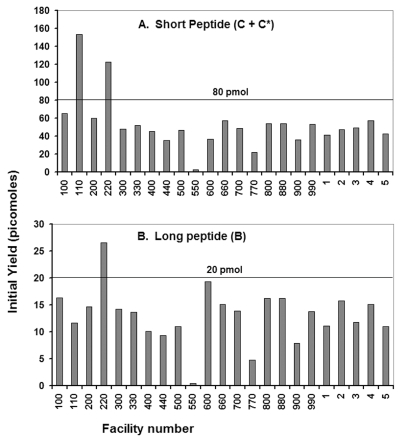
Absolute amounts of peptides C+C* and B in the samples provided were calculated by dividing the initial yields by the fraction of the peptide loaded, and are also shown in Tables 4A and 4B. Figure 3 shows the picomolar amounts of each of the peptides determined from the data of participating facilities in graphic form. As shown in the figure, the absolute picomolar amounts of the peptides determined from data provided by the participating facilities were, on average, about two-thirds of the actual amounts supplied in the samples, and, with a few outliers, the absolute amounts determined tended to cluster fairly closely around the average values. Taking into account the results from an amino acid analysis of the peptide mixture (Table 2) indicating that the recoverable amount of the peptides in the mixture may have been only 92.5 % of the expected amount, improves the absolute sequencing yield from about 66.3% (the average between the 67.0% yield for peptides C+C* and 65.6% for peptide B) to 66.3/92.5, or 71%. This suggests a loss of about 30% for reasons such as sample washout, partial inaccessibility of the N-terminal residue to sequencing reagents, or incomplete extraction and transfer of the cleaved amino acid to the conversion flask. Examining the data used to calculate the initial yields did not reveal any correlation with either the fraction of the sample loaded into the sequencer or the R2 value of the plot used to determine repetitive and initial yields.
FIGURE 3.
Initial yields from sequencing the sample peptides. The average initial yield from sequencing peptides C + C* was 53.6 picomoles, which is 67.0% of 80 picomoles, the expected amount for the total of these two peptides. Similarly, the average initial yield for sequencing peptide B was 13.1 picomoles, which is 65.6% of the 20 picomoles of this peptide in the sample.
Study participants were invited, but not required, to estimate the amounts of the peptides present in their samples based on their Edman sequencing data, and their results are also included in Table 4. Several facilities obtained very good quantitative results. For example, facilities 220 and 550 provided estimates of 80 and 78 pmol for peptides C + C* and 19 and 20 pmol for peptide B, respectively. These values are remarkably close to the actual amounts of 80 and 20 pmol in the sample. Participants were not asked to describe how they determined the amounts of the peptides in the mixtures. We suspect that they used the data analysis software provided with their sequencers to calculate the initial yields and thus absolute quantities of the peptides in the sample. These examples are an additional illustration of the utility of Edman sequencing for quantitative analysis of polypeptides.
There is no direct way to calculate the picomolar amounts of the individual peptides C and C* from initial yields because these peptides differed only at position 4. However, picomolar amounts of the individual peptides can be obtained by determining the ratio between unmodified Lys and Lys(Ac) on sequencing cycle 4. Picomoles of Lys(Ac) were calculated as described above by assuming that its peak area/pmol was 1.11 times the average area/pmol for Ala and Tyr. Picomolar amounts of Lys on cycles 1, 4, and 12 were calculated from the Lys area/pmol obtained from the data on standards supplied by each facility.
The phenylthiohydantoin derivative of Lys (PTH-Lys) is known to be less stable than other PTH amino acids, particularly in the presence of peroxide impurities in the sequencing reagents or chromatography solvents.19 Possibly because of this, the pmol amounts of Lys reported for peptide B on cycles 1 and 12 were frequently below the trendline values for cycles 1 and 12 on the log plot used to determine initial and repetitive yields for peptide B. The log of the trendline amount (in pmol) of an amino acid on sequencing cycle x can be calculated from the following equation
where AAx is the amino acid released on sequencing cycle x, I.Y. is the initial yield in picomoles, and R.Y. is the repetitive yield. (See Figure 2 for an illustration of how initial and repetitive yields are calculated from the sequencing data.) Therefore, a Lys correction factor for each facility was calculated by averaging the numbers by which the Lys 1 and Lys 12 amounts in peptide B needed to be multiplied to give values whose logs lay on the trendline. The picomolar amount of Lys 4 was multiplied by this correction factor, and the picomolar amount of Lys(Ac) was then divided by the corrected Lys 4 value to obtain a corrected peptide C*/C value. Table 5 shows the picomolar amounts of Lys at position 4 in the sequence of the peptide mixture, as well as the peptide C*/C ratio, calculated both from the peak area of Lys on cycle 4 relative to the Lys standard (C4 Lys obs) and from the corrected value obtained after multiplying by the correction factor as described above (C4 Lys corr). As shown in the table, use of the correction factor seems to be justified in that standard deviation of the values for the C*/C ratio decreased from 2.59 to 0.56. Applying this correction factor caused the average C*/C ratio to decrease from 2.37 to 1.49, which is somewhat greater than the expected ratio of 1.0.
TABLE 5.
Calculated Relative Amounts of Peptides C and C*
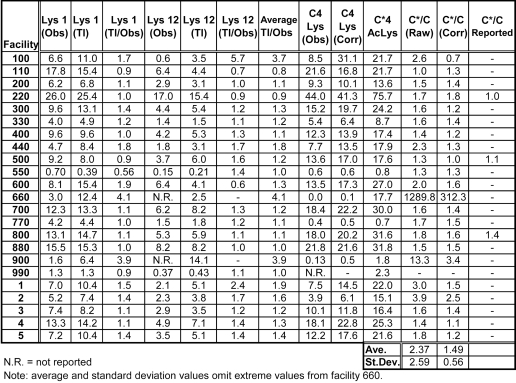 |
Lys Obs (observed) values were calculated from the Lys peak areas on cycles 1, 4, and 12 relative to the Lys standard reported by each facility. Lys Tl (trendline) values refer to expected picomolar amounts of Lys calculated from the trendline equation for peptide B on cycles 1 and 12. Lys (Tl/Obs) is the trendline value divided by the observed value. The average of the Lys 1 and Lys 12 (Tl/Obs) values (Average Tl/Obs) for each facility was used as a correction factor by which Lys (Obs) on cycle 4 (C4 Lys Obs) was multiplied to give a corrected value for the picomolar amount of Lys from peptide C on cycle 4 (C4 Lys Corr). Picomolar amounts of N-ɛ-Acetyl Lys (AcLys) for peptide C* were calculated as described in the text. C*/C Raw refers to the (AcLys)/(C4 Lys Obs) ratio, while C*/C Corr is the (AcLys)/(C4 Lys Corr) ratio.
Once the peptide C*/C ratio has been determined, the absolute amount of peptide C can be calculated by adding 1 to this ratio and dividing the total pmol amount of peptides C+C* by this sum:
The absolute picomolar amount of peptide C* is then simply the amount of peptide C times the C*/C ratio.
Relative Yields
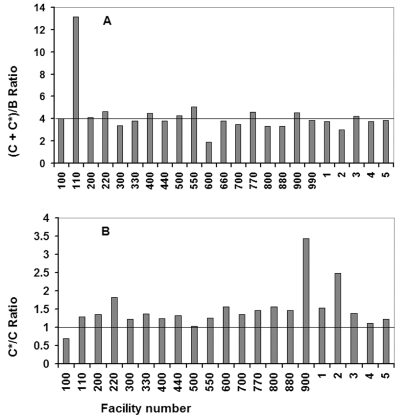
Relative yields of peptides (C+C*)/B were calculated from the initial yield data shown in Table 5 and are summarized graphically in Figure 4A. As shown here, the average peptide (C+C*)/B ratio found experimentally was 4.27, which corresponds to an average difference of only 6.8% from the expected ratio of 4.0. Twenty of the 23 laboratories analyzing the sample obtained ratios between 3.0 and 5.0. This result indicates that Edman sequencing is a reliable method for determining ratios among peptides in a mixture. Comparing Figures 3 and 4 reveals that there is less scatter in the relative yield than in the initial yield data. Thus factors causing errors in initial yield determinations tended to affect the component peptides of the mixture similarly, so that there was a smaller effect on relative than absolute yields.
FIGURE 4.
Relative peptide amounts. A. The ratio of peptides (C+C*) to peptide B is the ratio of the initial yields (Tables 4A and 4B). The horizontal line indicates the expected ratio of 4.0. The average ratio from all of the participating laboratory data was 4.27. B. The ratio of peptide C* to peptide C calculated from the picomolar amounts of Lys and acetylated Lys on sequencing cycle 4 (Table 5). The horizontal line indicates the expected ratio of 1.0. Data from Facility 660 have been omitted, and Facility 990 did not provide sufficient data to calculate a C*/C ratio. The average value for the other 21 facilities was 1.49, and data from 16 of the 21 facilities yielded ratios between 0.5 and 1.5.
For comparison, the peptide C*/C ratio (from Table 5) is illustrated graphically in Figure 4B. This type of comparison is relevant to situations in which heterogeneous samples are analyzed, and one wishes to know the extent of a particular isoform or post-translational modification of a peptide. In this case, average error is nearly 50%. However, in this case the ratio is based only on the amounts of acetylated and unmodified lysine residues at position 4 in the sequence, rather than on initial yields determined from several residues. This factor, as well as the fact that the area per picomole for the Lys(Ac) residue was based on an average value calculated from a previous ESRG study rather than from a precisely quantified PTH-Lys(Ac) standard, may account for the larger error. Nevertheless, calculations based on the data from 16 of the 21 participating laboratories yielded C*/C ratios between 0.5 and 1.5.
Three of the participating facilities (220, 500, and 800), reported relative amounts of peptides C and C*, and their reported values are also included in Table 5. Generally, their reported values are in good agreement with those calculated by the ESRG. Facility 220 reported a value of 80 picomoles for peptides C* and C combined and a C*/C ratio of 1, thus implying that each was present at the expected value of 40 picomoles. However, this result must be regarded as somewhat fortuitous, since that facility identified residue 4 in C* as trimethyl Lys, instead of Lys(Ac).
Mass Spectrometry Data on the Peptide Mixture
Participants with access to mass spectrometry equipment were encouraged to report masses and peak areas obtained for the peptides using this technique. Fifteen of the 18 facilities participating in this study were able to obtain masses for the three peptides used in this study. As shown in Table 6, most of those 15 participants obtained correct masses for the three peptides. Reported masses for peptides C and C* ranged from 1289.70 to 1291.57 and 1331.40 to 1333.55, respectively, while masses for peptide B ranged from 2946.01 to 2955.86, with one outlier at 3107.30. Most of the differences between reported mass values are undoubtedly due to differences in whether the reported value was that of the uncharged peptide or the protonated peptide ion, or of the monoisotopic or average mass. The more extreme values given for peptide B imply imprecise calibration, or, in the case of the 3107.30-Da outlier, either an adduct that was specific for that peptide (C and C* masses reported by the same facility were correct) or an impurity introduced in sample handling.
TABLE 6.
Mass Spectrometry Data for the Test Peptides
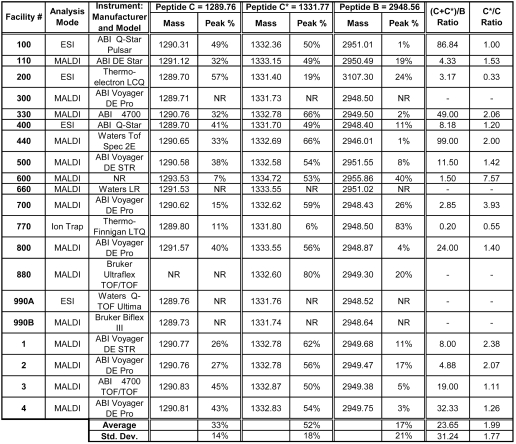 |
Masses were obtained for the peptides by 21 facilities and 16 facilities also reported peak areas. Peak areas are given as a percent of the total peak area for all three peptides. Peptide ratios calculated from the relative peak areas for the different peak areas varied widely, and were not a reliable indicator of the relative amounts of the peptides. Std Dev: Standard deviation.
As shown in Table 6, relative peak areas for the peptides varied widely in the mass spectrometry measurements. Only 10 of the 15 facilities that reported masses for the peptides in the mixture also reported areas for the peaks produced by these peptides in their mass spectra. Also included in the table are mass spectrometry data from 4 members of the ESRG. It is apparent from these data that raw peak areas in these mass spectrometry measurements do not accurately reflect the 2:2:1 ratio for peptide C to C* to B in the mixture. The general trend in the peak area data was for the peptide C* peak to be larger than that of peptide C, although they were present in the mixture in equal amounts, and for the peak area for peptide B to be smaller than its amount relative to the two forms of peptide C. Given that peptide C* has one fewer protonatable basic amino acid, due to the acetylation of the Lys epsilon amino group, it is somewhat surprising that it generally gave a stronger signal in the mass spectrometry measurements.
Several of the participants providing mass spectrometry data may have reported only the areas of the monoisotopic peaks, while others reported the total area for the entire envelope of isotopic peaks for each peptide. Participants were not asked to specify whether the reported areas were those of all of the peaks or only of the monoisotopic peak. This can make a significant difference. Calculations show that for peptide C, the smallest peptide in the mixture, the monoisotopic peak accounts for 47.5% of the total peak area, while for peptide B, the monoisotopic peak accounts for only 18.3%. The effect of this difference in reporting peak areas is illustrated by the MALDI-TOF data from the ESRG member labs, where two group members (facilities 1 and 2) reported the total area of all of the isotopic peaks for each peptide while two others (facilities 3 and 4) reported only monoisotopic peak areas. In the former case, the area due to peptide B accounted for 14±3% of the total peptide peak area, while in the latter case, peptide B accounted for only 4±1% of the total area.
The raw peak areas from mass spectrometry show less correlation with the relative amounts of these peptides than do the Edman sequencing data. Mass spectrometry is capable of yielding reasonably accurate quantitative data on polypeptides in a mixture, but only when the response of the mass spectrometer to that peptide is relative to an internal standard of known concentration.20,21 An inherent advantage of Edman sequencing for polypeptide quantitation is that quantitation is based on the uniform response of the online HPLC system (UV absorbance) to the individual PTH amino acids.
CONCLUSIONS
The participants in the 2006 study successfully sequenced a mixture of three peptides of which two were homologues differing at only one position. Most participants (13 out of 18) correctly identified the modified amino acid, Lys(Ac), present in one of the two homologous peptides.
The absolute picomolar amounts determined were lower than expected by about 30%. This implies losses due to reaction inefficiencies or side reactions in the sequencer reaction cartridge that specifically affected the first sequencing cycle, and thus the initial yield, and/or due to inefficiencies during transfer of the ATZ–amino acid derivatives to the conversion flask. Because repetitive yields were typically in the 90 to 98% range, these losses cannot be attributed to generally low yields for the overall coupling and cleavage reactions. However, it may be possible that coupling and cleavage steps on the first cycle could be affected by sample impurities that do not affect subsequent cycles, as the sample becomes cleaner due to washing and extraction steps as sequencing progresses. Other factors that could specifically lower the yield on the first cycle might include adsorption of the peptide on the support in such a way that a fraction of the peptide becomes permanently inaccessible to the sequencing reagents, or poor binding of a portion of the peptide to the support, resulting in washout. In an earlier study on repetitive and initial yields of proteins adsorbed on three different types of sample supports, Lavin et al.22 found that initial yields were different on different types of supports, and speculated that the differences were due to differing degrees of sample washout. A consistent failure to transfer 100% of the cleaved ATZ–amino acid to the conversion flask, either because some of the cleaved amino acid remains adsorbed on the support after this transfer, or because some of it cleaves prematurely during coupling and is lost in washing steps prior to transfer to the conversion flask, would also contribute to these losses. Without further experimental data, it is not possible to assess the contributions of these factors, and possibly others not yet considered, to the lower than expected initial yield.
The relative amounts of peptides in the mixture, determined from their initial yields, were highly accurate, the average error being 6.8%. Determining the relative amounts of Lys and Lys(Ac) in the two homologous peptides proved more difficult, differing from the expected value by about 50%. This larger error is attributed mainly to the fact that a synthetic PTH standard for Lys(Ac) was not available to the participants. Analysis of the peptide mixture by mass spectrometry yielded accurate masses for the different components of the mixture; however, the relative peak areas from the peptides in the mass spectra did not accurately reflect the relative amounts of the peptides in the mixture.
ACKNOWLEDGMENTS
We thank Henriette Remmer and the Peptide Standards Research Group for donating the NIST Peptide Set for Biomolecular Measurements, SRM2397, from which two of the peptides used in our study were obtained. We also thank Renee Schrauben for removing identifiers from data supplied by the responding laboratories. Finally, we thank all the participating laboratories for taking the time to analyze the test sample and send in their results.
REFERENCES
- 1.Niece RL, Williams KR, Wadsworth CL, Elliott J, Stone KL, McMurray WJ, et al. A. Synthetic peptide for evaluating protein sequencer and amino acid analyzer performance in core facilities: Design and results. In: Hugli TE, editor. Techniques in Protein Chemistry. Academic Press; San Diego: 1989. pp. 89–101. [Google Scholar]
- 2.Speicher DW, Grant GA, Niece RL, Blacher RW, Fowler AV, Williams KR. Design, characterization and results of ABRF-89SEQ: A test sample for evaluating protein sequencer performance in protein microchemistry core facilities. In: Hugli TE, editor. Current Research in Protein Chemistry. Academic Press; San Diego: 1990. pp. 159–166. [Google Scholar]
- 3.Yuksel KU, Grant GA, Mende-Muller LM, Niece RL, Williams KR, Speicher DW. Protein sequencing from polyvinylidene difluoride membranes: Design and characterization of a test sample (ABRF-90SEQ) and evaluation of results. In: Villafranca JJ, editor. Techniques in Protein Chemistry II. Academic Press; San Diego: 1991. pp. 151–162. [Google Scholar]
- 4.Crimmins DL, Grant GA, Mende-Muller LM, Niece RL, Slaughter C, Speicher DW, et al. Evaluation of protein sequencing core facilities: Design, characterization, and results from a test sample (ABRF-91SEQ) In: Angeletti RH, editor. Techniques in Protein Chemistry III. Academic Press; San Diego: 1992. pp. 35–35. [Google Scholar]
- 5.Mische SM, Yuksel KU, Mende-Muller LM, Matsudaira P, Crimmins DL, Andrews PC. Protein sequencing of post-translationally modified peptides and proteins: Design, characterization and results of ABRF-92SEQ. In: Angeletti RH, editor. Techniques in Protein Chemistry IV. Academic Press; San Diego: 1993. pp. 453–461. [Google Scholar]
- 6.Rush J, Andrews PC, Crimmins DL, Gambee JE, Grant GA, Mische SM, et al. A synthetic peptide for evaluating protein sequencing capabilities: Design of ABRF-93SEQ and results. In: Crabb JW, editor. Techniques in Protein Chemistry V. Academic Press; San Diego: 1994. pp. 133–141. [Google Scholar]
- 7.Gambee JE, Andrews PC, Grant GA, Merrill B, Mische SM, Rush J. Assignment of cysteine and tryptophan residues during protein sequencing: Results of ABRF-94SEQ. In: Crabb JW, editor. Techniques in Protein Chemistry VI. Academic Press; San Diego: 1995. pp. 209–217. [Google Scholar]
- 8.DeJongh KS, Fernandez J, Gambee JE, Grant GA, Merrill B, Stone KL, et al. Design and analysis of ABRF-95SEQ, a recombinant protein with sequence heterogeneity. In: Marshak D, editor. Techniques in Protein Chemistry VII. Academic Press; San Diego: 1996. pp. 347–358. [Google Scholar]
- 9.Fernandez J, Admon A, DeJongh K, Grant G, Henzel W, Lane WS, et al. Evaluation of ABRF-96SEQ: A sequence assignment exercise. In: Marshak DR, editor. Techniques in Protein Chemistry VIII. Academic Press; San Diego: 1997. pp. 69–78. [Google Scholar]
- 10.Stone K, Fernandez J, Admon A, Henzel W, Lane W, Rohde M, et al. ABRF-97SEQ: Sequencing results of a low-level sample. J Biomol Tech. 1999;10:26–32. [Google Scholar]
- 11.Carr S, Crabb J, Davis G, De Jongh K, Dupont D, Lee T, et al. ABRF-99SEQ: Analysis of a peptide and protein. Presented at ABRF ’99: Bioinformatics and Biomolecular Technologies: Linking Genomes, Proteomes, and Biochemistry; Durham, NC. March 1999. [Google Scholar]
- 12.Henzel W, Admon A, Carr S, Davis G, De Jongh K, Lane W, et al. ABRF-98SEQ: Evaluation of peptide sequencing at high sensitivity. J Biomol Tech. 2000;11:92–99. [PMC free article] [PubMed] [Google Scholar]
- 13.Carr J, Crabb J, Davis G, Dunbar B, Dupont D, Lee T, et al. ABRF-00SEQ: Sequence analysis of a post-translationally modified peptide. Presented at ABRF ’00: From Singular to Global Analysis of Biological Systems, Bellevue; Washington. February 2000. [Google Scholar]
- 14.Buckel SD, Cook RG, Crawford JM, Denslow N, Fernandez J, Madden BJ, et al. ABRF-2002ESRG, a difficult sequence: Analysis of a PVDF-bound known protein with a heterogenous amino-terminus. J Biomol Tech. 2002;13:246–257. [PMC free article] [PubMed] [Google Scholar]
- 15.Buckel SB, Cook RG, Crawford JM, Denslow N, Fernandez J, Madden BJ, et al. ABRF-ESRG’03: Analysis of a PVDF-bound known protein with a homogeneous amino-terminus. J Biomol Tech. 2003;14:278–288. [PMC free article] [PubMed] [Google Scholar]
- 16.Brune D, Crawford JM, Cook RG, Denslow ND, Kobayashi R, Madden BJ, et al. ABRF ESRG 2004 Study: Modified amino acids in Edman sequencing. J Biomol Tech. 2005;16:272–284. [Google Scholar]
- 17.Brune D, Denslow ND, Kobayashi R, Lane WS, Leone JW, Madden BJ, et al. ABRF ESRG 2005 Study: Identification of seven modified amino acids by Edman Sequencing. J Biomol Tech. 2006;17:308–326. [PMC free article] [PubMed] [Google Scholar]
- 18.Smithies O, Gibson D, Fanning EM, Goodfliesh RM, Gilman JG, Ballantyne DL. Quantitative procedures for use with the Edman-Begg sequenator. Partial sequences of two unusual immunoglobulin light chains, Rzf and Sac. Biochem. 1971;10:4912–4921. doi: 10.1021/bi00802a013. [DOI] [PubMed] [Google Scholar]
- 19.Brown K. Peroxides in sequencing solvents: Effects on PTH-amino acids and how to detect them. ABRF News. 1995;6(2):13–15. [Google Scholar]
- 20.Nelson RW, McLean MA, Hutchens TW. Quantitative determination of proteins by matrix-assisted laser desorption/ionization time-of-flight mass spectrometry. Anal Chem. 1994;66:1408–1415. [Google Scholar]
- 21.Jespersen S, Niessen WMA, Tjaden UR, van der Greef J. Quantitative bioanalysis using matrix-assisted laser desorption/ionization mass spectrometry. J Mass Spectrom. 1995;30:357–64. [Google Scholar]
- 22.Lavin AE, Merewether LA, Clogston CL, Rohde MF. Comparison of the high sensitivity and standard versions of Applied Biosystems 494 N-terminal protein sequencers using various sequencing supports. In: Marshak DR, editor. Techniques in Protein Chemistry VIII. Academic Press; San Diego: 1997. pp. 57–67. [Google Scholar]


