

Abstract
Voice-onset time (VOT) provides an important auditory cue for recognizing spoken consonant-vowel syllables. Although changes in the neuromagnetic response to consonant-vowel syllables with different VOT have been examined, such experiments have only manipulated VOT with respect to voicing. We utilized the characteristics of a previously developed asymmetric VOT continuum (Liederman et al., 2005) to determine if changes in the prominent M100 neuromagnetic response were linearly modulated by VOT. Eight right-handed English-speaking, normally developing participants performed a VOT discrimination task during a whole-head neuromagnetic recording. The M100 was identified in the gradiometers overlying the right and left temporal cortices and single dipoles were fit to each M100 waveform. A repeated measures analysis of variance with post-hoc contrast test for linear trend was used to determine whether characteristics of the M100 were linearly modulated by VOT. The morphology of the M100 gradiometer waveform and the peak latency of the dipole waveform were linearly modulated by VOT. This modulation was much greater in the left, as compared to the right, hemisphere. The M100 dipole moved in a linear fashion as VOT increased in both hemispheres, but along different axes in each hemisphere. This study suggests that VOT may linearly modulate characteristics of the M100, predominately in the left hemisphere, and suggests that the VOT of consonant-vowel syllables, instead of, or in addition to, voicing, should be examined in future experiments.
Keywords: Magnetoencephalography, M100, Voice-Onset Time, Consonant-Vowel Syllable, Laterality
INTRODUCTION
The brain decodes speech with a high degree of accuracy despite wide variation in the acoustic characteristics of speech between speakers. Speech is decoded by extracting phonological features from the auditory signal. Magnetoencephalography (MEG) is an ideal non-invasive neuroimaging tool for studying the brain’s neurophysiological response to speech. MEG: (1) provides a quiet environment, (2) is sensitive to the neuronal structures involved in speech decoding, (3) provides superior spatial resolution as compared to EEG, and (4) provides superior temporal resolution as compared to functional MRI (Hari and Lounasmaa, 1989).
The M100 is a robust neuromagnetic auditory evoked response that is most likely produced by several overlapping tangentially oriented neural generators within the superior temporal plane (Halgren et al., 1995; Lütkenhöner, 2003; Näätänen & Picton, 1987). The contribution of individual neurophysiological components of the M100 waveform is likely complex, since speech stimuli produce sustained and varied activation of multiple intracranial neural generators, including generators in the medial and lateral portions of Heschl’s gyrus, the planum temporale and Brodmann’s area (BA) 22 (Liegeois-Chauvel, de Graaf, Laguitton, & Chauvel, 1999). Phonological features of speech modulate the M100 (Roberts, Flagg & Gage, 2004; Roberts & Poeppel, 1996). For example, phonological features of vowels influence the peak latency of the M100 waveform and the spatial location of the M100 dipole source (Diesch, Eulitz, Hampson & Ross, 1996; Obleser, Lahiri & Eulitz, 2004; Shestakova, et al. 2004).
Phonological features of the consonant vowel (CV) syllable have also been shown to influence the neuromagnetic response (Ackermann, Lutzenberger & Hertrich, 1999; Simos et al., 1998), but, unfortunately, the stimuli used in these studies only allowed the phonological feature of voicing to be examined. Since voicing is defined by the feature of voice onset time (VOT), the design of these studies make it impossible to know whether changes in the neuromagnetic response are due to differences in VOT or voicing. The difference between VOT and voicing is an important distinction because the perception of subtle differences in the CV syllable feature of VOT has implications for several clinical populations, such as children with language-based learning disabilities (Breier 2001; Mody, Studdert-Kennedy & Brady, 1997).
VOT is defined as the interval between the release-burst of the initial stop consonant and the onset of voicing of the vowel (see Figure 1B). VOT is relatively short for the voiced /ba/ (i.e., 5ms) as compared to the unvoiced /pa/ (i.e., 50ms; See Figure 1B). In general, the consonant in a syllable with a relatively short VOT is perceived as voiced (e.g., /b/, /d/, /g/) while the consonant in a syllable with a relatively long VOT is perceived as unvoiced or voiceless (e.g., /p/, /t/, /k/).
Figure 1.

The consonant-vowel (CV) syllable continuum used in this study. (A) The continuum was designed to be asymmetric so that there were sufficient /pa/ stimuli (8) to test within-category discrimination and enough other non-/pa/ stimuli to test between-category discrimination. Syllables with shorter voice-onset times (VOTs; i.e., between 0ms and 10ms) are almost invariably perceived as a /ba/ while syllable stimuli with longer VOTs (25ms–50ms) are perceived as a /pa/. Stimuli with VOTs between the two phonemic categories (i.e., VOTs of 15 and 20 ms) represent a boundary region that is ambiguous. In Liederman et al (2005), 51 participants categorized all of the VOT stimuli in this continuum before and after a VOT discrimination task. The line graphs represent the percentage of trials that each VOT stimulus was categorized as sounding like the syllable /pa/. These categorization curves demonstrated the clear categorical perception of the stimuli. The bar graph depicts the percentage of time sequentially presented identical stimuli were correctly identified as matching during the discrimination task. Note that two successive short /pa/ stimuli were incorrectly judged to be different more often than two successive long /pa/ stimuli. This and other differences in the perceptual characteristics of these sectors support the notion that they are distinct. (B) The auditory waveforms corresponding to the two VOT stimuli. The onset of the auditory waveform is depicted by the vertical 0ms line. This also represents with start of the consonant burst. The next vertical line to the right depicts the onset of the voicing of the vowel (i.e., the VOT). (C) Spectrograms depicting the frequency decomposition of the syllable stimuli. The first three formants are labeled. Note that both the /ba/ and /pa/ syllables are composed of the same frequencies.
In our earlier work (Liederman, et al. 2005), we demonstrated, by means of a discrimination paradigm, that the same listeners who uniformly categorized six stimuli as /pa/ could hear differences between the three /pa/ stimuli with the shortest VOT from the three /pa/ stimuli with the longest VOT. As can be seen in Figure 1A, this permitted us to define 4 specific sectors of the VOT continuum (i.e., /ba/, boundary between /ba/ and /pa/, short /pa/ and long /pa/). These stimuli enabled us to separate the influence of two CV syllable features on the neuromagnetic response: voicing and VOT.
Our goal was to examine how the neuromagnetic response is modulated by VOT per se, regardless of voicing. The M100 may indeed be the appropriate neuromagnetic waveform to examine when studying VOT since others have demonstrated that the M100 can reflect fine grained temporal changes in the auditory stimulus, especially when the temporal modulation of the stimulus is close to the onset of the stimulus, as it is in CV syllables (Gage, Roberts & Hickok, 2006). By including VOT stimuli in the boundary region between the voiced /ba/ and unvoiced /pa/ phonemic categories and two regions of the unvoiced /pa/ phonemic category with different mean VOTs, a VOT continuum was created with four sectors that were not defined by voicing. Using this approach, we assumed that the influence of VOT on the neuromagnetic response was linear. A similar assumption was made by Roberts, Flagg and Gage (2004) when examining phonological characteristics of speech. These researchers visually examined whether the first formant frequency of a vowel was linearly related to the M100 peak latency. We examined whether VOT was linearly related to characteristics of the M100, except we used a quantitative statistical rather than a qualitative visual approach.
The neuromagnetic response to CV syllables may also demonstrate hemispheric differences. Intracranial recordings suggest that CV syllable components are sequentially processed within the M100 time window in the left, but not the right, hemisphere (Liegeois-Chauvel, de Graaf, Laguitton & Chauvel, 1999). MEG studies suggest that the lateralization of the neuromagnetic response amplitude to CV syllable features is influenced by attention (Poeppel, et al. 1996), whether the stimulus is natural or synthetic (Hertich, Mathiak, Lutzenberger & Ackermann, 2002) and whether the stimulus is in the context of a language task (Shtyrov, Pihko & Pulvermuller, 2005). Others have not found any asymmetries in the modulation of the neuromagnetic response to CV syllable features (Papanicolaou, et al. 2003).
We hypothesize that the M100 response will be modulated by VOT differently in the right and left hemispheres. Intracranial recordings suggest that the cortical time-locked responses to the onset of both the consonant release burst and vowel voicing occur within the secondary auditory and auditory association areas only in the left hemisphere (Liegeois-Chauvel, de Graaf, Laguitton & Chauvel, 1999). Since these non-primary auditory areas are believed to be significant generators of the M100 (Godey, et al. 2001; Liegeois-Chauvel, et al. 1994) and the morphology of the M100 waveform is determined, in large part, by summation of non-primary auditory sources, we expect that M100 morphology will be modulated to a greater extent in the left hemisphere.
METHODS
Participants
This study was conducted in accordance with the Declaration of Helsinki and the Institutional Review Boards at the authors’ affiliated institutions. A total of ten right handed English speaking young adults [mean (SE) age = 23 (2.2)], half male, participated in the MEG recording session after informed consent. Participants were screened for a history of psychiatric, neurologic, learning and hearing difficulties. Participants had no contraindications for MEG or MRI. These participants were paid $20/hour and were provided free parking.
Data from two female participants were discarded due to an unacceptably low signal to noise ratio. The majority of the participants (6 of 8) underwent extensive prestudy testing. Such participants’ demonstrated reading rate and comprehension scores above the twenty fifth percentile for grade level on the Nelson-Denny reading test, and performed the auditory phonological categorization and discrimination task described below. Non-verbal intelligence quotient, as estimated using the Block Design subtest from the Wechsler Adult Intelligence Scale III Edition, was average or above. The data from the two participants who did not undergo prestudy testing were not systematically different than that of the other six participants.
Behavioral Task
Stimuli
An eleven step /ba/ to /pa/ VOT continuum was adapted from a continuum developed by Tom Carrell that is available at the University of Nebraska Speech Perception Laboratory Resource (http://hush.unl.edu/LabResources.html). The synthesized speech represented a male voice. The first three formant frequencies were 660, 1100, and 2500 Hz in the steady state of the vowel with a transition of approximately 30ms (See Figure 1C). Stimuli were 170ms in duration. The voicing difference between the bilabial stop consonants used in this study represent a meaningful contrast in English. VOT was measured from the end of the 5ms burst of the consonant to the beginning of a full pitch pulse of the vowel. The first token in the continuum had a VOT of 0 ms; and each successive step represented a 5ms VOT increment. Categorization of this continuum has been reported previously. Liederman, Frye, McGraw Fisher, Greenwood and Alexander (2005) demonstrated that the tokens perceived as /pa/ could be divided into two distinct /pa/ phoneme sectors on the basis of discrimination data. For the purposes of this experiment we will simply refer to these two sectors as short /pa/ (VOT 25ms, 30ms, 35ms) and long /pa/ (40ms, 45ms, 50ms). Liederman, Frye, McGraw Fisher, Greenwood and Alexander (2005) validated within-category sectors by demonstrating that the accuracy of recognizing two identical CV syllables as the same was significantly lower for the short as opposed to the long /pa/ sectors, and performance on a discrimination task depended on whether the first token, of the two to be discriminated, was derived from the short or long /pa/ sector. Further experiments demonstrated that performance on a discrimination task depended on whether the first token in the two tokens to be discriminated was derived from short /pa/ or long /pa/ sectors (Liederman, et al. 2005). However, this context effect does not influence the current experiment since we are only examining the neuromagnetic response to the first, not the second, auditory stimulus. Additional studies conducted by Dr. Liederman suggest that the long /pa/ sector yields significantly better goodness ratings than the short /pa/ sector.
Discrimination Task
Each participant performed a discri mination task during MEG recording. The task required fine same-different judgments between tokens with very close VOTs. This difficult task ensured that the participant was closely attending to the auditory stimuli and engaging neural circuitry essential for processing the VOT feature. Each trial began with the presentation of two consecutive tokens separated by a 10ms interstimulus interval. Tokens were identical on half of the trials. The participant responded by lifting the right index or middle finger to indicate whether or not the two consecutive tokens matched, respectively. The next trial was presented three seconds after the participant’s response. All tokens and combinations of tokens were presented an equal number of times in a balanced fashion.
MEG Recording Procedure
Auditory Stimulus Presentation System
Presentation™ version 0.53 (Neurobehavioral Systems, Albany, CA) presented 8-bit monaural 22kHz wav files containing the auditory stimuli. The auditory stimuli were produced by ER30 (Etymotics Research, Inc) earphones placed behind the neuromagnetometer seat, outside of the neuromagnetometer helmet, and transmitted to ER13 Horn Foam eartips (Etymotics Research, Inc) through hollow tubes. The frequency response of this system was flat within the normal speech range and the magnetic field artifact from the ER30 earphones was insignificant. The auditory signal was amplified to 70dB which the participants indicated as comfortable. Empirical testing demonstrated that the auditory stimulus began after the electronic trigger with an average delay of 22ms and a jitter of 8ms. All latency values have been corrected for this delay.
Neuromagnetometer
All recordings were conducted at the Massachusetts General Hospital Martinos Center for Biomedical Imaging. A VectorView™ whole-head system (Elekta Neuromag Oy, Finland) measured the neuromagnetic field from 306 sensors at 102 locations distributed over the dewar helmet. Each location contained an orthogonal pair of planar gradiometers and a magnetometer SQUID. The neuromagnetometer was located inside a high performance magnetically-shielded room (MSR) consisting of three nested main layers, each composed of a pure aluminum layer plus a high permeability ferromagnetic layer. The passive shielding factor of this enclosure has been measured at 3,600 (71dB), 240,000 (107dB) and 78,000,000 (158dB) at frequencies of 0.1Hz, 1.0Hz and 10Hz, respectively (Cohen, et al. 2002). The SQUID recording system was tuned every morning and the Helium was replaced in the dewar every week. Data were recorded at sampling rate of 601 Hz with a corresponding bandpass of 0.1Hz to 172Hz.
Participant Preparation
The participant was dressed in a non-metallic hospital gown. Electrooculography (EOG) electrodes and head position coils were placed on the participant as described previously (Halgren et al., 2002). Positions of the coils, fiducial points and 50 to 100 points outlining the participant’s scalp were recorded using a Polhemus FastTrack 3-D digitizer (Colchester, VT; Hämäläinen, et al. 1993) to facilitate later MRI-MEG alignment.
Once prepared the participant was seated in the neuromagnetometer chair, the ER13 ear tips were placed in the ears and the head was advanced into the dewar by slowly lifting the chair upwards using a pneumatic system until the vertex touched the top of dewar helmet. An optical response pad was secured to the chair’s table using plastic micropore tape. Sample stimuli were played through the audio system to assure that the participant could comfortably hear the stimuli.
Recording Procedure
All MEG channels were continuously reviewed for possible artifact. A channel containing artifact was first heated or tuned, but if artifact persisted, the channel was flagged to be excluded from data analysis. Typically, one or two channels were flagged for each participant. The participant was asked not to move the head and to blink only immediately after a response. To facilitate head stability, the participant was asked to fixate on a spot on the wall of the magnetically shielded room, such as a screw that held in the metal panel. Both audio and video monitoring ensured participant compliance. The testing session was divided into eight 10 minute blocks. Each block contained approximately 180 trials and was separated from the next by three minutes. Before the start of each block, the participant’s head position with respect to the scanner was determined by measuring a low-intensity radio frequency signal emitted from the four head position coils. The raw MEG data were saved to a central RAID mass storage device after each block. All participants tolerated the experimental procedure without discomfort or significant movement.
Magnetic Resonance Imaging
In order to provide anatomic localization for dipole fitting, high-resolution three-dimensional T1-weighted MPRAGE structural brain MRIs were acquired for each participant after the MEG recording session on a Siemens Sonata 1.5T scanner.
Data Analysis
Data Sorting and Averaging
The MEG signal was extracted from the 14 gradiometer pairs located over the posterior superior temporal areas in the left and right hemispheres. Data from 200ms before, to 180ms after, the onset of the stimulus was extracted for analysis. This allowed for an examination of neural activity in response to the first stimulus only and did not include any neuromagnetic response to the second stimuli. Epochs containing eye blinking (i.e., EOG amplitudes exceeding 150 μV) or high gradiometer signals (i.e., greater than 3000 fT/cm) were removed prior to bandpass filtering between 0.1 and 30Hz. Trials were sorted with respect to the VOT sector of the first auditory stimulus. Although the total number of trials for each VOT sector differed slightly, after the elimination of trials containing eye-blinks and other artifacts, the waveforms for each VOT sector were averaged from not less than 180 trials. The averaged waveform for each of the four VOT sectors was corrected for the baseline and linear trend.
Quantitative M100 Waveform Analysis
Several auditory neuromagnetic responses have been described in the literature, including the M50 and M100 (Ackermann, Hertrich, Mathiak & Lutzenberger, 2001; Eggermont and Ponton 2002). The M100 has received the most attention and probably represents activation of primary and secondary auditory and auditory association areas involved in language decoding (Eggermont and Ponton 2002; Godey, et al. 2001; Liegeois-Chauvel, et al. 1994). There is no specific criterion for determining when the M100 waveform begins, but by definition, it must start sometime after the M50. Thus, in order to examine the morphology of the entire M100 waveform, the gradiometer field containing the M100 was statistically analyzed starting near the M50 (i.e., 45ms) to the onset of the second stimulus (i.e., 180ms). The M100 was found for each hemisphere by selecting the gradiometer with the maximum absolute field amplitude during the 80ms to 180ms time window using custom MATLAB™ (The MathWorks, Inc, Natick, MA) scripts that utilized the EEGLAB abspeak function (Delorme and Makeig, 2004). The peak-finding algorithm was restricted to the 80ms to 180ms interval to ensure that a M50 waveform peak was not selected.
Many studies examine the amplitude and latency of the M100 waveform peak across experimental conditions. However, this does not provide an analysis of changes in the shape of this complex waveform. Since the M100 waveform is a summation of several, possibly equally prominent, temporally overlapping neural sources, we analyzed the waveform within fine temporal windows using a previously described analysis strategy (Phillips et al. 2000). The M100 gradiometer waveform was decimated to 200Hz and the data points were quantitatively analyzed using the statistical analysis described below.
Equivalent Current Dipole (ECD) Modeling
ECDs were fit to each participant’s average gradiometer waveforms for each VOT sector. The rationale for ECD modeling has been extensively described (Hämäläinen et al. 1993). Single ECD modeling was performed with XFIT™ (Elekta Neuromag Oy, Finland) software with a three stage procedure. During each stage, the optimal location, orientation and strength of the ECD was found using least-squares fit in a spherical volume conductor. The center of the sphere was defined by the local center of the curvature of the brain surface in the occipital–parietal area, as determined by individual MRIs. The ECD location was given in millimeters along coronal, sagittal and axial planes as an anterior, lateral and superior position relative to the center of the spherical volume conductor.
The first stage of the ECD fitting procedure produced an estimate of the orientation and position of the M100 using the waveform peak. First, the largest M100 within the 14 temporal area gradiometer pairs was found. Then an ECD was fit to the M100 waveform peak using the gradiometer pair containing the largest M100 waveform and the eight adjacent gradiometer pairs in order to limit the contribution of extratemporal sources. The second stage produced a more robust estimate of the ECD position and orientation by refitting the ECD to a greater portion of the M100 waveform. The ECD fitting procedure used a temporal window extending from 30ms before to 30ms after the M100 waveform peak. The third stage estimated the ECD waveform amplitude from the baseline (−200ms to 0ms) through the stimulus presentation period (0ms to 180ms) while fixing the ECD position and orientation as estimated in the first two stages. All waveforms provided a peak goodness of fit greater than 80%. The latency and amplitude of the ECD waveform peak was automatically determined using customized MATLAB™ (The MathWorks, Inc, Natick, MA) EEGLAB functions (Delorme and Makeig, 2004) within the 80ms to 180ms time window.
Statistical Analysis Methods
A repeated measures analysis of variance (ANOVA; SPSS™ Release 11.0.1, SPSS Inc., Chicago, IL) identified whether the variation in the dependent variable was specifically related to VOT (4 levels) and hemisphere (2 levels) in all analyses and latency (28 levels) in the waveform analysis. Post-hoc test for linear trend along the VOT variable was conducted if the VOT effect was significant in the ANOVA. Figures representing the M100 and ECD waveforms are presented as grand averages across participants. Although some have argued that grand averages of MEG waveforms across participants may be problematic since the magnetic field represents a very local response and demonstrates interindividual variability due to differences in head position (Alho, et al. 1998), in the current study we selected M100 waveforms from specific gradiometers located in the optimal head location for recording the M100 field. In this manner, variation in head position was taken into account. Individual and grand average waveforms were compared to ensure that the grand average waveforms accurately represented individual cases.
RESULTS
M100 Waveform Analysis
Figures 2A and 2B depict the M100 waveform for each VOT sector averaged across participants for the left and right hemispheres, respectively. Main Effects: The amplitude of the M100 waveform was compared across hemisphere, VOT and latency. The overall M100 waveform amplitude was not significantly different in the left and right hemispheres [Hemisphere Main Effect F(1,7) = 0.005, p = 0.9461], but was dependent on VOT [VOT Main Effect F(3,21) = 3.760, p = 0.026; Mean (SEM): /ba/ 22.41 fT/cm (1.77); boundary 17.22 fT/cm (1.83); short /pa/ 15.69 fT/cm (1.69); long /pa/ 14.48 fT/cm (1.65)] and latency [F(27,189) = 8.588, p < 0.001]. Main ANOVA Interactions: The influence of VOT on the mean M100 waveform amplitude was different in the left and right hemispheres [VOT by Hemisphere Interaction F(3,21) = 6.930, p = 0.002], changed with latency [VOT by Latency Interaction F(81,567) = 5.215, p < 0.001] and changed with latency differently in the left and right hemispheres [VOT by Hemisphere by Latency Interaction F(81,567) = 2.463 p < 0.001]. In addition, mean M100 waveform amplitude changed across latency differently in the left and right hemispheres [Hemisphere by Latency Interaction F(27,189) = 1.610, p = 0.036]. VOT Linearly Modulates Overall M100 Amplitude in the Left, but not Right Hemisphere: Separate ANOVAs were conducted to investigate the relationship between VOT and M100 waveform amplitude in each hemisphere. As can be seen in Figure 2C and 2D, VOT significantly modulated the M100 waveform amplitude in the left, but not the right, hemisphere [Left ANOVA: VOT Main Effect F(3,21) = 5.954, p = 0.004; Right ANOVA: VOT Main Effect F(3,21) = 1.495, p = 0.245]. In the left hemisphere, overall M100 amplitude linearly decreased as VOT increased [Left ANOVA: VOT Linear Trend F(1,7) = 8.154, p = 0.024]. VOT has a Linear Influence on M100 Waveform Morphology in the Left, but not the Right Hemisphere: In both the right and left hemispheres, the M100 waveform amplitude changes with latency and this change is influenced by VOT [Left ANOVA: Latency Main Effect F(27,189) = 7.50, p < 0.001; Latency by VOT Interaction F(81,567) = 7.097, p < 0.001; Right ANOVA: Latency Main Effect F(27,189) = 5.357, p < 0.001; Latency by VOT Interaction F(81,567) = 1.727, p < 0.001]. In order to determine the specific influence of VOT at various M100 waveform latencies, separate ANOVAs were calculated for the each M100 waveform latency in the left and right hemispheres separately. VOT significantly influenced (p < 0.05) M100 waveform amplitude from latencies 45ms to 135ms and 160ms to 180ms in the left hemisphere and latencies of 65ms to 70ms in the right hemisphere. This influence was linear from latencies 45ms to 135ms in the left hemisphere, but only for latency 70ms in the right hemisphere (See Figure 2A and 2B).
Figure 2.
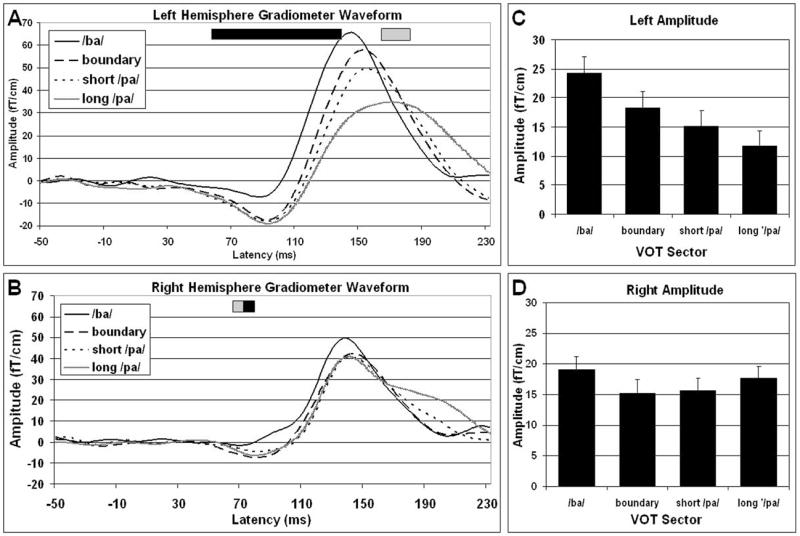
M100 waveforms for four the VOT sectors recorded from the left (A) and right (B) temporal areas averaged across participants. In the left hemisphere, as VOT increased, the rate of rise of the M100 waveform becomes progressively slower and the peak is decreased in amplitude and increased in latency. Unlike the left hemisphere, the latency and amplitude of the right hemisphere waveforms are equivalent regardless of VOT. Significant differences between amplitude of the waveforms across the four VOT sectors for particular latencies are depicted by the bar at the top of each figure. The dark bar indicates that the waveform amplitude significantly (p < 0.05) increases in a linear fashion as the VOT value increases, whereas the gray bar indicated that a significant difference in amplitude exists across VOT sectors but that this difference is not significantly linearly related to the VOT value. The average amplitude of the M100 waveform is modulated by VOT in the left (C), but not the right (D), hemisphere.
Equivalent Current Dipoles
Figures 3A and 3B depict ECD waveforms averaged across participants for the left and right hemispheres, respectively. Laterality differences in the characteristics of these ECD waveforms are apparent. Indeed, the morphology of the right hemisphere ECD waveforms is similar regardless of the VOT, whereas the latency of the left hemisphere ECD waveforms appears to be modulated by VOT. ECD Waveform Peak Amplitude is Not Influenced by VOT or Hemisphere: The peak amplitude of the ECD waveform was not significantly influenced by VOT, hemisphere or the interactions of these variables [VOT Main Effect F(3,21) = 1.383, p = 0.276; Hemisphere Main Effect F(1,7) = 0.482, p = 0.510; VOT by Hemisphere Interaction F(3,21) = 0.330, p = 0.804]. ECD Waveform Peak Latency is Influenced by Both VOT and Hemisphere: Latency of the ECD waveform peak significantly increased as VOT increased [VOT Main Effect F(3,21) = 6.374, p < 0.01; Linear Trend F(1,7) = 8.177, p = 0.024]. The average peak latency of the ECD waveform appeared earlier in the right hemisphere than in the left hemisphere [Hemisphere Main Effect: F(1,7) = 6.040, p = 0.044; Mean (SD): Right = 133.9ms (2.98), Left = 144.6ms (3.41)]. However, the influence of VOT on latency was different in the two hemispheres [VOT by Hemisphere Interaction F(3,21) = 3.522, p = 0.033]. Thus, the relationship between VOT and latency was investigated for each hemisphere individually. ECD Waveform Peak Latency Increases as VOT increases in the Left, but not Right, Hemisphere: The ECD waveform peak latency increased as VOT increased in the left Hemisphere [Left ANOVA: VOT Main Effect F(3,21) = 6.251, p = 0.003; VOT Linear Trend F(1,7) = 7.940, p = 0.026; see Figure 3C], but was not related to VOT in the right hemisphere [Right ANOVA: VOT Main Effect F(3,21) = 2.511, p = 0.086; see Figure 3D]. The Sagittal and Coronal Positions of the Left Hemisphere ECD and the Axial Position of the Right Hemisphere ECD are Linearly Related to VOT: The sagittal, coronal and axial position of the left hemisphere M100 ECD were significantly influenced by VOT [Sagittal ANOVA: VOT Main Effect F(3,21) = 3.361, p = 0.038; Coronal ANOVA: VOT Main Effect F(3,21) = 21.418, p < 0.001; Axial ANOVA: VOT Main Effect F(3,21) = 4.528, p = 0.013], but only the sagittal and coronal positions of the left hemisphere M100 ECD changed in a linear fashion with VOT [Sagittal ANOVA: VOT Linear Trend F(1,7) = 23.442, p = 0.002; Coronal ANOVA: VOT Linear Trend F(1,7) = 32.929, p = 0.001; Axial ANOVA: VOT Linear Trend F(1,7) = 1.703, p = 0.233]. As can be seen in Figure 4A, in general, the left hemisphere M100 ECD moved medial and anterior as VOT increased across the clearly recognized syllable stimuli. However, the ECD evoked by stimuli with boundary VOT values appears to be positioned near the ECD for stimuli with long /pa/ VOT values. The Axial Position of the Right Hemisphere ECD Position may be Linearly Related to VOT: The sagittal, coronal and axial position of the right hemisphere M100 ECD were significantly influenced by VOT [Sagittal ANOVA: VOT Main Effect F(3,21) = 4.170, p = 0.018; Coronal ANOVA: VOT Main Effect F(3,21) = 4.749, p = 0.011; Axial ANOVA: VOT Main Effect: F(3,21) = 8.218, p = 0.001], but only the axial position of the right hemisphere M100 ECD changed in a linear fashion with VOT [Sagittal ANOVA: VOT Linear Trend F(1,7) = 0.354, p = 0.571; Coronal ANOVA: VOT Linear Trend F(1,7) = 4.387, p = 0.074; Axial ANOVA: VOT Linear Trend F(1,7) = 10.498, p = 0.014]. However, as can be seen in Figure 4B, like the relationship between the ECD position and VOT in left hemisphere of the ECD, the ECD evoked by stimuli with boundary VOT values appears to be positioned near the ECD for stimuli with long /pa/ VOT values.
Figure 3.
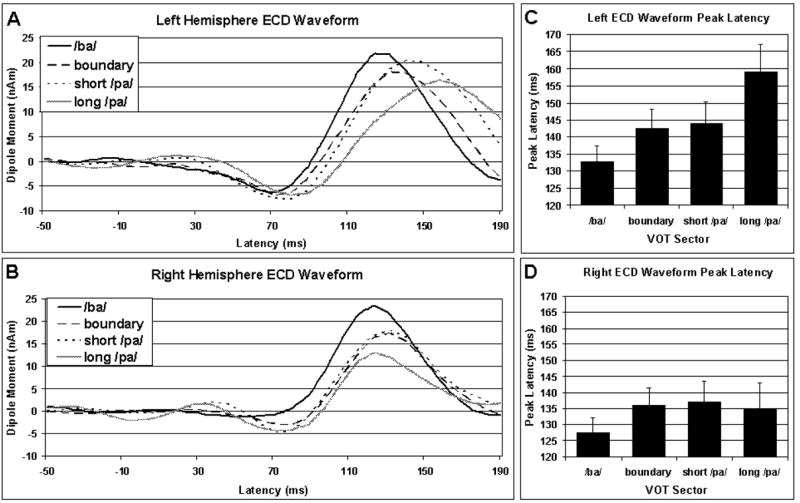
The waveforms derived from the equivalent current dipole (ECD) model averaged across participants for each VOT continuum sector for the left (A) and right (B) hemispheres. Waveform peak latency is dependent on VOT in the left (C) but not the right (D) hemisphere.
Figure 4.
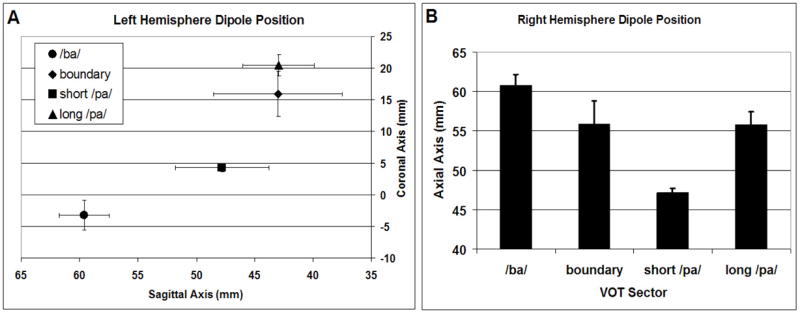
Changes in equivalent current dipole (ECD) position with changes in VOT sector. (A) The sagittal and coronal positions of the ECD appear to be related to VOT such that the dipole moves medial and anterior has VOT increases. (B) The ECD in the right hemisphere appears to move inferior as VOT increases.
DISCUSSION
This study suggests that VOT modulates neural mechanisms in the auditory analysis stream, primarily in the secondary auditory and auditory association areas in the left hemisphere. Moreover, our results indicate that consonant-vowel syllables may be coded differently in the hemispheres, with the left hemisphere coding the VOT feature of the CV syllable by means of a temporal code. In the current study we examined changes in M100 waveform morphology and the M100 ECD peak amplitude and latency as VOT was manipulated using a unique approach. Previous studies that have examined the influence of VOT on the neuromagnetic response have only used auditory stimuli correlated with voicing. The current study was able to examine VOT independent of voicing using a four sector VOT continuum. In addition to the voiced and unvoiced sectors, this VOT continuum contained (1) a region with ambiguous stimuli that were not specifically perceived as a voiced or unvoiced syllable and (2) an extended VOT range for the unvoiced syllable. By using four linearly increasing VOT continuum sectors, we identified characteristics of the auditory response within the M100 time window that were linearly modulated by VOT.
Along with studies that have focused on phonological features of vowels (Obleser, Lahiri & Eulitz, 2004), tone frequency (Roberts and Poeppel, 1996), attention (Hertich, Mathiak, Lutzenberger & Ackermann, 2002) and overt speaking (Numminen, Salmelin & Hari 1999), this study suggests that the sources that generate the M100 are influenced by features of CV syllables. The results of the current study suggest that sources in the left and right hemispheres are modulated by different features of CV syllables. Our findings are consistent with previous studies. For example, vowels have been shown to differentially modulate the M100 waveform in the left and right hemispheres (Diesch, Eulitz, Hampson & Ross, 1996) and the magnetic mismatch field to changes in stop-consonant voicing has also been shown to be lateralized to the left hemisphere (Ackermann, Lutzenberger & Hertrich, 1999). However, some MEG studies have reported bilateral symmetric M100 responses with manipulation of voicing (Ackermann, Lutzenberger & Hertrich, 1999; Papanicolaou, et al. 2003; Simos, et al. 1998). Other factors may account for the discrepancy. Indeed, lateralization of the neuromagnetic response may vary with the characteristics of the stimuli or task (Hertich, Mathiak, Lutzenberger & Ackermann, 2002; Shtyrov, Pihko & Pulvermuller, 2005). In the current study, participants were engaged in a task that required discrimination of very subtle differences in speech features, thereby theoretically engaging the neural systems involved in discrimination of subtle speech features. Behavioral studies using this same continuum demonstrated that performance was near, but not at, chance for participants during within-category discrimination trials in particular (Liederman, et al. 2005). The specific effect this may have had on the current findings is not known, but it is possible that such a difficult task significantly engaged the speech decoding systems in both hemispheres.
Of greatest interest is the finding that the CV syllable feature of VOT linearly modulated several characteristics of the M100 waveform and ECD in the left hemisphere. These effects are consistent with the results from intracranial recordings in humans. For example, responses time-locked to the onset of both the consonant release burst and vowel voicing have been reported in the right (Steinschneider, et al. 2005) and left (Liegeois-Chauvel, de Graaf, Laguitton & Chauvel, 1999) hemispheres. However, these responses occur before the M100 time window and appear to be isolated to the primary auditory area in the right hemisphere. Indeed, responses time-locked to the onset of both the consonant release burst and vowel voicing have only been reported in secondary auditory and auditory association areas, such as the planum temporale, in the left hemisphere (Liegeois-Chauvel, de Graaf, Laguitton & Chauvel, 1999). The fact that non-primary auditory areas may be significant generators of the M100 could explain the hemispheric asymmetry of the M100.
Time-locking of the M100 cortical generator(s) to vowel voicing in the left, but not the right, hemisphere could explain the changes seen in both the M100 and ECD waveform. First, such time-locking would result in a later M100 peak, as detected in the ECD waveform. Second, this time-locking would also result in less temporal summation at the neural level with fewer simultaneously active sources for stimuli with longer VOTs (i.e., long /pa/), thereby explaining the changes seen in the morphology of the M100 waveform with longer VOTs, including its slower rise, lower peak magnetic field amplitude and prolonged decay.
A recent functional MRI study suggests hemispheric difference in the timescale of the auditory stimuli that optimally activate the left and right superior temporal gyri (STG). The left STG appears to optimally process repeated auditory stimuli of 25ms to 50ms duration, whereas the right STG appears to optimally process auditory stimuli with a duration between 200ms and 300ms (Boemio, Fromm, Braun & Poeppel, 2005). The stimuli in the present study were almost 200ms in duration and contained an initial consonant segment that varied from 0ms to 50ms in duration. Thus, our stimuli contained timescales that could potentially activate both the right and left temporal areas. This could explain the differences in the right and left hemisphere’s cortical responses demonstrated in this study and in intracranial recordings (Liegeois-Chauvel, de Graaf, Laguitton & Chauvel, 1999). For example, if the left hemisphere analyzes very short auditory segments, it could automatically analyze both the consonant and the vowel, thereby resulting in two distinct time-locked responses in the non-primary auditory areas. This would result in an M100 with characteristics that are dependent on VOT (as explained above) and responses time-locked to both the consonant and vowel. Furthermore, a lower limit on the minimal length of the auditory segment required to evoke analysis mechanisms could explain the fact that, at least in monkeys (Steinschneider, Schroeder, Arezzo & Vaughan, 1995), only one time-locked response is detected for voiced stop-consonants (i.e., stimuli with very short VOTs) in the left hemisphere.
In this study a linear topographic code for VOT appeared to be organized along the sagittal and coronal planes in the left hemisphere and axial plane in the right hemisphere. Topographic coding of place of articulation for vowels and stop-consonants and VOT for CV syllables has been shown to occur along the coronal and sagittal axis, respectively (Obleser, Lahiri & Eulitz, 2003; Obleser, Lahiri & Eulitz, 2004; Simos et al., 1998). Both of these axes have been identified in the left hemisphere for our CV syllable stimuli. Like Simos, Diehl, Breier, Molis, Zouridakis and Papanicolaou (1998), the voiceless CV syllables (i.e., the long and short /pa/) were positioned more medial than the voiced CV syllables (i.e., the /ba/). However, unlike Simos, Diehl, Breier, Molis, Zouridakis and Papanicolaou (1998) we used an extended range of VOTs in our voiceless CV syllable, thereby demonstrating a gradient between the short and long /pa/ (voiceless) syllable.
The relationship between VOT and the topographical position of the ECD in both the right and left hemispheres demonstrated a statistically linear relationship along specific axes. However, the mean position of the ECDs for the stimuli with boundary VOT values was between stimuli with short and long /pa/ VOT values rather than between the /ba/ and short /pa/ VOT stimuli, as would be expected. The reason for this is not clear but it may be related to the ambiguity of the boundary stimuli as a syllable. Indeed, our previous study demonstrated that the unambiguous long /pa/ stimulus can influence the perception of ambiguous stimuli such that, when the unambiguous long /pa/ stimuli is heard within 250ms previous to an ambiguous stimuli, the ambiguous stimuli may sometimes be perceived as the unambiguous long /pa/ stimuli rather than the ambiguous stimuli itself (Liederman et al., 2005). This is believed to be due to the development of resonance between auditory perceptual regions. Thus, although the stimuli studied in this paper were the first of the two stimuli heard on each trial and, thus, not directly preceded by a stimulus, the residual effect of adaptive resonance networks activated by unambiguous long /pa/ stimuli on previous trials may have influenced the topographical coding of the ambiguous boundary stimulus.
Topographical coding of auditory stimuli purportedly identifies basic information-bearing elements, such as frequency, but not information-bearing parameters, such as temporal properties of the stimuli, including VOT (Eggermont, 2001). The basic information bearing elements of both the consonant and vowels are the same for all of the stimuli. However, the relative contribution of each of the average frequency components was different across the stimuli depending on the relative length of the consonant and vowel components. Topographic organization along the perisylvian coronal plane has been associated with one aspect of place of articulation for vowels (Obleser, Lahiri & Eulitz, 2003; Obleser, Lahiri & Eulitz, 2004). The fact that our stimuli had a fixed place of articulation but still modulated the dipole position along the coronal plane supports other observations that topographical coding is probably not directly related to a particular phonological feature but is most likely a complex function of interacting information-bearing elements (Shestakova et al., 2004; Eggermont, 2001). Functional MRI studies would suggest that the timescale of the entire stimulus, rather than its components, was optimal for activation of the right STG (Brancucci and San Martini 2003). This may suggest that some aspect of the entire auditory stimulus, such as the amplitude envelope (Liegeois-Chauvel et al., 2004), was integrated and topographically coded as a whole in the right hemisphere. Clearly more research is needed to identify the features of language stimuli which are topographically coded.
One thing that is clear when considering the results of this and other studies that examine the M100 auditory response; the M100 is a complex waveform that is generated by many sources distributed along the superior temporal plane and the contributions of individual sources remain to be better defined. Experiments that systematically manipulate specific dimensions of the speech signal, and use new data analysis techniques (e.g., independent component and time-frequency analysis) may help to identify the subcomponents that contribute to this waveform. This study suggests that VOT is an important parameter that should be modulated when studying how speech stimuli modulate the neuromagnetic response. This study demonstrates how an extended asymmetric VOT continuum can be used to differentiate modulation of the neuromagnetic response by VOT vs. voicing. Designing an experiment with enough trials to examine VOT on a finer level can help further define the relationship between VOT and the neuromagnetic response but will require extended recording sessions with excellent head stabilization using a device such as a bite bar. In addition, comparison of the neuromagnetic response of several VOT CV syllable continuums or comparison of the neuromagnetic response of a VOT CV syllable continuum to the response of a tone onset continuum could also provide important information.
This work may have implications for individuals with acquired and developmental language disorders, especially if the components generated from the planum temporale can be identified in future studies (Griffiths & Warren, 2002; Hickok & Poeppel, 2004). Indeed, individuals with such disorders manifest abnormal neuromagnetic and neuroelectrical evoked responses as well as abnormal functional and anatomical hemispheric asymmetry (Guttorm, et al. 2005; Heim, Eulitz & Elbert, 2003; Heim and Keil, 2004; Heim, Kissler, Elbert & Rockstroh, 2004; Leppanen and Lyytinen, 1997). Therefore, studying modulation of the M100 by speech parameters such as VOT in such individuals could reveal the extent to which each of these coding mechanisms are disrupted and may have implications for therapy.
Acknowledgments
The authors would like to thank Seppo Ahlfors, Polly Dhond, Deirdre Foxe, Matti Hämäläinen, Patrice Seyed and Thomas Witzel for their assistance. This project was supported by a Charles King Award from the Medical Foundation and K23 NS046565 to Dr. Richard Frye, F31 NS048778 to Ms. Janet McGraw Fisher, SPRiNG award from Boston University and NSF 0354378 to Dr. Jackie Liederman and NS18741 to Dr. Eric Halgren.
References
- Ackermann H, Hertrich I, Mathiak K, Lutzenberger W. Contralaterality of cortical auditory processing at the level of the M50/M100 complex and the mismatch field: a whole-head magnetoencephalography study. Neuroreport. 2001;12:1683–1687. doi: 10.1097/00001756-200106130-00033. [DOI] [PubMed] [Google Scholar]
- Ackermann H, Lutzenberger W, Hertrich I. Hemispheric lateralization of the neural encoding of temporal speech features: a whole-head magnetoencephalography study. Brain Research: Cognitive brain research. 1999;7:511–518. doi: 10.1016/s0926-6410(98)00054-8. [DOI] [PubMed] [Google Scholar]
- Alho K, Winkler I, Escera C, Huotilainen M, Virtanen J, Jaaskelainen IP, Pekkonen E, Ilmoniemi RJ. Processing of novel sounds and frequency changes in the human auditory cortex: magnetoencephalographic recordings. Psychophysiology. 1998;35:211–224. [PubMed] [Google Scholar]
- Boemio A, Fromm S, Braun A, Poeppel D. Hierarchical and asymmetric temporal sensitivity in human auditory cortices. Nature Neuroscience. 2005;8:389–395. doi: 10.1038/nn1409. [DOI] [PubMed] [Google Scholar]
- Brancucci A, San Martini P. Hemispheric asymmetries in the perception of rapid (timbral) and slow (nontimbral) amplitude fluctuations of complex tones. Neuropsychology. 2003;17:451–457. doi: 10.1037/0894-4105.17.3.451. [DOI] [PubMed] [Google Scholar]
- Breier J, Gray L, Fletcher JM, Diehl RL, Klaas P, Foorman BR, Molis MR. Perception of voice and tone onset time continua in children with dyslexia with and without attention deficit/hyperactivity disorder. Journal of Experimental Child Psychology. 2001;80:245–270. doi: 10.1006/jecp.2001.2630. [DOI] [PubMed] [Google Scholar]
- Cohen D, Schalpfer U, Ahlfors S, Hämäläinen M, Halgren E. New Six-Layer Magnetically Shielded Room for MEG. Biomag Proceedings 2002 [Google Scholar]
- Delorme A, Makeig S. EEGLAB: an open source toolbox for analysis of single-trial EEG dynamics including independent component analysis. Journal of Neuroscience Methods. 2004;134:9–21. doi: 10.1016/j.jneumeth.2003.10.009. [DOI] [PubMed] [Google Scholar]
- Diesch E, Eulitz C, Hampson S, Ross B. The neurotopography of vowels as mirrored by evoked magnetic field measurements. Brain and Language. 1996;53:143–168. doi: 10.1006/brln.1996.0042. [DOI] [PubMed] [Google Scholar]
- Eggermont JJ. Between sound and perception: reviewing the search for a neural code. Hearing Research. 2001;157:1–42. doi: 10.1016/s0378-5955(01)00259-3. [DOI] [PubMed] [Google Scholar]
- Eggermont JJ, Ponton CW. The neurophysiology of auditory perception: from single units to evoked potentials. Audiology and Neurootology. 2002;7:71–99. doi: 10.1159/000057656. [DOI] [PubMed] [Google Scholar]
- Gage N, Roberts TP, Hickok G. Temporal resolution properties of human auditory cortex: reflections in the neuromagnetic auditory evoked M100 component. Brain Research. 2006;1069:166–171. doi: 10.1016/j.brainres.2005.11.023. [DOI] [PubMed] [Google Scholar]
- Godey B, Schwartz D, de Graaf JB, Chauvel P, Liegeois-Chauvel C. Neuromagnetic source localization of auditory evoked fields and intracerebral evoked potentials: a comparison of data in the same patients. Clinical Neurophysiology. 2001;112:1850–1859. doi: 10.1016/s1388-2457(01)00636-8. [DOI] [PubMed] [Google Scholar]
- Griffiths TD, Warren JD. The planum temporale as a computational hub. Trends in Neuroscience. 2002;25:248–353. doi: 10.1016/s0166-2236(02)02191-4. [DOI] [PubMed] [Google Scholar]
- Guttorm TK, Leppanen PH, Poikkeus AM, Eklund KM, Lyytinen P, Lyytinen H. Brain event-related potentials (ERPs) measured at birth predict later language development in children with and without familial risk for dyslexia. Cortex. 2005;41:291–303. doi: 10.1016/s0010-9452(08)70267-3. [DOI] [PubMed] [Google Scholar]
- Halgren E, Baudena P, Clarke JM, Heit G, Liegeois C, Chauvel P, Musolino A. Intracerebral potentials to rare target and distractor auditory and visual stimuli. I. Superior temporal plane and parietal lobe. Electroencephalography and Clinical Neurophysiology. 1995;94:191–220. doi: 10.1016/0013-4694(94)00259-n. [DOI] [PubMed] [Google Scholar]
- Halgren E, Dhond RP, Christensen N, VanPetten C, Marinkovic K, Lewine JD, Dale AM. N400-like MEG responses modulated by semantic context, word frequency, and lexical class in sentences. NeuroImage. 2002;17:1101–1116. doi: 10.1006/nimg.2002.1268. [DOI] [PubMed] [Google Scholar]
- Hämäläinen MS, Hari R, Ilmoniemi RJ, Knuutila J, Lounasmaa OV. Magnetoencephalography - theory, instrumentation, and applications to noninvasive studies of the working human brain. Review of Modern Physics. 1993;65:413–497. [Google Scholar]
- Hari R, Lounasmaa OV. Recording and interpretation of cerebral magnetic fields. Science. 1989;244:432–436. doi: 10.1126/science.2655083. [DOI] [PubMed] [Google Scholar]
- Heim S, Eulitz C, Elbert T. Altered hemispheric asymmetry of auditory N100m in adults with developmental dyslexia. Neuroreport. 2003;14:501–504. doi: 10.1097/00001756-200303030-00041. [DOI] [PubMed] [Google Scholar]
- Heim S, Keil A. Large-scale neural correlates of developmental dyslexia. European Child and Adolescent Psychiatry. 2004;13:125–140. doi: 10.1007/s00787-004-0361-7. [DOI] [PubMed] [Google Scholar]
- Heim S, Kissler J, Elbert T, Rockstroh B. Cerebral lateralization in schizophrenia and dyslexia: neuromagnetic responses to auditory stimuli. Neuropsychologia. 2004;42:692–697. doi: 10.1016/j.neuropsychologia.2003.09.007. [DOI] [PubMed] [Google Scholar]
- Hertich I, Mathiak K, Lutzenberger W, Ackermann H. Hemispheric lateralization of the processing of consonant-vowel syllables (formant transitions): effects of stimulus characteristics and attention demands on the evoked magnetic fields. Neuropsychologia. 2002;40:1902–1917. doi: 10.1016/s0028-3932(02)00063-5. [DOI] [PubMed] [Google Scholar]
- Hickok G, Poeppel D. Dorsal and ventral streams: a framework for understanding aspects of the functional anatomy of language. Cognition. 2004;92:67–99. doi: 10.1016/j.cognition.2003.10.011. [DOI] [PubMed] [Google Scholar]
- Leppanen PH, Lyytinen H. Auditory event-related potentials in the study of developmental language-related disorders. Audiology and Neurootology. 1997;2:308–340. doi: 10.1159/000259254. [DOI] [PubMed] [Google Scholar]
- Liederman J, Frye RE, McGraw Fisher J, Greenwood K, Alexander R. A temporally dynamic contextual effect that disrupts voice onset time discrimination of rapidly sucssessive stimuli. Psychonomic Bulletin and Review. 2005;12:380–386. doi: 10.3758/bf03196388. [DOI] [PubMed] [Google Scholar]
- Liegeois-Chauvel C, de Graaf JB, Laguitton V, Chauvel P. Specialization of left auditory cortex for speech perception in man depends on temporal coding. Cerebral Cortex. 1999;9:484–496. doi: 10.1093/cercor/9.5.484. [DOI] [PubMed] [Google Scholar]
- Liegeois-Chauvel C, Lorenzi C, Trebuchon A, Regis J, Chauvel P. Temporal envelope processing in the human left and right auditory cortices. Cerebral Cortex. 2004;14:731–740. doi: 10.1093/cercor/bhh033. [DOI] [PubMed] [Google Scholar]
- Liegeois-Chauvel C, Musolino A, Badier JM, Marquis P, Chauvel P. Evoked potentials recorded from the auditory cortex in man: evaluation and topography of the middle latency components. Electroencephalography and Clinical Neurophysiology. 1994;92:204–214. doi: 10.1016/0168-5597(94)90064-7. [DOI] [PubMed] [Google Scholar]
- Lütkenhöner B. Single-dipole analyses of the N100m are not suitable for characterizing the cortical representation of pitch. Audiology and Neurootology. 2003;8:222–233. doi: 10.1159/000071062. [DOI] [PubMed] [Google Scholar]
- Mody M, Studdert-Kennedy M, Brady S. Speech perception deficits in poor readers: auditory processing or phonological coding? Journal of Experimental Child Psychology. 1997;64:199–231. doi: 10.1006/jecp.1996.2343. [DOI] [PubMed] [Google Scholar]
- Näätänen R, Picton T. The N1 wave of the human electric and magnetic response to sound: a review and an analysis of the component structure. Psychophysiology. 1987;24:375–425. doi: 10.1111/j.1469-8986.1987.tb00311.x. [DOI] [PubMed] [Google Scholar]
- Numminen J, Salmelin R, Hari R. Subject’s own speech reduces reactivity of the human auditory cortex. Neuroscience Letters. 1999;265:119–122. doi: 10.1016/s0304-3940(99)00218-9. [DOI] [PubMed] [Google Scholar]
- Obleser J, Lahiri A, Eulitz C. Auditory-evoked magnetic field codes place of articulation in timing and topography around 100 milliseconds post syllable onset. Neuroimage. 2003;20:1839–1847. doi: 10.1016/j.neuroimage.2003.07.019. [DOI] [PubMed] [Google Scholar]
- Obleser J, Lahiri A, Eulitz C. Magnetic brain response mirrors extraction of phonological features from spoken vowels. Journal of Cognitive Neuroscience. 2004;16:31–39. doi: 10.1162/089892904322755539. [DOI] [PubMed] [Google Scholar]
- Papanicolaou AC, Castillo E, Breier JI, David RN, Simos PG, Diehl RL. Differential brain activation patterns during perception of voice and tone onset time series: a MEG study. Neuroimage. 2003;18:448–459. doi: 10.1016/s1053-8119(02)00020-4. [DOI] [PubMed] [Google Scholar]
- Phillips C, Pellathy T, Marantz A, Yellin E, Wexler K, Poeppel D, McGinnis M, Roberts T. Auditory cortex accesses phonological categories: an MEG mismatch study. Journal of Cognitive Neuroscience. 2000;12:1038–1055. doi: 10.1162/08989290051137567. [DOI] [PubMed] [Google Scholar]
- Poeppel D, Yellin E, Phillips C, Roberts TP, Rowley HA, Wexler K, Marantz A. Task-induced asymmetry of the auditory evoked M100 neuromagnetic field elicited by speech sounds. Brain Research: Cognitive brain research. 1996;4:231–242. doi: 10.1016/s0926-6410(96)00643-x. [DOI] [PubMed] [Google Scholar]
- Roberts TP, Flagg EJ, Gage NM. Vowel categorization induces departure of M100 latency from acoustic prediction. Neuroreport. 2004;15:1679–1682. doi: 10.1097/01.wnr.0000134928.96937.10. [DOI] [PubMed] [Google Scholar]
- Roberts TP, Poeppel D. Latency of auditory evoked M100 as a function of tone frequency. Neuroreport. 1996;7:1138–1140. doi: 10.1097/00001756-199604260-00007. [DOI] [PubMed] [Google Scholar]
- Shestakova A, Brattico E, Soloviev A, Klucharev V, Huotilainen M. Orderly cortical representation of vowel categories presented by multiple exemplars. Brain Research: Cognitive Brain Research. 2004;21:342–350. doi: 10.1016/j.cogbrainres.2004.06.011. [DOI] [PubMed] [Google Scholar]
- Shtyrov Y, Pihko E, Pulvermuller F. Determinants of dominance: Is language laterality explained by physical or linguistic features of speech? Neuroimage. 2005;27:37–47. doi: 10.1016/j.neuroimage.2005.02.003. [DOI] [PubMed] [Google Scholar]
- Simos PG, Diehl RL, Breier JI, Molis MR, Zouridakis G, Papanicolaou AC. MEG correlates of categorical perception of a voice onset time continuum in humans. Brain Research: Cognitive brain research. 1998;7:215–219. doi: 10.1016/s0926-6410(98)00037-8. [DOI] [PubMed] [Google Scholar]
- Steinschneider M, Schroeder CE, Arezzo JC, Vaughan HG., Jr Physiologic correlates of the voice onset time boundary in primary auditory cortex (A1) of the awake monkey: temporal response patterns. Brain and Language. 1995;48:326–340. doi: 10.1006/brln.1995.1015. [DOI] [PubMed] [Google Scholar]
- Steinschneider M, Volkov IO, Fishman YI, Oya H, Arezzo JC, Howard MA., 3rd Intracortical responses in human and monkey primary auditory cortex support a temporal processing mechanism for encoding of the voice onset time phonetic parameter. Cerebral Cortex. 2005;15:170–186. doi: 10.1093/cercor/bhh120. [DOI] [PubMed] [Google Scholar]