

Abstract
Photodynamic therapy (PDT) directed against the endoplasmic reticulum (ER) is also known to target antiapoptotic Bcl-2 family proteins. This effect is associated with the initiation of both apoptosis, a cell death pathway, and autophagy, an organelle recycling system that can lead to survival or cell death. In this study, we examined the ability of the Bcl-2 antagonist HA14-1 to promote the photodynamic efficacy of PDT directed at the ER. At concentrations that independently caused only a small loss of viability, HA14-1 markedly enhanced the proapoptotic and phototoxic effects of ER photodamage. These results provide additional evidence that the antiapoptotic properties of Bcl-2 constitute an important determinant of photokilling, and demonstrate that synergistic effects can result when PDT is coupled with pharmacologic suppression of Bcl-2 function.
INTRODUCTION
HA14-1 (1) is one of a number of small-molecule Bcl-2 antagonists being developed with a view toward promoting apoptotic death of malignant cells. In this work, there appears to be an implicit assumption that there will be selectivity toward neoplasia. Many examples of synergy between antitumor chemotherapy and HA14-1 have now been reported (2-7). These results suggest a role for certain Bcl-2 family proteins as potential antagonists of chemotherapeutic drug responses. Photodynamic therapy (PDT) is also known to cause photodamage to antiapoptotic members of the Bcl-2 family (8-10). In this study, we examined the ability of HA14-1 to promote the direct photokilling of murine leukemia L1210 cells by PDT, using the porphycene termed CPO. This photosensitizer is known to specifically target the endoplasmic reticulum (ER), and can catalyze photodamage to Bcl-2 localized in the ER (11). In an earlier report, we provided evidence that the activation of procaspase-3 by HA14-1 could be promoted by ER photodamage or the protein kinase inhibitor staurosporine (12). These results suggested that the efficacy of suboptimal PDT doses might also be enhanced by concentrations of HA14-1 that, alone, would have limited cytotoxicity.
Many photosensitizing agents have multiple targets, e.g. lysosomes, the cell membrane and/or mitochondria (13). We chose CPO for this initial study to eliminate some possibly confounding elements of PDT. Lysosomes are required for autophagy so that their photodynamic disruption could affect the autophagic process. Moreover, release of cytochrome c from photodamaged mitochondria would lead to release of cytochrome c and an apoptotic response that Bcl-2 might not antagonize. Later studies are planned involving different other photosensitizing agents, but here we have confined the experimental approach to a single compound.
MATERIALS AND METHODS
Chemicals
The porphycene CPO (14) was synthesized by Dr. Graça Vicente, Department of Chemistry, Louisiana State University. Stock solutions were prepared in DMSO and stored at 4°C. Amino acids and tissue culture media were purchased from Sigma-Aldrich (St. Louis, MO); sterile horse serum was obtained from GIBCO-BRL (Grand Island, NY). HO342, a fluorescent probe for chromatin fragmentation, Er Tracker (ErTr), a fluorescent probe for the ER and DEVD-rhodamine 110, a fluorogenic substrate for caspase 3/7 activation, were obtained from Molecular Probes (Eugene, OR). HA14-1 was purchased from Ryan Scientific Inc. (Isle of Palms, SC). Stock solutions (10 mm) were made up in anhydrous DMSO and stored at 4°C in sealed containers.
Cells and media
Murine leukemia L1210 cells were grown in sealed flasks using an MEM formulation approximating that of Fisher’s medium, supplemented with 10% horse serum and 1 mm glutamine, 1 μm mercaptoethanol and gentamicin (15,16). In the experiments reported here, exponentially growing cells were collected and resuspended at a density of 3.5 × 10⁶ mL-1 (7 mg mL-1 wet weight) in fresh medium with 25 mm HEPES buffer pH 7.4 replacing NaHCO3. This substitution permits the maintenance of a near-neutral pH at this cell density for at least 2 h without any evidence of spontaneous apoptosis or autophagy.
Protocols
The toxicity and proapopotic properties of HA14-1 were evaluated by incubating L1210 cells with 10 or 15 μm drug concentrations at 37°C. DEVDase activation, chromatin fragmentation, cell morphology and viability were then measured as described below. PDT effects were assessed after photosensitizing cultures with 2 μm CPO for 30 min at 37°C. In some experiments, 10 or 15 μm HA14-1 was also present during this incubation. The cells were then resuspended in fresh medium and irradiated at 15°C using 620 ± 20 nm light. The source was a 600 W quartz-halogen lamp with IR radiation attenuated by a 10 cm layer of water and the bandwidth further defined by an interference filter (Oriel, Stratford, CT). A power density of 1.5 mW cm-2 was used as indicated by a Vector H410 photometer (ScienTech, Boulder, CO). Cultures were then incubated for 30 min at 37°C and aliquots taken for assessing DEVDase activation and viability (clonogenicity).
DEVDase assays
Cells were collected 30 min after exposure to inhibitors, irradiation or both, washed, and lysed in 200 μL of buffer containing 10 mm Tris (pH 7.2), 0.01% Triton X-100, 1 mm EDTA and 100 mm NaCl. The lysate was briefly sonicated and the debris removed by centrifugation at 10 000 g for 1 min. The supernatant fluid (100 μL) was mixed with an equal volume of 10 mm PIPES (pH 7.5), 2 mm EDTA, 0.1% CHAPS and 10 mm DTT. To this was added zDEVD-R110 (final concentration = 10 μm). The rate of increase in fluorescence, resulting from release of rhodamine-110 from the fluorogenic substrate, was measured over 30 min at room temperature using a fluorescence plate reader. Control determinations were made on untreated cells. Each assay was performed in triplicate.
Microscopy
To detect the extent of chromatin condensation, cell cultures were treated with the fluorescent probe HO342 (1 μm) during the final 5 min of incubations. Phase contrast and fluorescence images were acquired using a Nikon Eclipse E600 microscope and a CoolSnap HQ CCD camera (Photometrics). HO342 (Höchst dye HO33342) and ErTr (Er Tracker) fluorescence were detected using 350-390 nm excitation and 400-450 nm emission. Fluorescence localization of CPO was assessed with 400-440 nm excitation and 590-650 nm emission. A Uniblitz shutter was used to control exposure of the stage to the excitation source with the lamp shutter configured to open and close with the camera shutter, to minimize photobleaching.
CPO transport and localization
Localization of CPO in the ER was previously reported (11). To insure that treatment with CPO did not alter localization or total accumulation, L1210 cells were incubated with 2 μm CPO ± 15 μm HA14-1 for 30 min at 37°C, then washed and imaged. To permit comparisons of image brightness, fluorescence images for each probe were acquired under the same exposure conditions. The gray scale of the 8-bit images ranged from 0 (black) to 256 (white). Image analysis was carried out using the Integrated Morphometry Analysis program provided by MetaMorph. Fluorescence intensity is expressed as the integrated value of all pixels per cell that exceed the inclusive threshold value set at 45, i.e. the darker pixels were excluded. Comparisons of image brightness were carried out as described in Kessel and Reiners (16). At least 25 cells were used for acquiring this information (Table 2).
Table 2.
Integrated morphometry analysis of CPO labeling of L1210 cells
| Treatment | Relative intensity | n |
|---|---|---|
| None | 421 ± 37 | 25 |
| HA14-1 | 428 ± 41 | 25 |
Effects of a 30 min treatment with HA14-1 (15 μm) on fluorescence intensity of CPO (2 μm, 30 min). Data represent relative pixel intensity (mean ± SD) for 25 cells per field.
Effects of HA14-1 on CPO localization were assessed by fluorescence microscopy using a Z drive so that 20 images acquired over the entire thickness of the cells. The resulting images were deconvoluted using AutoQuant software (3D blind deconvolution). For comparison, similarly treated cells were treated with 1 μm ErTR for 5 min to provide a comparison using a fluorescent probe for ER localization. The resulting images are shown in Fig. 4.
Figure 4.
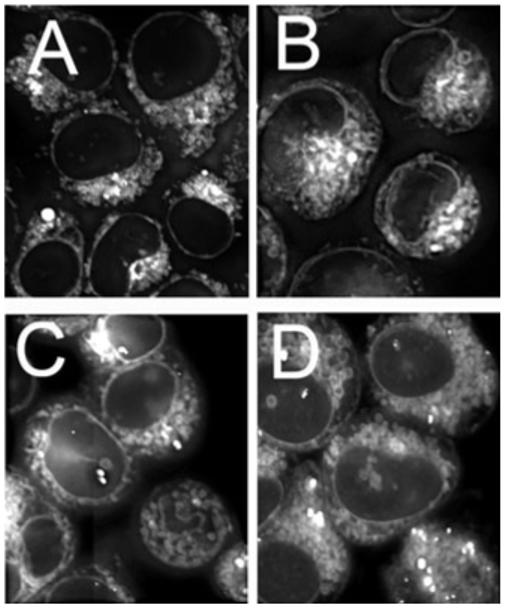
Localization patterns of CPO in L1210 cells. A, C = controls; B, D = cells previously exposed to 15 μm HA14-1 for 30 min at 37°C. A, B = cells incubated with 1 μm ErTr for the final 5 min at 37°C. D = cells treated with 2 μm CPO for 30 min at 37°C.
A separate estimate of accumulation was carried out by treating cell cultures with a 2 μm CPO concentration for 30 min in the presence vs absence of 15 μm HA14-1. The cell pellets were then washed and dispersed in 3 mL of 10 mm Triton X-100. Fluorescence at 650 nm measured upon excitation at 400 ± 20 nm. The CPO fluorescence in the extracellular fluid was also determined, and the distribution ratio of CPO (cells/medium) was calculated.
Clonogenic assays
Clonogenic assays were used to determine loss of viability. Serial dilutions of control vs treated cell suspensions were plated on soft agar. After a 7-9 day growth in a humidified atmosphere of 5% CO2, colonies were counted and compared with untreated control values. All such experiments were carried out in triplicate. The plating efficiency of control L1210 cell cultures was approximately 70%. Results are reported in terms of % control colony counts.
Western blots for Bcl-2 photodamage
To test for Bcl-2 photodamage, cells were incubated with 10 or 15 μm HA14-1 alone for 30 min. PDT effects were determined by incubations with 2 μm CPO alone or in combination with HA14-1 for 30 min. Cells were then resuspended in fresh medium and irradiated (30 mJ cm-2). After these incubations, the cells were collected, lysed and the extracts analyzed for Bcl-2 (16).
RESULTS AND DISCUSSION
Effects of low-dose HA14-1 on DEVDase activation and viability
Treatment of L1210 cells with 10 or 15 μm HA14-1 for 30 min resulted in a dose-dependent enhancement of DEVDase activity, reflecting conversion of procaspases 3/7 to the active forms. There was also a progressive decrease in viability that correlated with HA14-1 concentration (Table 1, top row). At these HA14-1 levels, a few cells with condensed apoptotic nuclei were observed, along with some cells with the cytosolic vacuoles characteristic of autophagy (Fig. 1C-F). In previous studies, we found that the appearance of such vacuoles, after exposure of L1210 cells to HA14-1, was associated with other hallmarks of autophagy: appearance of double membranes observed by electron microscopy and enhanced processing of the protein LC3-I to LC3-II (15-18). For comparison, panels G and H show the effects of an LD50 concentration of HA14-1 (25 μm).
Table 1.
Effects of PDT or HA14-1 and combinations on DEVDase activation and loss of viability
| Light dose (mJ cm-2) | Controls |
HA14-1 (10 μm) |
HA14-1 (15 μm) |
|||||
|---|---|---|---|---|---|---|---|---|
| LVO | DEVDase | LVO | LVP | DEVDase | LVO | LVP | DEVDase | |
| 0 | 0 | 0.10 ± 0.03 | 5 ± 1 | 0.22 ± 0.06 | 20 ± 4 | 1.1 ± 0.03 | ||
| 15 | 5 ± 2 | 0.18 ± 0.07 | 30 ± 5* | 10 | 1.4 ± 0.07 | 75 ± 4** | 25 | 1.2 ± 0.3 |
| 30 | 15 ± 3 | 0.83 ± 0.32 | 70 ± 5** | 20 | 5.1 ± 0.8 | 94 ± 2** | 35 | 7.1 ± 0.9 |
| 60 | 80 ± 5 | 7.7 ± 1.2 | 95 ± 3 | 85 | 7.4 ± 1.2 | 99 ± 1 | 100 | 7.8 ± 1.3 |
LVO = observed loss of viability (% control); LVP = predicted loss of viability based on individual effects of HA14-1 and photodynamic therapy (PDT). DEVDase activity is expressed in terms of nmol min-1 mg-1 protein. Data represent average ± SD for three determinations. Statistically different from predicted value
P < 0.05
P < 0.01.
Figure 1.
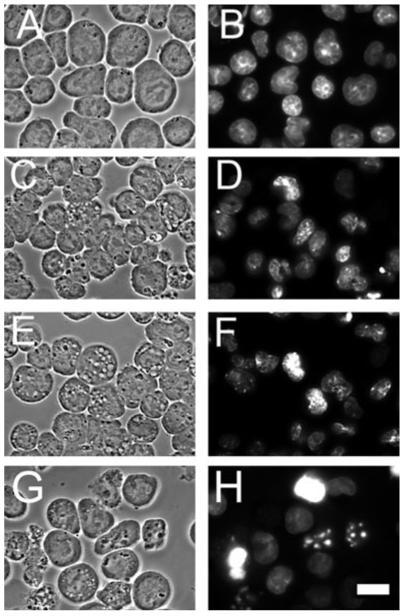
Effects of a 60 min incubation with 0, 10 or 15 μm HA14-1 on L1210 cells. A, C, E, G = phase-contrast images; B, D, F, H = HO342 fluorescence. A, B = controls, C, D = 10 μm HA14-1; E, F = 15 μm HA14-1. For comparison (G, H), effects of a 25 μm HA14-1 concentration (LD50 conditions) are also shown. White bar in panel H = 10 μm. Autophagic vacuoles can be seen in panels C, E and G.
Promotion of PDT efficacy by HA14-1
As the light dose was increased, cells photosensitized with CPO showed a progressive loss of viability (Table 1, column 2), along with increased DEVDase activation (Table 1, column 3). An LD50 effect (50% loss of viability) occurred at a light dose of approximately 45 mJ cm-2. In the presence of 10 or 15 μm HA14-1, the corresponding LD50 values were 22 and 9 mJ cm-2, respectively. These results indicate that at a 10 μm concentration of HA14-1, a level that reduced viability by 5%, the light dose required for an LD50 effect was reduced by 50%.
At a 30 mJ cm-2 light dose, the mean survival of cultures treated with CPO/PDT alone was 85% of control. Addition of 10 or 15 μm HA14-1 reduced this to 30% and 5%, respectively (Fig. 2). Microscopic examination of HO342-labeled cells, using the 30 mJ cm-2 light dose, revealed a progressive increase in the number of apoptotic nuclei 60 min after irradiation as the HA14-1 concentration was increased (Fig. 3). Effects of an LD50 light dose (45 mJ cm-2) in the absence of HA14-1 are also shown (Fig. 3I,J).
Figure 2.

Loss of viability as a function of light dose and HA14-1 concentration. Cells were treated with 2 μm CPO, HA14-1 or a combination of these agents for 30 min at 37°C, then irradiated with 0-90 mJ cm-2 of light (620 ± 20 nm) at 15°C. HA14-1 levels were zero (○), 0 μm (□) or 15 μm (Δ). Data represent average ± SD for three experiments.
Figure 3.
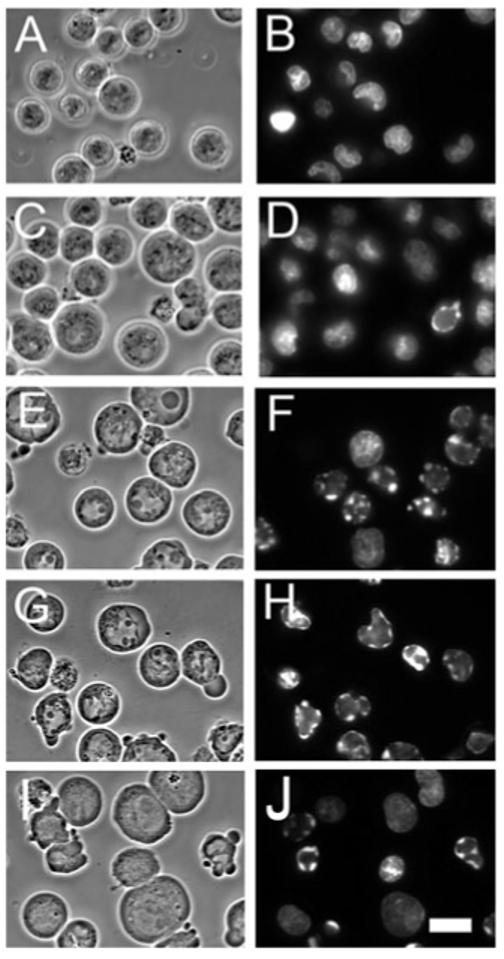
Phase contrast and HO342 fluorescence patterns of controls and cells photosensitized with CPO and irradiated (30 mJ cm-2) in the presence of 0, 10 or 15 μm HA14-1. A, C, E, G, I = phase-contrast images; B, D, F, H, J = HO342 fluorescence. A, B = controls; C-H = photosensitized and irradiated; C, D = no HA14-1; E, F = 10 μm HA14-1; G, H = 15 μm HA14-1. Images were acquired 60 min after a second incubation at 37°C for 60 min after irradiation. For comparison, panels I and J show the effects of an LD50 PDT dose using CPO alone. White bar in panel J = 10 μm.
CPO uptake and localization
The fluorescence localization pattern of CPO was shown to involve the ER, but not lysosomes or mitochondria, using fluorescence overlays with probes of known specificity (11). An examination of the CPO localization pattern at 1000× magnification, after a 30 min incubation with a 2 μm drug concentration, revealed no significant alteration in the presence or absence of HA14-1 (15 μm) (Fig. 4). For comparison, images of ErTr, a fluorescent probe for the ER, are also shown. The fluorescence intensity of the CPO images was estimated from the pixel value of images of at least 20 cells, acquired at 400× magnification (15). As suggested by results shown in Fig. 4C,D, the relative pixel intensity showed no significant difference in the presence or absence of 15 μm HA14-1 (Table 2).
Another further study was carried out involving measurement of fluorescence in cell pellets vs medium after a similar incubation. The distribution ratio of CPO (intracellular/extracellular) was found to be 1.13 ± 0.0.11. This was not significantly altered by the presence of 15 μm HA14-1 (1.16 ± 0.14). These data represent the mean ± SD for three determinations.
Apoptotic vs autophagic responses
CPO is known to localize in the ER (11), with subsequent irradiation leading to an apoptotic response (11,12,19). Treatment of L1210 cells with either HA14-1 or CPO/PDT has also been shown to promote autophagy (16,17,19,20), a process whereby cells recycle cytosolic contents and damaged organelles (20). As autophagy is promoted when Bcl-2 function is suppressed (21), this could therefore derive from the ER photodamage affecting Bcl-2 at that site. It has been reported that ER stress can also lead to autophagy (22).
The appearance of autophagic vacuoles in cells treated with HA14-1 alone (Fig. 1) is consistent with earlier reports demonstrating that hallmarks of autophagy are found in L1210 cells after treatment with HA14-1 (19). Autophagy can act as a prosurvival mechanism by recycling damaged or compromised cell components, but can also provide a death pathway if the level becomes excessive (23). We have described the appearance of an initial wave of autophagy followed by apoptosis when L1210 cells were exposed to HA14-1 (19) or PDT (18). The prosurvival effect of autophagy was proposed to explain the “shoulder” on the dose-response curve (Fig. 2). A similar finding was also demonstrated previously (17), attributed to autophagy acting as a prosurvival process. In a later study, we found that the rapid appearance of autophagy had ended by 60 min after irradiation and apoptosis then predominated (18). This likely accounts for the lack of autophagic vacuoles in Fig. 3. It is perhaps noteworthy that the dose-response “shoulder” is essentially absent at the higher HA14-1 dose (Fig. 3). In the study cited above (16), we also detected a significant dose-response “shoulder” using low-dose PDT, but not under LD90 conditions. This difference might be attributed to photodamage to proteins required for autophagy at higher PDT doses or perhaps such proteins being substrates for caspases; these proteases are known to have a wide variety of targets (24).
After high-dose PDT (15-17,19), or when apoptosis is suppressed (19), autophagy can also become a death pathway. Under conditions described here, this appears unlikely as the number of vacuolated cells shown in Fig. 1C,E clearly involves many more than are killed. The loss of viability after treatment with 10 or 15 μm HA14-1 = 10% and 29%, respectively (Table 1). Moreover, under conditions where a substantial cell kill did result from the combination of HA14-1 + PDT, there appeared to be few autophagic vacuoles (Fig. 3G). These results are consistent with the hypothesis that autophagy acts mainly as a survival mechanism unless apoptosis is suppressed by pharmacologic or genetic manipulation. Additional studies are in progress to delineate the possible contribution of autophagy in cell death after PDT + HA14-1.
Synergism between HA14-1 and CPO/PDT
The Bcl-2 family antagonist HA14-1 is known to potentiate the apoptotic response to many conventional antitumor agents (2-7). We previously reported that PDT or staurosporin could enhance the activation of procaspase-3 by HA14-1 (12). The present study shows that the efficacy of PDT is also enhanced by concentrations of HA14-1 that have only limited toxicity. Data shown in Table 1 and Fig. 2, involving HA14-1 alone, are consistent with the proposal that initiation of apoptosis, a direct and irreversible pathway to cell death, occurs once a threshold level of Bcl-2 impairment has been achieved. The anti-Bcl-2 effects of a relatively small concentration of a Bcl-2 antagonist such as HA14-1 could therefore yield a substantial promotion to the efficacy of a suboptimal PDT dose.
An alternative explanation is suggested by a recent report (25) showing that HA14-1 is unstable in aqueous solution and can produce reactive oxygen species (ROS) during the decomposition process. This group attributes the proapoptotic effects of HA14-1 to ROS formation rather than to inhibition of Bcl-2 function. Additional oxidative stress resulting from by-products of HA14-1 decomposition could indeed contribute to the proapoptotic effects of PDT. We had previously reported that DCFDA oxidation, a test for ROS formation, could be produced by either PDT (using CPO) or HA14-1-induced apoptosis (12). H2DCF was used to monitor ROS produced by HA14-1 in phosphate-buffered saline. In such a system, it is not clear what is being measured as reduced DCF does not directly interact with ROS, but is co-oxidized by peroxidases involved in the detoxification of products generated during oxidative stress (26).
Bcl-2 photodamage
Treatment of L1210 cells with a 10 or 15 μm concentration of HA14-1 for 60 min did not yield a detectable effect on the level of Bcl-2 as shown by western blots (Fig. 5). At the PDT dose resulting from a 30 mJ cm-2 irradiation of photosensitized cells, we detected only a minor decrease in the level of Bcl-2. There was no obvious promotion of Bcl-2 loss when HA14-1 was present. These results suggest that binding of HA14-1 to Bcl-2 does not appear to promote Bcl-2 photodamage, but in these western blots, total protein is being examined. It is possible that HA14-1 may be promoting photodamage to Bcl-2 localized specifically in the ER. In studies to be reported elsewhere, we have identified a variety of antiapoptotic members of the Bcl-2 family in L1210 cells including Bcl-B and Mcl-1. Bcl-xL is also present, but is a cytosolic protein in this cell line and is thereby protected from CPO-catalyzed photodamage (17). The role of these proteins in PDT efficacy is not entirely clear. Oleinick’s group has shown that caspase-induced cleavage of Mcl-1 can result in the appearance of a proapoptotic fragment (10) that enhances the apoptotic response.
Figure 5.
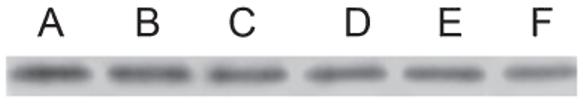
Western blots showing total Bcl-2 content of L1210 cells: A = control; B = 10 μm HA14-1; C = 15 μm HA14-1; D = CPO/PDT (30 J cm-2); E = 10 μm HA14-1 + CPO/PDT; F = 15 μm HA14-1 + CPO/PDT.
CONCLUSIONS
Hasan’s group has proposed several strategies for the promotion of PDT effects (27). One of these involved combination therapies with a view toward increasing susceptibility of cells to PDT. Concurrent treatment with PDT and low-dose HA14-1 or similar products may represent a similar approach. A pertinent question that arises with regard to any attempt to promote PDT efficacy relates to selectivity. Current efforts directed at development of Bcl-2 family antagonists for cancer therapy are predicated on the assumption that selectivity for malignant cell types will be found. As new agents are identified, their ability to promote, perhaps selectively, PDT-induced eradication of cancer needs to be examined.
Based on results shown in Fig. 3, we propose that HA14-1 promotes apoptosis after PDT, and that this represents the basis for the synergy shown in Fig. 2 and Table 1. Other investigators are also currently exploring the role of autophagy as a PDT response (28,29). Based on studies described here and elsewhere (15-18), we propose that autophagy initially acts as a prosurvival mechanism, permitting the recycling of photodamaged organelles. Autophagic death may assume a greater significance in cells unable to undergo apoptosis because of either the intrinsic lack of the appropriate proteins, or when pathways required for apoptosis are blocked.
Acknowledgements
This work was supposed by NIH R01CA023378. The content is solely the responsibility of the authors and does not necessarily represent the official views of the National Cancer Institute of the National Institutes of Health. Excellent technical services were provided by Ann Marie Santiago and Nakaiya Okan-Mensah.
REFERENCES
- 1.Wang JL, Liu D, Zhang ZJ, Shan S, Han X, Srinivasula SM, Croce CM, Alnemri ES, Huang Z. Structure-based discovery of an organic compound that binds Bcl-2 protein and induces apoptosis of tumor cells. Proc. Natl Acad. Sci. USA. 2000;97:7124–7129. doi: 10.1073/pnas.97.13.7124. [DOI] [PMC free article] [PubMed] [Google Scholar]
- 2.Pei XY, Dai Y, Grant S. The small-molecule Bcl-2 inhibitor HA14-1 interacts synergistically with flavopiridol to induce mitochondrial injury and apoptosis in human myeloma cells through a free radical-dependent and Jun NH2-terminal kinase-dependent mechanism. Mol. Cancer Ther. 2004;3:1513–1524. [PubMed] [Google Scholar]
- 3.Pei XY, Dai Y, Grant S. The proteasome inhibitor bortezomib promotes mitochondrial injury and apoptosis induced by the small molecule Bcl-2 inhibitor HA14-1 in multiple myeloma cells. Leukemia. 2003;17:2036–2045. doi: 10.1038/sj.leu.2403109. [DOI] [PubMed] [Google Scholar]
- 4.Lickliter JD, Wood NJ, Johnson L, McHugh G, Tan J, Wood F, Cox J, Wickham NW. HA14-1 selectively induces apoptosis in Bcl-2-overexpressing leukemia/lymphoma cells, and enhances cytarabine-induced cell death. Leukemia. 2003;17:2074–2080. doi: 10.1038/sj.leu.2403102. [DOI] [PubMed] [Google Scholar]
- 5.Manero F, Gautier F, Gallenne T, Cauquil N, Gree D, Cartron PF, Geneste O, Gree R, Vallette FM, Juin P. The small organic compound HA14-1 prevents Bcl-2 interaction with Bax to sensitize malignant glioma cells to induction of cell death. Cancer Res. 2006;66:2757–2764. doi: 10.1158/0008-5472.CAN-05-2097. [DOI] [PubMed] [Google Scholar]
- 6.Skommer J, Wlodkowic D, Matto M, Eray M, Pelkonen J. HA14-1, a small molecule Bcl-2 antagonist, induces apoptosis and modulates action of selected anticancer drugs in follicular lymphoma B cells. Leukemia Res. 2006;30:322–331. doi: 10.1016/j.leukres.2005.08.022. [DOI] [PubMed] [Google Scholar]
- 7.Doshi JM, Tian D, Xing C. Structure-activity relationship studies of ethyl 2-amino-6-bromo-4-(1-cyano-2-ethoxy-2-oxoethyl)-4H-chromene-3-carboxylate (HA 14-1), an antagonist for antiapoptotic Bcl-2 proteins to overcome drug resistance in cancer. J. Med. Chem. 2006;49:7731–7739. doi: 10.1021/jm060968r. [DOI] [PubMed] [Google Scholar]
- 8.Kim HR, Luo Y, Li G, Kessel D. Enhanced apoptotic response to photodynamic therapy after bcl-2 transfection. Cancer Res. 1999;59:3429–3432. [PMC free article] [PubMed] [Google Scholar]
- 9.Usuda J, Azizuddin K, Chiu SM, Oleinick NL. Association between the photodynamic loss of Bcl-2 and the sensitivity to apoptosis caused by phthalocyanine photodynamic therapy. Photochem. Photobiol. 2003;78:1–8. doi: 10.1562/0031-8655(2003)078<0001:abtplo>2.0.co;2. [DOI] [PubMed] [Google Scholar]
- 10.Xue LY, Chiu SM, Oleinick NL. Differential responses of Mcl-1 in photosensitized epithelial vs lymphoid-derived human cancer cells. Oncogene. 2005;24:6987–6992. doi: 10.1038/sj.onc.1208837. [DOI] [PubMed] [Google Scholar]
- 11.Kessel D, Castelli M, Reiners JJ., Jr Ruthenium red-mediated suppression of Bcl-2 loss and Ca(2+) release initiated by photodamage to the endoplasmic reticulum: scavenging of reactive oxygen species. Cell Death Differ. 2005;12:502–511. doi: 10.1038/sj.cdd.4401579. [DOI] [PubMed] [Google Scholar]
- 12.Kessel D, Castelli M, Reiners JJ., Jr Apoptotic response to photodynamic therapy versus the Bcl-2 antagonist HA14-1. Photochem. Photobiol. 2002;76:314–319. doi: 10.1562/0031-8655(2002)076<0314:artptv>2.0.co;2. [DOI] [PubMed] [Google Scholar]
- 13.Dougherty TJ, Gomer CJ, Henderson BW, Jori G, Kessel D, Korbelik M, Moan J, Peng Q. Photodynamic therapy. J. Natl Cancer Inst. 1998;90:889–905. doi: 10.1093/jnci/90.12.889. [DOI] [PMC free article] [PubMed] [Google Scholar]
- 14.Toledano H, Edrei R, Kimel S. Photodynamic damage by liposome-bound porphycenes: comparison between in vitro and in vivo models. J. Photochem. Photobiol. B, Biol. 1998;42:20–27. doi: 10.1016/S1011-1344(97)00110-3. [DOI] [PubMed] [Google Scholar]
- 15.Kessel D, Vicente MG, Reiners JJ., Jr Initiation of apoptosis and autophagy by photodynamic therapy. Lasers Surg. Med. 2006;38:482–488. doi: 10.1002/lsm.20334. [DOI] [PMC free article] [PubMed] [Google Scholar]
- 16.Kessel D, Reiners JJ., Jr Apoptosis and autophagy after mitochondrial or endoplasmic reticulum photodamage. Photochem. Photobiol. 2007;83:1024–1028. doi: 10.1111/j.1751-1097.2007.00088.x. [DOI] [PMC free article] [PubMed] [Google Scholar]
- 17.Kessel D. Death pathways associated with photodynamic therapy. Med. Laser Appl. 2006;21:219–224. doi: 10.1016/j.mla.2006.05.006. [DOI] [PMC free article] [PubMed] [Google Scholar]
- 18.Kessel D, Segarra Arroyo A. Mechanisms of direct photokilling by photodynamic therapy. Photochem. Photophys. Sci. 2007;6:1290–1295. [Google Scholar]
- 19.Kessel D, Reiners JJ., Jr Initiation of apoptosis and autophagy by the Bcl-2 antagonist HA14-1. Cancer Lett. 2007;249:294–299. doi: 10.1016/j.canlet.2006.09.009. [DOI] [PMC free article] [PubMed] [Google Scholar]
- 20.Shintani T, Klionsky DJ. Autophagy in health and disease: a double-edged sword. Science. 2004;306:990–995. doi: 10.1126/science.1099993. [DOI] [PMC free article] [PubMed] [Google Scholar]
- 21.Pattingre S, Levine B. Bcl-2 inhibition of autophagy: a new route to cancer? Cancer Res. 2006;66:2885–2888. doi: 10.1158/0008-5472.CAN-05-4412. [DOI] [PubMed] [Google Scholar]
- 22.Hoyer-Hansen M, Jaattela M. Connecting endoplasmic reticulum stress to autophagy by unfolded protein response and calcium. Cell Death Differ. 2007;14:1576–1582. doi: 10.1038/sj.cdd.4402200. [DOI] [PubMed] [Google Scholar]
- 23.Gozuacik D, Kimchi A. Autophagy and cell death. Curr. Top. Dev. Biol. 2007;78:217–245. doi: 10.1016/S0070-2153(06)78006-1. [DOI] [PubMed] [Google Scholar]
- 24.Kumar S. Caspases and their many biological functions. Cell Death Differ. 2006;14:1–2. [Google Scholar]
- 25.Doshi JM, Tian D, Xing C. Ethyl-2-amino-6-bromo-4-(1-cyano-2-ethoxy-2-oxoethyl)-4H-chromene-3-carboxylate (HA 14-1), a prototype small-molecule antagonist against anti-apoptotic Bcl-2 proteins, decomposes to generate reactive oxygen species that induce apoptosis. Mol. Pharmaceut. 2007;4(6):919–928. doi: 10.1021/mp7000846. [DOI] [PubMed] [Google Scholar]
- 26.Robertson FM, Beavis AJ, Oberyszyn TM, O’Connell SM, Dokidos A, Laskin DL, Laskin JD, Reiners JJ., Jr Production of hydrogen peroxide by murine epidermal keratinocytes following treatment with the tumor promoter 12-O-tetradecanoylphorobol-13-acetate. Cancer Res. 1990;50:6020–6067. [PubMed] [Google Scholar]
- 27.Verma S, Watt GM, Mai Z, Hasan T. Strategies for enhanced photodynamic therapy effects. Photochem. Photobiol. 2007;83:996–1006. doi: 10.1111/j.1751-1097.2007.00166.x. [DOI] [PubMed] [Google Scholar]
- 28.Buytaert E, Callewaert G, Hendrickx N, Scorrano L, Hartmann D, Missiaen L, Vandenheede JR, Heirman I, Grooten J, Agostinis P. Role of endoplasmic reticulum depletion and multidomain proapoptotic BAX and BAK proteins in shaping cell death after hypericin-mediated photodynamic therapy. FASEB J. 2006;20:756–758. doi: 10.1096/fj.05-4305fje. [DOI] [PubMed] [Google Scholar]
- 29.Xue LY, Chiu SM, Azizuddin K, Joseph S, Oleinick NL. The death of human cancer cells following photodynamic therapy: apoptosis competence is necessary for Bcl-2 protection but not for induction of autophagy. Photochem. Photobiol. 2007;83:1016–1023. doi: 10.1111/j.1751-1097.2007.00159.x. [DOI] [PubMed] [Google Scholar]