Abstract
The spread of H5N1 avian influenza and the recent high numbers of confirmed human cases have raised international concern about the possibility of a new pandemic. Therefore, antiviral drugs are now being stockpiled to be used as a first line of defence. The large-scale use of antivirals will however exert a strong selection pressure on the virus, and may lead to the emergence of drug-resistant strains. A few mathematical models have been developed to assess the emergence of drug resistance during influenza pandemics. These models, however, neglected the spatial structure of large populations and the stochasticity of epidemic and demographic processes. To assess the impact of population structure and stochasticity, we modify and extend a previous model of influenza epidemics into a metapopulation model which takes into account the division of large populations into smaller units, and develop deterministic and stochastic versions of the model. We find that the dynamics in a fragmented population is less explosive, and, as a result, prophylaxis will prevent more infections and lead to fewer resistant cases in both the deterministic and stochastic model. While in the deterministic model the final level of resistance during treatment is not affected by fragmentation, in the stochastic model it is. Our results enable us to qualitatively extrapolate the prediction of deterministic, homogeneous-mixing models to more realistic scenarios.
Keywords: influenza, metapopulation, drug resistance
1. Introduction
Recent human cases of H5N1 avian influenza have raised public concern. It is now considered an established fact that another influenza pandemic will occur sooner or later (e.g. Webby & Webster 2003). Given that our world is highly interconnected and interdependent (Hufnagel et al. 2004), this pandemic will certainly spread fast and widely.
Two types of antiviral drugs currently exist: the M2-inhibitors (M2I) and the neuraminidase inhibitors (NAI). M2Is target the M2 protein, an ion channel enabling the uncoating of the virion within the cell, which is a key step of the replication process. M2Is are only effective against influenza A (Stiver 2003). NAIs belong to a new class of antivirals including oseltamivir (Tamiflu), and zanamivir (Relenza). These drugs target the neuraminidase, which is required to release the budding virus from the cell and to prevent viral particles from clumping. NAIs therefore attenuate the infection.
A consequence of the use of antiviral drugs, however, is the emergence of drug resistance. Drug resistance in general is an urgent public health problem, costing human lives and money (Heymann 2006). Resistance against M2Is has risen rapidly over the past few years (Bright et al. 2006). The increasing incidence of M2I-resistant influenza A seems to be due to a high de novo resistance rate associated with low transmission fitness costs (Regoes & Bonhoeffer 2006). Given the chemical structure of oseltamivir, structural studies predicted some time ago that resistance to the drug could develop, allowing the NA to maintain its function (Moscona 2005). Several clinical cases have recently confirmed this prediction (de Jong et al. 2005). More alarmingly, transmission studies in ferrets and in vitro show that oseltamivir-resistant virus variants may differ in fitness and transmissibility. The R292K mutation, which also shows cross-resistance to zanamivir, hampers growth and transmission of the virus, because it reduces the sialidase activity. Viruses carrying the E119V mutation, however, have growth and transmission rates similar to wild-type viruses (Yen et al. 2005). In addition, it cannot be ruled out that a compensatory mutation could restore the fitness of other drug-resistant viruses.
These recent findings, combined with the fact that NAI drugs are being stockpiled world-wide underline the need for in vivo, in vitro and in silico studies to assess the emergence and spread of drug-resistant influenza viruses, under different public health interventions and patterns of drug use. In particular, computer simulations can provide guidelines for the most effective use of antiviral drugs (Stilianakis et al. 1998; Smith 2003), in terms of limiting both new infections and the emergence of drug resistance.
Recently, many complex models have been developed, that investigate the outcome of different public health interventions for controlling an influenza pandemic at the source (Ferguson et al. 2005; Longini et al. 2005), or for mitigating it once it has started to spread (Ferguson et al. 2006; Germann et al. 2006). These interventions include treatment and prophylaxis with antiviral drugs, vaccination, quarantine, restrictions on travel, school closure and other non-pharmaceutical interventions. Although these studies often mention the risk of the emergence and spread of drug-resistant viruses, none of them explicitly investigates the dynamics of resistance emergence. Some models, however, have already assessed the potential spread of drug-resistant viruses for M2Is (Stilianakis et al. 1998) as well as oseltamivir (Ferguson et al. 2003; Regoes & Bonhoeffer 2006). None of these studies took into account the spatial population structure, although Ferguson et al. (2003) incorporated population structure in terms of risk groups and age structure.
In this paper, we investigate the emergence and spread of oseltamivir-resistant influenza virus in a population structured into subpopulations (metapopulation), when different public-health interventions are performed. The work extends the studies of Stilianakis et al. (1998) and Regoes & Bonhoeffer (2006). First, we modify the initial model, and then extend it to a metapopulation. Then, we develop a stochastic version of the model. We implement spatial structure in a very abstract and generic way, rather than attempting to mimic the real world situation. This allows us to qualitatively investigate how spatial structure influences the epidemic and the efficacy of interventions.
2. Models and methods
We extended a previously published model describing an influenza outbreak in a school (Stilianakis et al. 1998) into a metapopulation model, i.e. we linked multiple epidemic foci by allowing individuals to migrate between them. We developed deterministic and stochastic versions of this metapopulation model.
2.1 Structure of the community
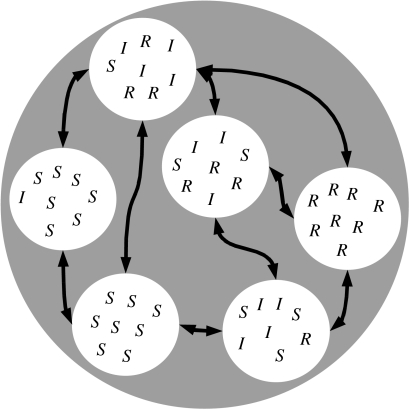
Different metapopulation structures can be studied in epidemiology, depending on what is defined as a patch (Hess et al. 2002). Given the organization of humans in well-defined spatial structures such as families, villages and towns (Grenfell & Harwood 1997), patches are groups of hosts in our model. Colonization of a patch corresponds to the establishment of an infection in a patch harbouring susceptible individuals. Local extinction of the disease occurs when all the infected hosts within the patch are removed (through recovery or death). It is also assumed that there is a homogeneous mixing within each subpopulation (figure 1).
Figure 1.
Structure of the population. The grey circle represents the whole population, white circles represent patches, arrows represent migration of individuals between patches. S, I and R stand for susceptible, infected and removed, respectively. The bottom-left patch is still disease-free, while the patch on the left has just been colonized. The parasite is locally extinct in the patch on the right.
We connect the disease dynamics within the patches by allowing individuals to migrate from one patch to the other. Mathematically, the migration process of individuals between patches is described as migration matrix , where μij is the rate of migration of individuals from population i to population j. This matrix determines the topology and the strength of the connections between the patches.
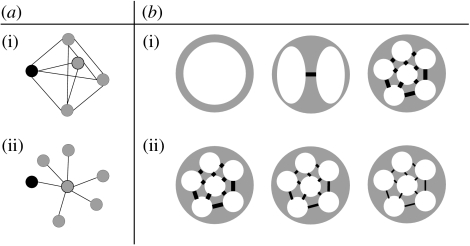
We model different population structures. Throughout this paper, the term population structure refers to the number of subpopulations, and to how they are connected (i.e. which subpopulations are connected, and what is the value of the migration rate). For a given number n of subpopulations, two types of subpopulation connections are investigated here (figure 2a). In the island-type of connections, all the subpopulations are interconnected; in the spider-type, n−1 subpopulations are connected only to a central one, and the infection starts in a peripheral subpopulation. For a given structure, a range of migration coefficients (the nonzero coefficients in the migration matrix) and of number of subpopulations (the size of the matrix) are investigated (figure 2b). We assume that migration is the same among connected subpopulations, which means that
and that all subpopulations have the same size N/n, where N is the total number of individuals and n the number of subpopulations. We chose a population size of N=500 because larger population sizes would have rendered simulations too long to run. A population of 500 individuals might not seem realistic for an influenza pandemic. We made sure, however, that the size of the population had no impact on our conclusions. (See appendix C2 for simulations with a bigger population size.)
Figure 2.
Population structures. (a) Different types of connections among subpopulations: (i) island and (ii) spider (these names were used by Hess (1996)). The black node is the one where the infection starts. (b) From the left to the right, increasing heterogeneity of mixing: (i) the number of subpopulations increases and (ii) the migration coefficient decreases. Throughout the paper, we assume that the total population size is N=500.
There is no age or social structure in the population and no seasonal variation of parameters (because we focus on the first 100 days of the epidemic only).
2.2 Epidemic parameters
The parameters of the model are listed in appendix A and were chosen to match with recent studies on oseltamivir-resistant viruses (Gubareva et al. 2001; Kiso et al. 2004).
R0, the basic reproductive number, is a key concept in epidemiology (Heffernan et al. 2005). It is defined as the number of secondary cases produced by a single infected individual during its entire infectious period, in a fully susceptible population (Diekmann et al. 1990; Anderson & May 1991). The transmission rates (the βs) are scaled so that the basic reproductive number of the sensitive strain, , is equal to 4.5 without drugs, and , the basic reproductive number of the resistant strain, equals 0.45. The next generation method (Diekmann et al. 1990; Heffernan et al. 2005), which is described in appendix B, was used to determine the under different interventions (table 1).
Table 1.
R0 values of the sensitive (s) and resistant (r) viruses for different interventions.
| no drugs | treatment | prophylaxis | |
|---|---|---|---|
| 4.5 | 2.6 | 0.2 | |
| ϕ | 0.45 | 0.45 |
Our is high when compared with the range used in recent models (always lower than 2.5 in Ferguson et al. (2005, 2006), Longini et al. (2005), Germann et al. (2006)). However, our value was estimated by Stilianakis et al. (1998) from data collected during an outbreak in a boarding school. It may be higher because a boarding school population is more homogeneously mixed than that of an entire town. If one estimated on the basis of data generated by our model (with ) using a homogeneously mixed model (e.g. Mills et al. 2004), the estimate of would be lower than 4.5 because the disease spreads slower in our model than in a homogeneous-mixing model. Hence, our choice of is not inconsistent with epidemiological data.
For we assumed a 10-fold resistance cost. Given the fact that oseltamivir-resistant strains found in humans to date are not transmissible (Herlocher et al. 2002, 2004), our may appear too high. However, because the large-scale use of oseltamivir may soon select for transmissible resistance, and compensatory mutations may reduce potential costs even further, one may argue that our is too low to describe oseltamivir-resistant influenza strains that may emerge during a future pandemic. With our choice of we try to strike a compromise between these two opposing views. Our results, however, seem to be robust with regard to the value of (see simulations performed with higher values of in appendix C1).
2.3 Deterministic model
Although containing many more classes, the model that we use to study the emergence of resistance is based on the classical SIR model (Kermack & McKendrick 1927). The set of equations describing the epidemic without any public health intervention corresponds to an SIIsR model. Infected people are divided into asymptomatic (I) and symptomatic (Is) classes. Both of them are infectious, but their infectiousness varies, and only those who develop clinical symptoms will be treated, when treatment is provided. See appendix A for a complete description of the equations.
Two kinds of interventions will be considered.
-
Treatment. All symptomatically infected individuals receive treatment (oseltamivir).
Infected people receiving treatment are less infective, develop symptoms more slowly and recover faster.
-
Prophylaxis. In addition to treatment of all symptomatic individuals, uninfected as well as asymptomatically infected individuals (as they appear to be uninfected) receive prophylaxis (oseltamivir).
Prophylaxed susceptibles become less susceptible to infection, while asymptomatically infected people are less infectious and recover faster.
While treatment is a continuous intervention, prophylaxis is not. At a given time, all the susceptible and asymptomatically infected individuals receive prophylaxis, and are then moved to the corresponding treated class.
Neither treatment nor prophylaxis has any effect on people infected by a resistant virus. Note that throughout the paper, a resistant virus refers to a drug-resistant virus, and that a resistant case refers to an individual shedding drug-resistant viruses.
More classes are required when interventions are performed, in order to represent individuals receiving treatment or prophylaxis.
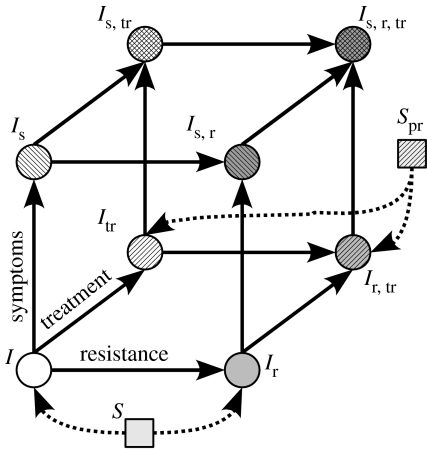
Infected individuals are distinguished according to whether they are symptomatically infected (s) or not, treated (tr) or not, and have developed resistance (r) or not (figure 3).
Susceptible individuals can receive prophylaxis (pr) or not.
Figure 3.
Schematic of the model. The eight different infected classes can be represented on a cube. The axes are resistance, treatment, symptoms. New infected individuals enter the cube from its bottom (i.e. no symptoms) side, because symptoms do not appear immediately after infection. On this side, the new infected individuals go to the ‘resistant’ edge (i.e. the Ir−Ir,tr edge) if they have been infected by an individual shedding resistant viruses (i.e. by an Ir, Is,r, Ir,tr, or Is,r,tr), and they go to the ‘treated’ edge (i.e. the Itr−Ir,tr edge) if they had received prophylaxis (i.e. if they were Spr).
For each class C, C∈{S,Spr,I,…,Is,r,tr}, Ci refers to the number of individuals of this class present in subpopulation i, 1≤i≤n. Moreover, migration terms are added to the equations described in Regoes & Bonhoeffer (2006). For Ci, this migration parameter is of the following form:
| (2.1) |
The first term refers to individuals of class C leaving subpopulation i for subpopulation j, while the second term refers to individuals arriving (see appendix A3 for the whole equations).
The ODEs were solved numerically using R's odesolve package (R Development Core Team 2005; Setzer 2005). We also determined how many people are infected during an epidemic (i.e. ‘total number of infected cases’), among them, how many shed resistant viruses (i.e. ‘total number of resistant cases’), and among the latter, what is the proportion of resistance that appeared de novo (i.e. appeared during infection, as opposed to transmitted resistance). See appendix A3 for formulae.
2.4 Stochastic model
The deterministic version of the model is made stochastic by using an implementation of the Gillespie algorithm (Gillespie 1976), which numerically simulates a Markov process. The Gillespie algorithm was coded in R for the purpose of this study. For each set of parameters, at least 100 stochastic simulations are run using this algorithm.
Since computing time increases exponentially with the division of the population (i.e. the number of subpopulations, or the number of different equations), simulations were run on a cluster of computers. Parallelization was performed by hand, by submitting different jobs corresponding to different sets of parameters to individual nodes of the computer cluster.
3. Results
3.1 Deterministic model
In this section, we investigate the impact of population structure and of different interventions on the dynamics and the final outcome of the epidemics, focusing on the development of drug resistance. The deterministic version of the model is used here.
3.1.1 Dynamics and final outcome of the epidemics after treatment
How does the structure of the population affect the dynamics of the epidemic as compared with a homogeneously mixed model? To answer this question, and for the sake of simplicity, we use the epidemic's peak time and value (i.e. the maximal instantaneous number of infected individuals in the whole population) to characterize the dynamics of the epidemic.
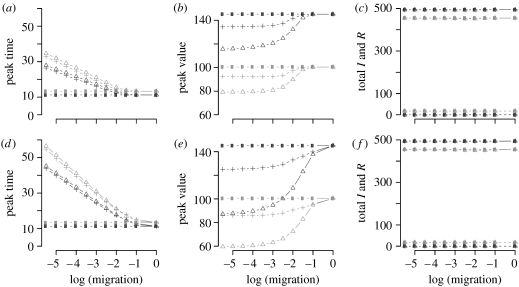
Figure 4 shows dynamical and final features of the epidemic for different population structures. For a larger population of 5000 individuals, figure 4 does not change. This is due to rescaling of the transmission rates such that the basic reproductive number remains the same (equation A 9). Figure 4a,b,d,e shows that the epidemic peak decreases and occurs later with decreasing migration rates. This means that the epidemic is less explosive in a fragmented population than in a homogeneous population. Treatment slows down the epidemics and reduces its peak. As expected, the level and the timing of the peak converge to the homogeneous mixing case for high migration rates.
Figure 4.
Impact of population structure and of public health interventions on the dynamics and final outcome of the epidemic. Structures: island (a–c), spider (d–f); interventions: no drugs (dark grey), treatment (grey); number of subpopulations: 1 (circle), 5 (triangle) and 15 (cross). The total size of the populations is N=500. (a) Time of the epidemic's peak as a function of migration, in days. (b) Value of this peak. (c) The total number of infected and resistant cases. Note that the results of the prophylaxis intervention are not shown here because they depend strongly on the number of subpopulations and the migration coefficient.
Some results in figure 4 might appear counterintuitive: the peak time and value with 15 subpopulations (crosses) are between the values for 1 (circles) and 5 (triangles) subpopulations. As discussed later in §3, when the population is subdivided into more than one subpopulation connected according to the island model, there are two peaks, corresponding to epidemics in the focal subpopulation (first peak) and later in the peripheral subpopulations (second peak). The second peak in a model with a fragmented population is generally smaller than the only peak in a model with a homogeneous population because the total number of susceptible individuals in the peripheral subpopulations is smaller than that of the total population. This explains why the peak value in the non-fragmented population is highest. With increased numbers of subpopulations, however, the total number of susceptible individuals in the peripheral subpopulations increases. That is why the peak value is higher for 15 subpopulations than for 5 (figure 4b,e). The results with regard to the time of the peak can be explained as follows: in a single subpopulation, the speed of the epidemic decreases with its size. Hence, if the population is more fragmented the epidemics spread faster in each subpopulation. This accounts for the result concerning the peak time (figure 4a,d).
The fragmentation of the population, however, has no impact on the final outcome of the epidemic, in terms of the total number of infected and resistant cases (figure 4c,f). This is due to the fact that the total numbers of infected (I) and resistant (R) cases solely depend on the basic reproductive number, R0, of each strain, which is independent of the migration rate. Without drugs almost everyone (98.8%) gets infected. Treatment slightly decreases this value to 91%. Nevertheless, treatment also allows the emergence of resistant cases, which represent 3.8% of the infected cases.
These results raise the following questions: can prophylaxis more efficiently decrease the total number of infected cases? Does it lead to more resistance than treatment? And lastly, when should prophylaxis be performed?
3.1.2 Prophylaxis: the impact of timing
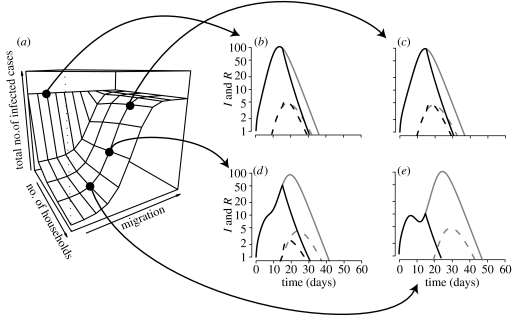
The total number of infected and resistant cases during the epidemic is lower when prophylaxis is performed (figure 5). The results are similar with a bigger population size. Unlike with treatment, the outcome of prophylaxis depends on the structure of the population. The higher the degree of fragmentation of the host population is, the fewer is the number of people getting infected during the epidemic (figure 5a). For instance, with our parameters, and with proph.start=15 (where proph.start denotes the time at which prophylaxis is initiated), 80% of the population finally gets infected during the epidemic in a homogeneously mixing population, while only 5% gets infected when the number of subpopulations is high or the migration is low. In both cases, around 4% of infected people shed resistant viruses. This is due to the shape of the epidemic curve: the higher the degree of fragmentation, the more peaks there are. Note that there are at most two peaks with an island shape: the first peak corresponds to the focal subpopulation, where the epidemic starts, and the second peak to all the other subpopulations, which are directly linked to the focal one. Note also that if the mean distance to the focal subpopulation is greater than 1 (e.g. with the spider shape, data not shown), there are more than two peaks. The state of the epidemic at which it is ‘hit’ by prophylaxis (peak or trough, figure 5b–e) depends on the structure of the population. After prophylaxis is initiated both and become abruptly less than 1, and the epidemic wanes, because both resistant and sensitive variants cannot sustain the epidemic anymore.
Figure 5.
(a) The total number of infected cases as a function of the structure of the population. (b–e) Time course for selected points. The population is island-shaped, its total size being N=500 individuals, and prophylaxis starts on day 15. (b) A homogeneous population. (c–e) Fifteen subpopulations. The migration coefficient is 10−2, 10−3 and 10−4 in (c), (d) and (e), respectively. (b–e) The population mixes less and less homogeneously. Grey, treatment; black, prophylaxis. Solid line, infected cases; dashed line, resistant cases.
Owing to the fact that the structure of the population influences at which state the epidemic is hit by prophylaxis, the timing of prophylaxis has an impact on resistance emergence (figure 6). The earlier the prophylaxis is initiated, the fewer are the infected and resistant cases during the epidemic and the greater the proportion of infected people shedding resistant viruses. The fact that when everybody receives drugs accounts for this higher proportion of resistance when proph.start is smaller. Even though unable to trigger a real epidemic, the resistant variant outcompetes the sensitive one. We also determined the proportion of transmitted resistance versus de novo resistance. This proportion is substantially higher when proph.start is small, again because sensitive variants are outcompeted earlier.
Figure 6.
Impact of the timing of prophylaxis compared to treatment (a) on the proportion of resistance and (b) on the total number of infected and resistant cases. There are 10 subpopulations, the total size of the population being N=500 individuals, and migration=10−3. Grey, treatment; black, prophylaxis. Solid line, infected cases; dashed line, resistant cases; dot-dashed line, proportion of resistant cases among the infected.
3.2 Stochastic model
3.2.1 The impact of population structure
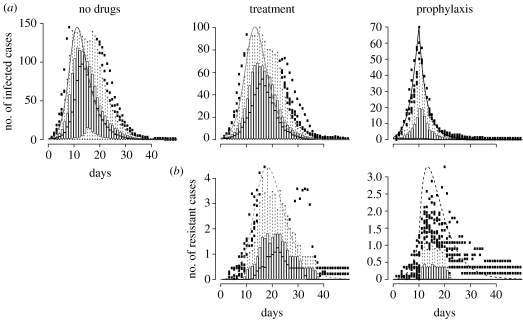
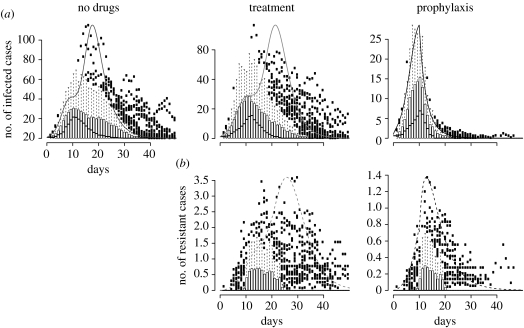
Even in homogeneous populations, stochastic simulations differ from deterministic ones in some respects. First, around 40% of the simulations did not generate any secondary case (the first infected is an I, asymptomatic, non-treated, shedding sensitive viruses). Then, due to local extinctions, the stochastic model predicts fewer infected cases on average than the deterministic model (figures 7 and 8). Furthermore, the total number of infected people during the epidemic is lower in the stochastic than in the deterministic model (e.g. approximately 80% of the population compared with 98.8% with the deterministic version).
Figure 7.
A comparison between deterministic and stochastic versions of the model without population structure. We assumed only one population of 500 individuals, and that prophylaxis starts on day 10. The smooth curve is the prediction of the deterministic model, and the box and whiskers plots summarize realizations of the stochastic model (we show here only the realizations in which there was at least one secondary case among the 100 runs). (a) Infected cases over time. (b) Resistant cases over time.
Figure 8.
A comparison between deterministic and stochastic versions of the model with population structure. There are four subpopulations, the total size of the population being N=500, the migration rate is 10−3, and prophylaxis starts on day 10. The smooth curve is the prediction of the deterministic model, and the box and whiskers plots summarize realizations of the stochastic model (again we show here only the realizations in which there was at least one secondary case among the 100 runs). (a) Infected cases over time. (b) Resistant cases over time. Note that with population structure the difference between stochastic and deterministic simulations is mainly due to the stochasticity of migration.
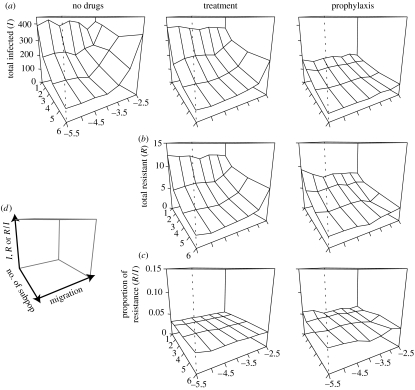
Unlike the deterministic model, the structure of the population has an impact on the outcome of the epidemic even without drugs or under treatment (figure 9). The higher the degree of fragmentation of the host population, the less the infection spreads. When the number of subpopulations is high, or when migration between subpopulations is low, the epidemic is often restricted to a small number of subpopulations (most of the time to only the one where the epidemic started). Comparing the effect of different interventions, we find that treatment does not substantially reduce the total number of infected cases, but leads to the emergence of resistance (figure 9). On the other hand, as in the deterministic model, prophylaxis has a strong impact on the total number of resistant cases. We also find that the proportion of resistant cases among infected people is higher with prophylaxis (between 3 and 6% when proph.start=10). This result is, as in the deterministic case, due to the change of the basic reproductive numbers when different interventions are performed.
Figure 9.
Impact of population structure on the total number of (a) infected and (b) resistant cases, and on (c) the proportion of resistance, for each of the three interventions. The total size of the population is N=500 and prophylaxis starts on day 10. The legends of the axes are on (d).
3.2.2 Prophylaxis: impact of timing
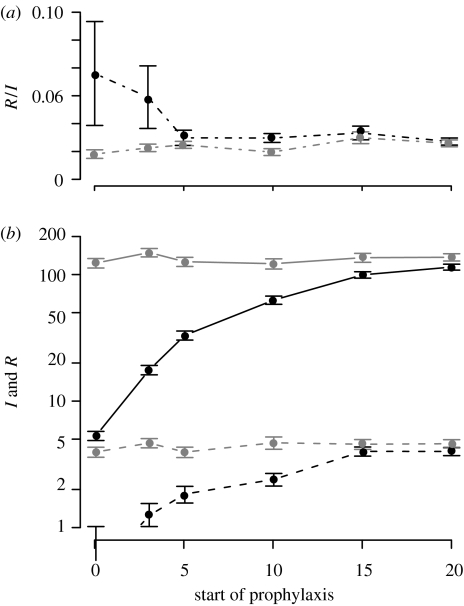
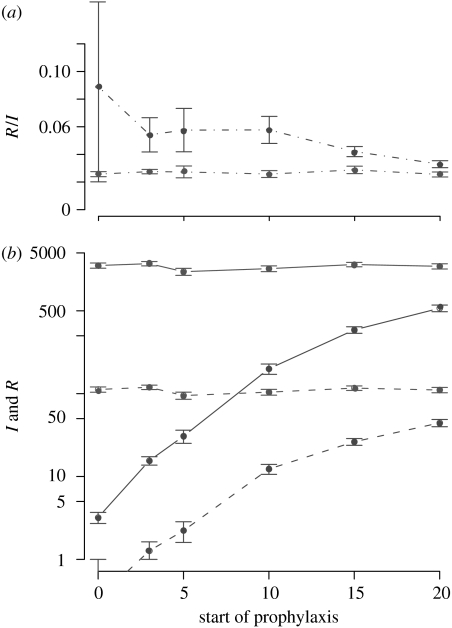
In spite of the variance in the prediction due to stochasticity, the impact of prophylaxis timing is qualitatively the same as in the deterministic model. The earlier prophylaxis starts, the smaller is the number of infected and resistant people during the epidemic (figure 10). For a larger population of N=5000 we obtain very similar results (see figure 13 in appendix A).
Figure 10.
Impact of the timing of prophylaxis compared to treatment (a) on the proportion of resistance and (b) on the total number of infected and resistant cases. The dots represent the mean value of simulations having generated at least one secondary case, among 100 simulations. Error bars represent standard errors. There are four subpopulations, the total size of the population is N=500 and migration=10−3. Grey, treatment; black, prophylaxis. Solid line, infected cases; dashed line, resistant cases; dot-dashed line, proportion of resistant cases among the infected; mean±s.e.
Figure 13.
Same figure as figure 10, but with a total population size N=5000. Impact of the timing of prophylaxis compared to treatment (a) on the proportion of resistance and (b) on the total number of infected and resistant cases. The dots represent the mean value of simulations having generated at least one secondary case, among 100 simulations. Error bars represent standard errors. There are four subpopulations, the total size of the population is N=5000 and migration=10−3. Grey, treatment; black, prophylaxis. Solid line, infected cases; dashed line, resistant cases; dot-dashed line, proportion of resistant cases among the infected; mean±s.e.
The result concerning the proportion of resistant cases is less clear in the stochastic model. Although, as in the deterministic model, the mean number of resistant cases is higher for prophylaxis starting early, the variance is also higher. In some simulations, the proportion of resistance is very low (for instance R : I=0 : 10 in one simulation), while it is very high in some others (R : I=6 : 9 in another). Moreover, among simulations that led to the emergence of resistance, the proportion of transmitted resistant strains decreases with the timing of prophylaxis: approximately 30% of transmitted resistance when prophylaxis starts at day 0, approximately 20% at day 5, but less than 5% at day 20 (data not shown). Note that there is almost no transmitted resistance when treatment is performed. In brief, if resistance appears when prophylaxis starts early, resistant strains are more likely to be transmitted than if prophylaxis is initiated later.
4. Discussion and conclusion
The planned, widespread use of NAI for treatment and prophylaxis during influenza pandemics is likely to lead to the emergence of drug-resistant influenza strains. In this study, we investigated the effect of population structure on the emergence of drug resistance during pandemics using mathematical models. To this end, we constructed deterministic and stochastic metapopulation models describing the spread of pandemic influenza strains.
We show that epidemic outbreaks in fragmented populations are less explosive. In a deterministic model, however, the fragmentation of the population has no influence on the final level of drug resistance in the population when nothing is done or when drugs are given to symptomatic individuals. In contrast, when antivirals are delivered prophylactically to non-symptomatic individuals in addition to treating symptomatic individuals, population structure and the timing of prophylaxis interact synergistically in resistance development and influence the proportion of resistance due to the transmission of resistant variants.
The results of the stochastic model are different in some respects. First, 40% of the epidemics go extinct very rapidly. Moreover, when the epidemic does not go extinct, the number of infected and resistant cases is still lower than in the deterministic model. This is due to an interaction of stochasticity and migration. In addition, the final level of resistance after treatment only is affected by the structure of the population, and not by stochasticity.
This study should be considered as a conceptual work, aiming to study qualitative trends, rather than to make quantitative predictions. Even though many of our model parameters are based on published studies on influenza (see Regoes & Bonhoeffer (2006) for a justification of the parameters), the topological features and parameters describing the structure of the population are unrealistic. However, the main aim of our paper was to study the effect of population fragmentation in isolation, rather than predict the level of resistance for a realistically structured population. To this end, we extended one of the simplest published influenza models (Stilianakis et al. 1998) into one which allowed for varying degrees of population fragmentation. This conceptual study has its justification because it allows us to extrapolate the predictions of simple models—assuming homogeneously mixed host populations and deterministic dynamics—to situations in which spatial population structure and stochasticity are important. To make this model more realistic, one could analyse more realistic network topologies and population structures. Additionally, one could also include aspects of the within-host dynamics of influenza infection and age structure, in particular because some key parameters of influenza epidemics vary with age (Ferguson et al. 2003; Doherty et al. 2006).
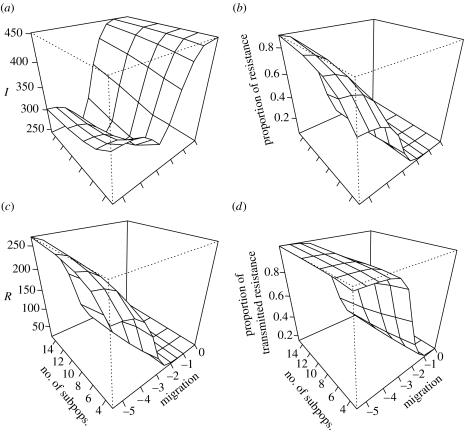
In spite of the lack of realism of the population structure in our model, our conclusions are similar to the ones made using very detailed models of pandemic influenza. Ferguson et al. (2005, 2006), Longini et al. (2005) and Germann et al. (2006) show that targeted antiviral prophylaxis is the best medical intervention, and that if R0 is high, a combination of medical and non-medical interventions (such as social distancing) have to be adopted to mitigate the pandemic. Considering social distancing as a measure that increases population fragmentation, we show that prophylaxis is the best intervention and that its effects are increased by population fragmentation (figures 5 and 9). Lipsitch et al. (2007) also studied the emergence of resistance, albeit without incorporating any spatial structure of the population. One of their key results is that resistance levels are higher when non-drug interventions are adopted. Hereby, they modelled non-drug interventions by simply reducing the basic reproduction number R0 of the pandemic strain. In our model, we can model non-drug interventions, such as social distancing or quarantine, by increasing the population fragmentation. In a more fragmented population, similar to Lipsitch et al. (2007), we observe that the prevalence of resistance is reduced, while the proportion of resistance increases (figure 11). This is due to the fact that in a fragmented population the epidemic spreads slower and prophylaxis hits the epidemic during an earlier state (figure 5c–e).
Figure 11.
Impact of population fragmentation on the emergence of resistance, when prophylaxis is performed. Prophylaxis starts on day 5, island structure. N=500.(a) Effect on the total number of resistant cases. (b) Effect on the proportion of resistant cases among total infected cases. (c) Effect on the proportion of resistant cases due to transmission of the resistant strain, among total resistant cases.
Only few studies on the containment or mitigation of an influenza pandemic investigate the emergence of resistant viruses, but most authors acknowledge the challenge that the emergence of resistant viruses represents (Ferguson et al. 2005, 2006; Germann et al. 2006). We hope that the potential emergence of drug resistance will be incorporated into more mathematical studies (especially the very detailed ones) so that we can face up to this challenge.
Appendix A. Deterministic model: equations
A.1 Dynamics without drugs
Without any public health intervention, the course of the disease is modelled by using an SIISR model, which has been extended to a metapopulation
| (A1) |
where for each class C, and Ci refers to the number of individuals of this class present in subpopulation i, 1≤i≤n. Refer to table 2 for the description of the variables and table 3 for the values of the parameters. As defined in the main text, the migration parameter is
| (A2) |
Table 2.
Variables of the models.
| variable | no. of …individuals |
|---|---|
| S | susceptible |
| Spr | susceptible, receiving chemoprophylaxis |
| I | infected, untreated, asymptomatic |
| Is | infected, untreated, symptomatic |
| Ir | infected, untreated, asymptomatic, shedding resistant virus |
| Is,r | infected, untreated, symptomatic, shedding resistant virus |
| Itr | infected, treated, asymptomatic |
| Is,tr | infected, treated, symptomatic |
| Ir,tr | infected, treated, asymptomatic, shedding resistant virus |
| Is,r,tr | infected, treated, symptomatic, shedding resistant virus |
Table 3.
Parameters of the models. (Refer to Regoes & Bonhoeffer (2006) for justification of the chosen values, as well as Stilianakis et al. (1998).)
| parameter | description | value |
|---|---|---|
| β1β2 | transmission rate between I and Stransmission rate between Is and S |
 scaled such that =4.5 scaled such that =4.5 |
| β1,rβ2,r | transmission rate between Ir and Stransmission rate between Is,r and S |
 scaled such that =0.45 scaled such that =0.45 |
| K2,1 | relative infectivity of Is and Is,r (compared to I and Ir respectively) | 10 |
| p1 | relative infectivity of Itr (compared to I) | 0.67 |
| p2 | relative infectivity of Is,tr (compared to Is) | 0.67 |
| p3 | relative susceptibility of Spr to infection with I (compared to S) | 0.5 |
| p4 | relative susceptibility of Spr to infection with Is (compared to S) | 0.5 |
| p5 | relative susceptibility of Spr to infection with Itr (compared to S) | 0.5×0.67 |
| p6 | relative susceptibility of Spr to infection with Is,tr (compared to S) | 0.5×0.67 |
| δ1 | rate of development of symptoms by I | 0.5 d−1 |
| δ2 | rate of development of symptoms by Ir | 0.5 d−1 |
| δ3 | rate of development of symptoms by Itr | 0.1 d−1 |
| δ4 | rate of development of symptoms by Ir,tr | 0.5 d−1 |
| θ1 | rate of chemoprophylaxis of S | 0 d−1 |
| θ2 | rate of chemoprophylaxis of I and Ir | 0 d−1 |
| θ3 | rate of treatment of Is and Is,r | 0.7 d−1 |
| γ1 | recovery rate from asymptomatic infection | 0.5 d−1 |
| γ2 | recovery rate from symptomatic infection | 0.25 d−1 |
| r1 | relative recovery of Itr compared to I | 2 |
| r2 | relative recovery of Is,tr compared to Is | 1.5 |
| q1κ | rate of acquired drug resistance in Itr | 0.036 d−1 |
| q2κ | rate of acquired drug resistance in Is,tr | 0.036 d−1 |
The total number of individuals in the population, N, is constant, because no demographic process is considered. Then, always, S+I+IS+R=N. This is the reason why the equations for the recovered class R are not written here.
A.2 Dynamics with intervention
When treatment or prophylaxis is performed, the equations describing the course of the disease are the following:
| (A3) |
A.3 Total numbers of infected and resistant cases
We calculate the total number of infected cases generated during the epidemic
| (A4) |
where .
We also determine the total number of individuals having shed resistant viruses during the epidemic (i.e. total number of resistant cases)
| (A5) |
where
| (A6) |
| (A7) |
The proportion of resistance is , and the proportion of de novo resistance is .
Appendix B. Calculation of the basic reproductive numbers
To calculate the basic reproductive numbers of the sensitive and resistant strains in our deterministic models of influenza epidemics we used the so-called next-generation method described by Heffernan et al. (2005). Since the basic reproductive numbers depend on the intervention, we deal with the three interventions separately.
B.1 R0 without intervention
The I and IS classes are infected classes. The disease-free equilibrium corresponds to X0={S0, 0, 0}. Given the equations of the model (A 1),
V is invertible, because it is triangular, and
The characteristic equation associated to FV−1 is
and hence the basic reproductive number R0 has the form
| (B1) |
Note that this formula can be obtained in a more straightforward way: the stable state approximation at the disease-free equilibrium can be used to simplify the system. With ,
Then,
which leads to the same formula for R0 as previously.
B.1.1 Consequence: R0 and the βs
In the metapopulation model, we scale the βs in order to keep the same R0 in all the subpopulations, irrespective of their size. With K2,1=β2/β1, according to (A 8),
| (B2) |
Scaling the βs amounts to writing the ODEs in the form dI/dt=−βSI/N… (frequency-dependant versus density-dependant previously).
B.2 R0 in a treated population
In the full model (A 3), two different strains, the drug-sensitive one and the drug-resistant one, have to be considered. Castillo-Chavez et al. (2002) show how to extend the next generation method to a model with different strains. The same results are obtained when the method is applied to the full model, or when it is only applied to relevant equations. For the sake of brevity, only this second method is shown here.
The relevant classes here are S,I,Is,Ir,Is,r,Is,tr,Is,r,tr, because treatment is only given to symptomatically infected people. The disease-free equilibrium is X0={S0, 0, 0, 0, 0}.
Applying the next generation method to the infected compartment, the following matrices are obtained:
After having determined the non-null eigenvalues of FV−1, we obtain, with θ1=θ2=0,
and
| (B3) |
With our range of parameters, . Treatment indeed lowers the infectivity.
B.3 R0 in a prophylaxed population
The relevant classes here are Spr,Itr,Is,tr,Ir,tr,Is,r,tr, because everybody in the population gets either treatment (if symptomatically infected) or prophylaxis (otherwise). The disease-free equilibrium is X0={S0, 0, 0, 0, 0}.
The following matrices are obtained:
After having determined the non-null eigenvalues of FV−1, we obtain, with θ1=θ2=0,
| (B4) |
B.4 R0 in the metapopulation
The next generation method yields the same results in a metapopulation as in a single population (provided that the βs are scaled, equation (A 9)). Calculations are done with an island-shape metapopulation, where all subpopulations have the same size. Moreover, an epidemic generates the same number of infections in a metapopulation as in a single population of the same total size (figure 4 in the main text), which confirms our result.
Appendix C. Relaxing some parameters
C.1 Deterministic simulations with a higher
In the main text of our article, we assumed a high fitness cost of the resistant strain and set . This value may be too low to describe resistant strain during a pandemic because compensatory mutations could restore the fitness of the resistant virus.
To assess the robustness of our results with regard to our choice of we conducted a simulation with higher values of . Figure 12 shows simulations performed with . The simulations in this figure are done with exactly the same parameters as figure 11, except that .
Figure 12.
Impact of population fragmentation on the emergence of resistance, when prophylaxis is performed and when . Prophylaxis starts on day 5, island structure. N=500. (a) Effect on the total number of infected cases. (b) Effect on the total number of resistant cases. (c) Effect on the proportion of resistant cases among total infected cases. (d) Effect on the proportion of resistant cases due to transmission of the resistant strain, among total resistant cases.
For , we obtain similar prevalences and levels of resistance as for (compare figure 12b–d with figure 11a–c). The values are higher in figure 12 because is higher and above 1 (the resistant strain can sustain an epidemic by itself now).
The results for the total number of infections (figure 12a) differ. The prevalence increases when the population is highly fragmented. This is due to the fact that the resistant strain with cannot be controlled by prophylaxis anymore, and in fragmented populations prophylaxis hits the epidemic during an earlier stage. In a fragmented population, therefore, more susceptible hosts remain to be infected by the resistant strain.
C.2 Stochastic simulations with a greater population size
We also investigated the impact of larger population sizes on our stochastic simulations. In figure 13 we used the same parameters as in figure 10, except that we set the total population size N=5000 instead of N=500 as in the main text. For N=5000, we obtain similar results to those with N=500: as expected, the total number of infected (I) and resistant (R) hosts is higher, but the prevalences (I/R and R/N) are the same. The proportion of resistance and the impact of proph.start are also similar.
Footnotes
One contribution of 20 to a Theme Issue ‘Cross-scale influences on epidemiological dynamics: from genes to ecosystems’.
References
- Anderson R.M, May R.M. Oxford University Press; Oxford, UK: 1991. Infectious diseases of humans. [Google Scholar]
- Bright R, Shay D, Shu B, Cox N, Klimov A. Adamantane resistance among influenza a viruses isolated early during the 2005–2006 influenza season in the United States. JAMA. 2006;295:891–894. doi: 10.1001/jama.295.8.joc60020. [DOI] [PubMed] [Google Scholar]
- Castillo-Chavez C, Feng Z, Huang W. On the computation R0 and its role on global stability. In: Castillo-Chavez C, van den Driessche P, Kirschner D, Yakubu A.-A, editors. Mathematical approaches for emerging and reemerging infectious diseases: an introduction. Springer; Reading, MA: 2002. pp. 229–250. [Google Scholar]
- de Jong M.D, et al. Brief report—Oseltamivir resistance during treatment of influenza A (H5N1) infection. N. Engl. J. Med. 2005;353:2667–2672. doi: 10.1056/NEJMoa054512. [DOI] [PubMed] [Google Scholar]
- Diekmann O, Heesterbeek J, Metz J. On the definition and the computation of the basic reproduction ratio R0 in models for infectious-diseases in heterogeneous populations. J. Math. Biol. 1990;28:365–382. doi: 10.1007/BF00178324. [DOI] [PubMed] [Google Scholar]
- Doherty P.C, Turner S.J, Webby R.G, Thomas P.G. Influenza and the challenge for immunology. Nat. Immunol. 2006;7:449–455. doi: 10.1038/ni1343. [DOI] [PubMed] [Google Scholar]
- Ferguson N, Mallett S, Jackson H, Roberts N, Ward P. A population-dynamic model for evaluating the potential spread of drug-resistant influenza virus infections during community-based use of antivirals. J. Antimicrob. Chemother. 2003;51:977–990. doi: 10.1093/jac/dkg136. [DOI] [PubMed] [Google Scholar]
- Ferguson N, Cummings D, Cauchemez S, Fraser C, Riley S, Meeyai A, Iamsirithaworn S, Burke D. Strategies for containing an emerging influenza pandemic in Southeast Asia. Nature. 2005;437:209–214. doi: 10.1038/nature04017. [DOI] [PubMed] [Google Scholar]
- Ferguson, N. M., Cummings, D. A. T., Fraser, C., Cajka, J. C., Cooley, P. C. & Burke, D. S. 2006 Strategies for mitigating an influenza pandemic. Nature advanced online publication. ( 10.1038/nature04795) [DOI] [PMC free article] [PubMed]
- Germann T.C, Kadau K, Longini I.M, Macken C.A. Mitigation strategies for pandemic influenza in the United States. Proc. Natl Acad. Sci. USA. 2006;103:5935–5940. doi: 10.1073/pnas.0601266103. [DOI] [PMC free article] [PubMed] [Google Scholar]
- Gillespie D. General method for numerically simulating stochastic time evolution of coupled chemical-reactions. J. Comput. Phys. 1976;22:403–434. doi: 10.1016/0021-9991(76)90041-3. [DOI] [Google Scholar]
- Grenfell B, Harwood J. (Meta)population dynamics of infectious diseases. Trends Ecol. Evol. 1997;12:395–399. doi: 10.1016/S0169-5347(97)01174-9. [DOI] [PubMed] [Google Scholar]
- Gubareva L.V, Kaiser L, Matrosovich M.N, Soo-Hoo Y, Hayden F.G. Selection of influenza virus mutants in experimentally infected volunteers treated with oseltamivir. J. Infect. Dis. 2001;183:523–531. doi: 10.1086/318537. [DOI] [PubMed] [Google Scholar]
- Heffernan J, Smith R, Wahl L. Perspectives on the basic reproductive ratio. J. R. Soc. Interface. 2005;2:281–293. doi: 10.1098/rsif.2005.0042. [DOI] [PMC free article] [PubMed] [Google Scholar]
- Herlocher M.L, Carr J, Ives J, Elias S, Truscon R, Roberts N, Monto A.S. Influenza virus carrying an r292k mutation in the neuraminidase gene is not transmitted in ferrets. Antivir. Res. 2002;54:99–111. doi: 10.1016/S0166-3542(01)00214-5. [DOI] [PubMed] [Google Scholar]
- Herlocher M.L, Truscon R, Elias S, Yen H.L, Roberts N.A, Ohmit S.E, Monto A.S. Influenza viruses resistant to the antiviral drug oseltamivir: trans mission studies in ferrets. J. Infect. Dis. 2004;190:1627–1630. doi: 10.1086/424572. [DOI] [PubMed] [Google Scholar]
- Hess G. Disease in metapopulation models: implications for conservation. Ecology. 1996;77:1617–1632. doi: 10.2307/2265556. [DOI] [Google Scholar]
- Hess G, Randolph S, Arneberg P, Chemini C, Furlanello C, Harwood J, Roberts M, Swinton J. Oxford University Press; Oxford, UK: 2002. The ecology of wildlife diseases. Ch. Spatial aspects of disease dynamics, pp. 102–118. [Google Scholar]
- Heymann D.L. Resistance to anti-infective drugs and the threat to public health. Cell. 2006;124:671–675. doi: 10.1016/j.cell.2006.02.009. [DOI] [PubMed] [Google Scholar]
- Hufnagel L, Brockmann D, Geisel T. Forecast and control of epidemics in a globalized world. Proc. Natl Acad. Sci. USA. 2004;101:15 124–15 129. doi: 10.1073/pnas.0308344101. [DOI] [PMC free article] [PubMed] [Google Scholar]
- Kermack W.O, McKendrick A.G. A contribution to the mathematical theory of epidemics. Proc. R. Soc. A. 1927;115:700–721. doi: 10.1098/rspa.1927.0118. [DOI] [Google Scholar]
- Kiso M, Mitamura K, Sakai-Tagawa Y, Shiraishi K, Kawakami C, Kimura K, Hayden F, Sugaya N, Kawaoka Y. Resistant influenza A viruses in children treated with oseltarnivir: descriptive study. Lancet. 2004;364:759–765. doi: 10.1016/S0140-6736(04)16934-1. [DOI] [PubMed] [Google Scholar]
- Lipsitch M, Cohen T, Murray M, Levin B.R. Antiviral resistance and the control of pandemic influenza. PLoS Med. 2007;4:e15. doi: 10.1371/journal.pmed.0040015. [DOI] [PMC free article] [PubMed] [Google Scholar]
- Longini I, Nizam A, Xu S, Ungchusak K, Hanshaoworakul W, Cummings D, Halloran M. Containing pandemic influenza at the source. Science. 2005;309:1083–1087. doi: 10.1126/science.1115717. [DOI] [PubMed] [Google Scholar]
- Mills C.E, Robins J.M, Lipsitch M. Transmissibility of 1918 pandemic influenza. Nature. 2004;432:904–906. doi: 10.1038/nature03063. [DOI] [PMC free article] [PubMed] [Google Scholar]
- Moscona A. Dec Oseltamivir resistance—disabling our influenza defenses. N. Engl. J. Med. 2005;353:2633–2636. doi: 10.1056/NEJMp058291. [DOI] [PubMed] [Google Scholar]
- R Development Core Team, 2005. R: a language and environment for statistical computing. R Foundation for Statistical Computing, Vienna, Austria. See http://www.R-project.org.
- Regoes R, Bonhoeffer S. Emergence of drug-resistant influenza virus: population dynamical considerations. Science. 2006;312:389–391. doi: 10.1126/science.1122947. [DOI] [PubMed] [Google Scholar]
- Setzer, R. W. 2005 Odesolve: solvers for ordinary differential equations. R package version 0.5–13.
- Smith D.J. Applications of bioinformatics and computational biology to influenza surveillance and vaccine strain selection. Vaccine. 2003;21:1758–1761. doi: 10.1016/S0264-410X(03)00068-9. [DOI] [PubMed] [Google Scholar]
- Stilianakis N.I, Perelson A.S, Hayden F.G. Emergence of drug resistance during an influenza epidemic: insights from a mathematical model. J. Infect. Dis. 1998;177:863–873. doi: 10.1086/515246. [DOI] [PubMed] [Google Scholar]
- Stiver G. The treatment of influenza with antiviral drugs. CMAJ. 2003;168:49–57. [PMC free article] [PubMed] [Google Scholar]
- Webby R, Webster R. Are we ready for pandemic influenza? Science. 2003;302:1519–1522. doi: 10.1126/science.1090350. [DOI] [PubMed] [Google Scholar]
- Yen H.L, Herlocher L.M, Hoffmann E, Matrosovich M.N, Monto A.S, Webster R.G, Govorkova E.A. Neuraminidase inhibitor-resistant influenza viruses may differ substantially in fitness and transmissibility. Antimicrob. Agents Chemother. 2005;49:4075–4084. doi: 10.1128/AAC.49.10.4075-4084.2005. [DOI] [PMC free article] [PubMed] [Google Scholar]


