Hen egg-white lysozyme was crystallized over a wide pH range (2.5–8.0) and the quality of the crystals was characterized. Crystallization phase diagrams at pH 2.5, 6.0 and 7.5 were determined
Keywords: neutron diffraction, crystallization phase diagram, pH titration, lysozyme, quality of crystal
Abstract
To observe the ionized status of the amino acid residues in proteins at different pH (protein pH titration in the crystalline state) by neutron diffraction, hen egg-white lysozyme was crystallized over a wide pH range (2.5–8.0). Crystallization phase diagrams at pH 2.5, 6.0 and 7.5 were determined. At pH < 4.5 the border between the metastable region and the nucleation region shifted to the left (lower precipitant concentration) in the phase diagram, and at pH > 4.5 the border shifted to the right (higher precipitant concentration). The qualities of these crystals were characterized using the Wilson plot method. The qualities of all crystals at different pH were more or less equivalent (B-factor values within 25–40). It is expected that neutron diffraction analysis of these crystals of different pH provides equivalent data in quality for discussions of protein pH titration in the crystalline state of hen egg-white lysozyme.
1. Introduction
The charges of various amino acid side chains depend on the pH. For example, at a high pH (low acidity conditions), carboxylic acids tend to be negatively charged (deprotonated) and amines tend to be uncharged (unprotonated). At a low pH (high acidity), the opposite is true. The pH at which exactly half of any ionized amino acid is charged is called the pK a of that amino acid. These pK a values of such ionizable amino acid side chains are tabulated in standard textbooks. However, whether a certain amino acid side chain in a protein is charged or not cannot be estimated from a standard pH value measured from protein solution because it may vary significantly depending on the local environment surrounding the particular amino acid residue. The electrically charged states of the amino acid residues are very important in understanding the physiological function of the protein, the interaction between ligand and protein, molecular recognition, structural stability and so on.
It is very informative to determine the ionization states of different amino acid residues in proteins at different pH using a single-crystal neutron diffraction technique (Niimura et al., 2006 ▶), i.e. protein pH titration in the crystalline state. Neutron protein crystallography requires a large protein single crystal; hen egg-white lysozyme (HEWL) in the tetragonal state is a good candidate for protein pH titration in the crystalline state because the method of growing a large single crystal of tetragonal HEWL is well known. Neutron protein crystallography of HEWL at several pH values has been reported in order to understand the pH dependence of the hydrolysis rate of HEWL (Niimura et al., 1997 ▶; Maeda et al., 2001 ▶; Bon et al., 1999 ▶), predicted by Jones et al. (1984 ▶).
One of the highest barriers to neutron protein crystallography experiments is the supply of large single crystals. Single crystals larger than at least 1 mm3 are necessary for neutron diffraction experiments because of the weak incident neutron beams. Crystallization phase diagrams are very helpful when growing large single crystals. Phase diagrams are divided into three regions. The solubility curve divides the phase diagram into undersaturation and supersaturated regions. In the undersaturation region, crystal dissolution occurs. In the nucleation region, both nucleation and crystal growth occur, but there is a border where nucleation occurs and below the border (metastable region) nucleation does not occur but the crystal grows when a seed crystal exists. As a result, proteins in the metastable region are concentrated to only the seed crystal and it grows large. Therefore, a wider metastable region is useful for obtaining large single crystals.
The pH dependences of the solubility of the tetragonal form of HEWL from 4.0 to 7.5 (Howard et al., 1988 ▶) and from 4.0 to 5.4 (Cacioppo & Pusey, 1991 ▶) have already been reported. However, the borderline between the metastable region and the nucleation region in the supersaturated region has not been reported. In this paper the crystallization, the simple crystallization phase diagram and the evaluation of HEWL crystals over a wide pH range (2.5–8.0) are reported, and our results are compared with results in the literature.
2. Materials and methods
2.1. Preliminary crystallization over a wide pH range
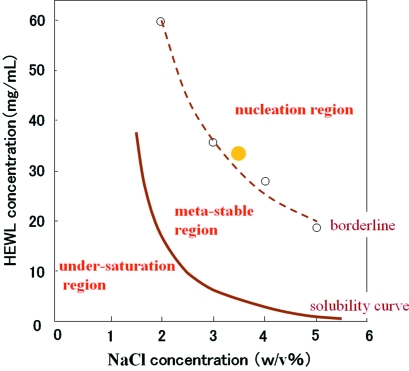
HEWL was purchased from Seikagaku Co., and crystallization over a wide pH range from 2.5 to 8.0 in 0.5 steps was carried out as follows: HEWL was crystallized in a buffer of 50 mM NaH2PO4, 33.5 mg ml−1 protein concentration, 3.5 w/v% NaCl as the crystallization agent and at a temperature of 293 K at each pH by batch method. These conditions are indicated by the filled yellow circle in the crystallization phase diagram shown in Fig. 1 ▶, and this condition was fixed in the following preliminary crystallization experiment over a wide pH range. The pH values of solutions at pH 2.5–4.5 and at pH 5.0–8.0 were adjusted in 50 mM NaH2PO4 buffer with H3PO4 and with Na2HPO4, respectively, in order to prepare solutions over a wide pH range. Crystallization at pH 2.5–6.5 was carried out in the designed pH solution directly. Crystals did not appear beyond pH 7.0 and therefore crystals at pH 7.0–8.0 were prepared by soaking crystals (initially grown at pH 5.5) in a designed pH solution in the metastable region.
Figure 1.
Crystallization phase diagram of HEWL at pH 4.5 and at 293 K. Circles show the experimental data. The solid line is the solubility curve and the broken line is the borderline, as guides for the eye.
2.2. Determination of the crystallization phase diagram at different pH values
Crystallization phase diagrams of HEWL at pH 2.5, 6.0 and 7.5 were determined independently by the dialysis method. A crystal was grown by dialysis using a 50 µl micro-dialysis button and membrane with a molecular weight cut-off of 1000 Da.
Firstly, the borderline between the metastable region and the nucleation region was determined as follows. The concentration of crystallization agent (Cc) was increased step by step. Each incremental step was 0.1 w/v% and the protein solution in the button was kept for eight days at 293 K, upon which it was noted whether or not crystallization had occurred. When a crystal appeared to be observed, a point (Cc, Cp) was marked on the phase diagram, whereas if a crystal was absent the concentration of Cc was increased by one more step, +0.1 w/v%. This procedure was continued until crystallization occurred in all the protein solutions. The borderline between the metastable region and nucleation region in the supersaturated region was formed by connecting these points (Cc, Cp) obtained at different Cp.
Secondly, the solubility curve was determined by dissolving crystals in the button as follows. The Cc (concentration of precipitant) was decreased step by step (by 0.1 w/v% per day), and the protein solution was kept under this condition for one day and it was observed whether or not crystals completely dissolved. When the crystals were completely dissolved, a point (Cc, Cp) was marked on the phase diagram, whereas if crystals still remained the precipitant concentration (Cc) was decreased by one more step, −0.1 w/v%. This procedure was carried out using different protein concentration solutions, and the solubility curve was formed by connecting these points (Cc, Cp) obtained at different Cp.
2.3. Evaluation of the quality of the protein crystals
The definition of good quality protein crystals is whether or not the crystal provides high-resolution diffraction data. The evaluation of the quality of protein crystals has been carried out by measuring B-factors as reported by Arai et al. (2004 ▶).
The Wilson plot is obtained as follows. The Bragg intensity is written as
where k is a constant, B is the B-factor, θ is the Bragg angle and λ is the wavelength. To determine the B-factor and k, equation (1) is rewritten as
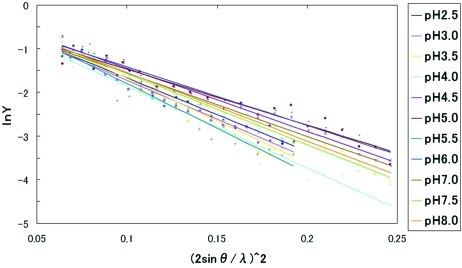
The Wilson plot is drawn as lnY versus (sinθ/λ)2. When the B-factor is small, i.e. the slope of the Wilson plot is small, the Bragg reflection intensity at large sinθ/λ is still large enough, i.e. the high-resolution data are collected using this crystal. This means that the crystal quality is good; and vice versa in the case of bad crystals.
X-ray diffraction data were collected using a DIP 2000 X-ray diffractometer (Mac Science Incorporation) at a wavelength of 1.5418 Å. Obtained data sets were processed using the program DENZO and then merged using the program SCALEPACK. Wilson plots were derived using the program CCP4 (Collaborative Computational Project, Number 4, 1994 ▶).
2.4. Preliminary neutron diffraction experiment
A preliminary neutron diffraction experiment was performed with a crystal of HEWL using a BIX-3 diffractometer (Kurihara et al., 2004 ▶) at port 1G-B in the reactor hall, JRR-3, of Japan Atomic Energy Agency. The crystal grown in H2O solutions was soaked in D2O solutions for three days in order to avoid high backgrounds owing to the incoherent neutron scattering from H atoms. The crystal was mounted in a quartz capillary for data collection using a neutron wavelength of 2.9 Å with 2 h exposure.
3. Results and discussion
3.1. Preliminary crystallization over a wide pH range
As a preliminary crystallization over a wide pH range, the crystallization conditions were fixed and the pH values of solutions were varied to realise a wide pH range. This provides the tendency of the shift of the borderline and solubility curves by observing the number of grown crystals and crystal growth rate at an assigned duration with accordance of pH values, i.e. the change of supersaturated ratio.
Crystallization of HEWL at pH 2.5–6.5 was carried out in the designed pH solution directly and the observations of crystal growth at pH 2.5–6.5 were as follows. At pH 2.5, alot of crystals grew in one day; the crystal growth rate was very fast and the number of crystals grown was large. At pH 3.0–5.5, crystals grew in 3–5 days; the crystal growth rate was slow and the number of crystals grown was small. At pH 6.0–6.5, crystals grew in about 7–8 days; the crystal growth rate was slow and the number of grown crystals was small, meaning that the experimental conditions at pH 6.0–6.5 may be close to borderline in the phase diagram at this pH. Beyond pH 7.0, crystals did not appear under the experimental conditions and therefore the growing conditions entered the metastable region.
These results provide the pH dependence of the crystallization phase diagram compared with that at pH 4.5 as follows: at pH < 4.5 the borderline shifted to the left and at pH > 4.5 the borderline shifted to the right. Beyond pH 7.0 the filled yellow circle in Fig. 1 ▶ enters the metastable region. These were confirmed by determination of the phase diagram at the different pH values mentioned below.
3.2. Crystallization phase diagram at pH 2.5, 6.0 and 7.5
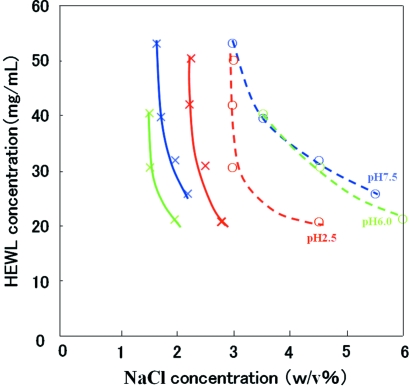
The crystallization phase diagrams of HEWL at pH 2.5, 6.0 and 7.5 are shown in Fig. 2 ▶. At pH 2.5 and 7.5 the solubility curves were successfully obtained using the dialysis method. (NB these were not reported in the paper of Howard et al., 1988 ▶.) The solubility curve at pH 6.0 agreed with the results of Howard et al. (1988 ▶). The borderlines in the crystallization phase diagrams of HEWL at pH 2.5, 6.0 and 7.5 were completely new results which Howard et al. (1988 ▶) and Cacioppo & Pusey (1991 ▶) did not report. We found that the metastable region at pH 2.5 is narrow, but is wide at pH 6.0 and 7.5. This suggests that it is preferable to grow large single crystals at pH 6.0 and 7.5.
Figure 2.
Crystallization phase diagrams of HEWL. Crosses and circles are the experimental data. Solid lines are solubility curves and broken lines are borderlines, as guides for the eye. Results at pH 2.5, 6.0 and 7.5 are drawn in red, green and blue, respectively.
We have checked our preliminary crystallization results according to our accurate crystallization phase diagram and found that crystallization conditions at pH 6.0–6.5 were in the metastable region and crystallization under these conditions should not have occurred. However, since our preliminary crystallization experiment was carried out by a batch method, nucleation might have occurred during the preparation of solutions. We must be careful to discuss the crystallization effect of different methods.
3.3. Evaluation of protein crystals
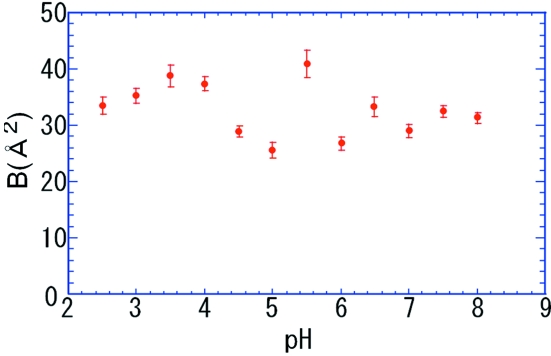
Fig. 3 ▶ shows the results of Wilson plots from obtained crystals over a wide pH range (pH 2.5–8.0). Fig. 4 ▶ show the pH dependence of B-factors obtained by the Wilson plot, and they show a little scatter around the average value of 32 Å2, but do not depend so much on pH. This means that the qualities of crystals obtained over a wide pH range are more or less equivalent.
Figure 3.
Results of Wilson plots from obtained crystals over a wide pH range. Lines are obtained by least-squares methods.
Figure 4.
Resulting B-factors obtained using the Wilson plot in Fig. 3.
3.4. Preliminary neutron diffraction experiment
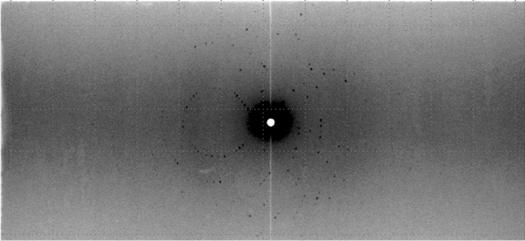
A preliminary neutron diffraction experiment was performed using a crystal of HEWL at pH 3.5 as shown in Fig. 5 ▶ at room temperature. Fig. 6 ▶ shows the diffraction pattern and this indicates a data set at a resolution of 1.7 Å, sufficient resolution to identify the positions of the H atoms.
Figure 5.
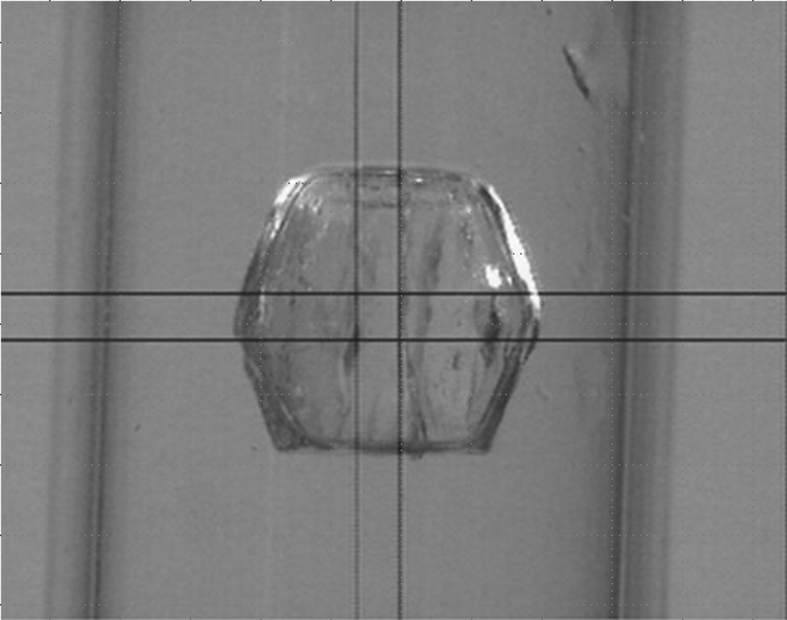
The HEWL crystal grown at pH 3.5. The crystal volume is 1.5 × 2.1 × 2.2 mm.
Figure 6.
Obtained diffraction pattern of HEWL crystal at pH 3.5. The wavelength is 2.9 Å and the exposure time is 2 h.
4. Conclusions
The conclusions may be summarized as follows.
(i) HEWL crystals over a wide pH range (2.5–8.0) were obtained.
(ii) Crystallization phase diagrams at pH 2.5, 6.0 and 7.5 were determined.
(iii) The qualities of these obtained crystals were characterized by the Wilson plot method and the qualities of all crystals at different pH were more or less equivalent.
(iv) The crystal grown at pH 3.5 was used for the preliminary neutron diffraction experiment and was found to provide 1.7 Å resolution data. It is expected that neutron diffraction from all crystals of different pH provides equivalent quality data for discussions of protein pH titration in the crystalline state of HEWL.
Acknowledgments
The work reported here was partially supported by Grant-in-Aids for Scientific Research from the Ministry of Education, Science, Sports and Culture.
References
- Arai, S., Chatake, T., Suzuki, N., Mizuno, H. & Niimura, N. (2004). Acta Cryst. D60, 1032–1039. [DOI] [PubMed]
- Bon, C., Lehmann, M. S. & Wilkinson, C. (1999). Acta Cryst. D55, 978–987. [DOI] [PubMed]
- Cacioppo, E. & Pusey, M. L. (1991). J. Cryst. Growth, 114, 286–292.
- Collaborative Computational Project, Number 4 (1994). Acta Cryst. D50, 760–763.
- Howard, S. B., Twigg, P. J., Baird, J. K. & Meehan, E. J. (1988). J. Cryst. Growth, 90, 94–104.
- Jones, M. N., Manley, P. & Holt, A. (1984). Intl. J. Biol. Macromol.6, 65–68.
- Kurihara, K., Tanaka, I., Muslih, M. R., Ostermann, A. & Niimura, N. (2004). 11, 68–71. [DOI] [PubMed]
- Maeda, M., Fujiwara, S., Yonezawa, Y. & Niimura, N. (2001). J. Phys. Soc. Jpn, A70, 403–405.
- Niimura, N., Arai, S., Kurihara, K., Chatake, T., Tanaka, I. & Bau, R. (2006). Cell. Mol. Life Sci.63, 285–300. [DOI] [PMC free article] [PubMed]
- Niimura, N., Minezaki, Y., Nonaka, T., Castagna, J. C., Cipriani, F., Hoghoj, P., Lehman, M. S. & Wilkinson, C. (1997). Nat. Struct. Biol.4, 909–914. [DOI] [PubMed]


