Crystal structures of protease/inhibitor complexes guided optimization of the buried nonpolar surface area thereby maximizing hydrophobic binding. The resulting potent tripeptide inhibitor is in clinical trials.
Keywords: HCV protease, structure-based design, ketoamides, hydrophobic binding
Abstract
The structures of both native and S139A holo-HCV NS3/4A protease domain were solved to high resolution. Subsequently, structures were determined for a series of ketoamide inhibitors in complex with the protease. The changes in the inhibitor potency were correlated with changes in the buried surface area upon binding the inhibitor to the active site. The largest contributions to the binding energy arise from the hydrophobic interactions of the P1 and P2 groups as they bind to the S1 and S2 pockets. This correlation of the changes in potency with increased buried surface area contributed directly to the design of a potent tripeptide inhibitor of the HCV NS3/4A protease, which is currently in clinical trials.
1. Introduction
Approximately 170 million people worldwide are infected with hepatitis C virus (HCV), the etiologic agent of non-A non-B hepatitis (Consensus Panel, 1999 ▶). Current combination therapy of pegylated-interferon-α and ribavirin gives 70–80% sustained virological response against most genotypes, but only 40% against genotype 1 (Zeuzem et al., 2000 ▶; Heathcote et al., 2000 ▶). Consequently, the discovery of more effective anti-HCV agents has been a major objective of pharmaceutical companies. Extensive biochemical and structural studies have been performed on the NS3/NS4A serine protease and the NS5B RNA polymerase. Significant progress has been made in the structure-based design (SBD) of inhibitors of these enzymes, as summarized in a review by De Francesco et al. (2003 ▶). Herein, we will focus on SBD of inhibitors of the HCV NS3/NS4A protease and refer to it simply as the HCV protease.
More than ten years ago, the first crystal structure of HCV protease revealed not only a chymotrypsin-like fold and a classical Asp–His–Ser catalytic triad, but also a novel intercalation of a β strand from the NS4A cofactor within the core β sheet (PDB code 1a1r; Kim et al., 1996 ▶). A subsequent structure of the bifunctional NS3 protease/helicase showed that the two enzymatic activities are associated with independently folded tandem domains. Moreover, in the bifunctional enzyme, the protease is auto-inhibited by binding the six C-terminal residues of the helicase domain as the P side product of the cis cleavage of the NS3-NS4A junction (PDB code 1cu1; Yao et al., 1999 ▶). The product peptide binds in an antiparallel direction with five backbone hydrogen bonds from the P5, P3 and P1 residues to the edge β strand of the protease domain and also hydrogen bonds from the terminal carboxylate to the catalytic His57 and the oxyanion hole. Apparently, this interaction between the helicase and protease domains is easily disrupted because both the catalytic efficiency and the inhibitor binding strength are comparable for the full-length NS3/NS4A and the truncated form missing the helicase domain (Gallinari et al., 1998 ▶). Product-based inhibitors bind in the same mode as the helicase C terminus (unpublished crystal structures from our laboratories). A potent macrocyclic tetrapeptide inhibitor of this type advanced to proof-of-concept clinical trials, but no further (Lamarre et al., 2003 ▶; Llinas-Brunet et al., 2004 ▶).
Other published structures of inhibitor/protease complexes feature a covalent bond linking the catalytic Ser139 to one of four types of electrophile in the inhibitor. These reaction products include acyl adducts from lactams or aldehydes and slowly reversible tetrahedral adducts from ketoacids or ketoamides. Contrary to many other proteins, the tetrahedral adducts arise from si-face attack on the keto group by Ser139, resulting in hydrogen bonds from the keto CO group to His57 and from the acid or amide O atoms to the oxyanion hole.
Herein we report optimization of ketoamide inhibitors based on their complementarity to the enzyme binding site as revealed in crystallographic structures of protease/inhibitor complexes. This process culminated in discovery of the tripeptide ketoamide, SCH503034, which has advanced to clinical trials as a potential treatment for HCV infections (Zeuzem et al., 2005 ▶). Another ketoamide inhibitor is also in advanced clinical trials (Thomson & Perni, 2006 ▶).
2. Results
Crystallization, data collection and refinement procedures have been reported for the HCV protease and its inhibitor complexes (Prongay et al., 2007 ▶). Data were collected on home sources or at the Cornell University or Argonne National Laboratory synchrotron facilities. The current structure of native HCV protease recapitulates the previously published features of this chymotrypsin-like serine protease and is almost identical in detail. The resolution of the structure for the S139A mutant was 2.0 Å, the highest reported to date. For the complexes, the resolution range was 2.3–2.7 Å, 90% of the residues were in the most favored region of the Ramachandran plot, Rwork was 17–20% and Rfree 25–29%.
Our discovery process from an initial ketoamide-containing undecapeptide lead through P3–P2′-derived pentapeptide mimics and ultimately to the tripeptide P3–P1 mimic, 9, is traced in another paper (Venkatraman et al., 2006 ▶). Herein, the structural path is traced beginning with a pentapeptide ketoamide inhibitor 1. From this starting point, the resulting tripeptides related to 9 are analyzed in detail.
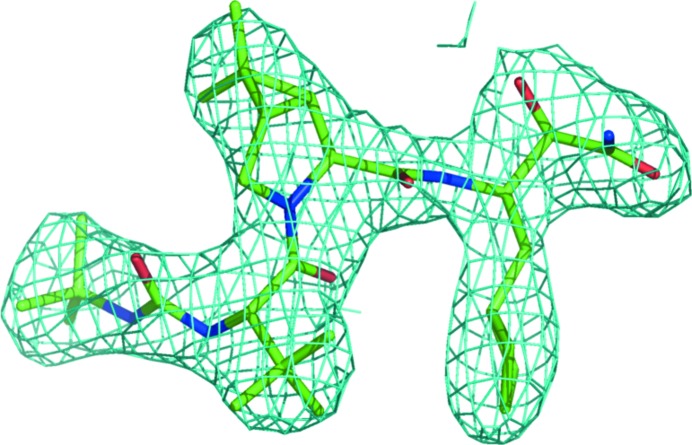
The structure derived from a crystal soaked with 1 shows a covalent complex with the inhibitor which spans subsites S4–S2′. The aliphatic cap of 1 is analogous to IBoc–Val as P4–P3. Si-face attack of Ser139 yields a stable tetrahedral intermediate with a covalent bond from Ser Oγ to the keto C atom and with the keto oxyanion hydrogen bonded to His57. The P1 amide carbonyl O atom is in the oxyanion hole hydrogen bonding to the NH groups of Gly137 and Ser139. Canonical backbone hydrogen bonds are formed: P3CO–Ala157NH, P1NH–Arg155CO, P2′NH–Thr42CO and P2′CO–Thr42NH. P3 lacks an amide NH group so the usual P3NH–Ala157CO hydrogen bond is missing. The inhibitor side chains bind in surface pockets that are primarily hydrophobic, with the S1 pocket being the largest and deepest. For polar protein residues in the binding site, the head groups interact with each other or with solvent, not with the inhibitor. After the p-side of pentapeptide peptide inhibitors was further optimized, capped tripeptides spanning S4–S1 had good potency. The structure of protease with the optimized tripeptide 9 is shown in Fig. 1 ▶. The quality of the X-ray structures is illustrated by the electron density for 9 shown in Fig. 2 ▶. The names and structures of nonstandard amino acids are given in Table 1 ▶.
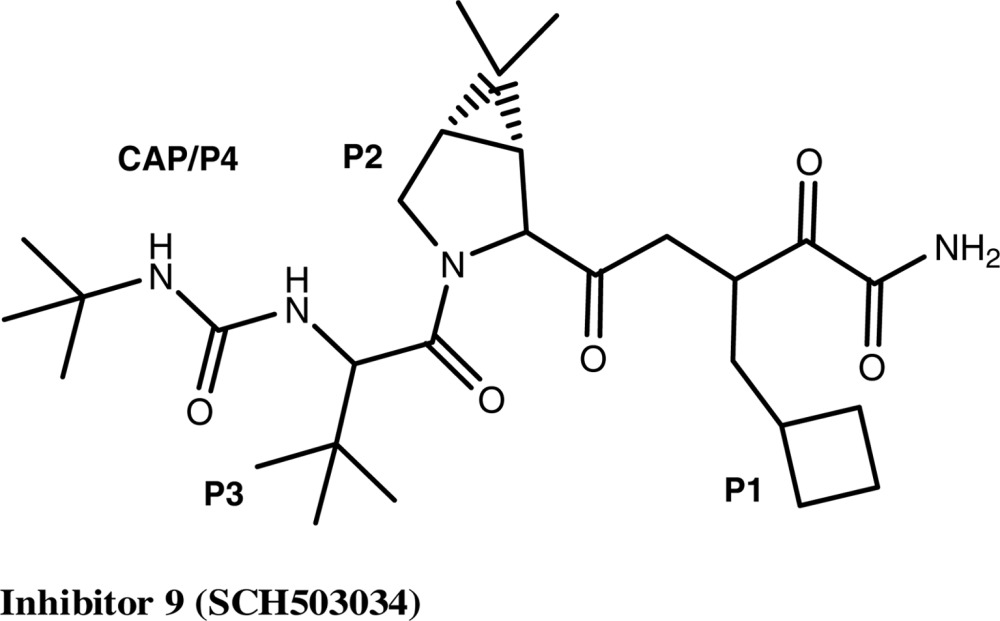
Figure 1.
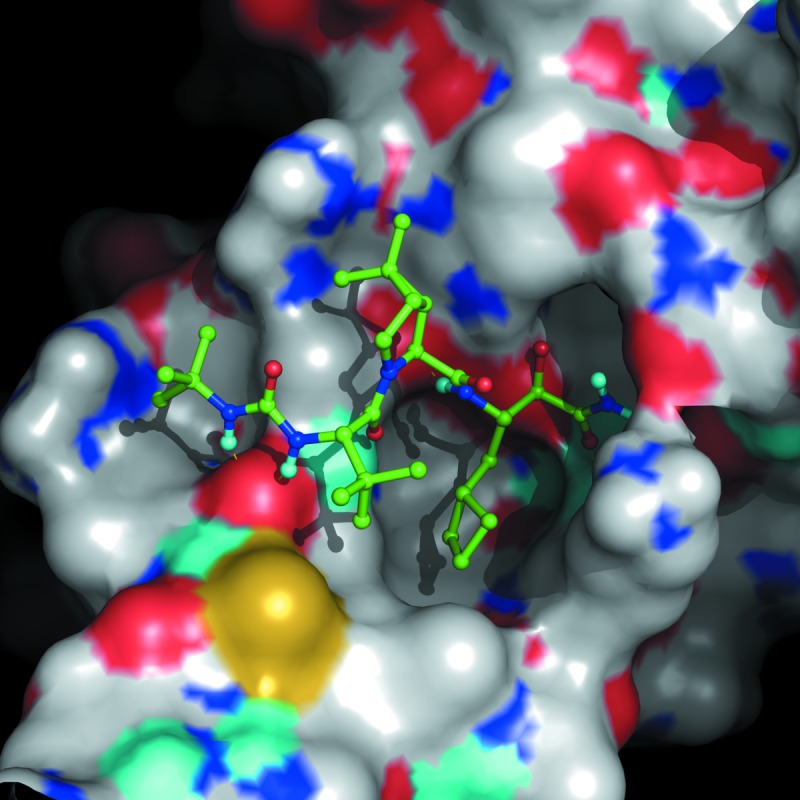
Crystal structure of the covalent complex between 9 and the protease. The protein surface is shown with the inhibitor in ball and stick representation, with atom colors as follows: protein C atoms, white; inhibitor C atoms, green; polar H atoms, cyan; N atoms, blue; O atoms, red; sulfur, yellow. The figure was generated using Pymol (Delano, 2002 ▶).
Figure 2.
2F o −F c electron density around 9. The figure was generated using Pymol (Delano, 2002 ▶).
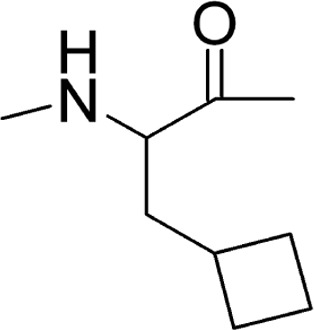
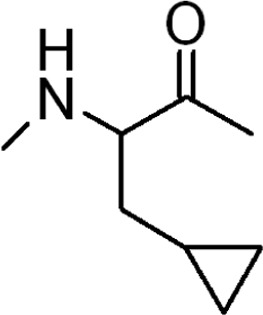
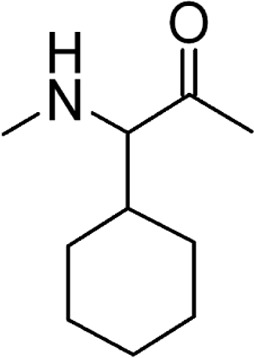
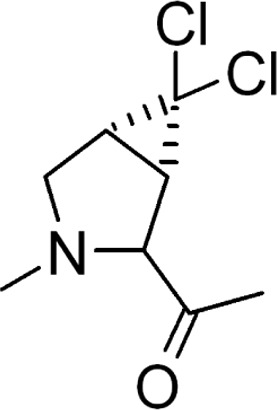
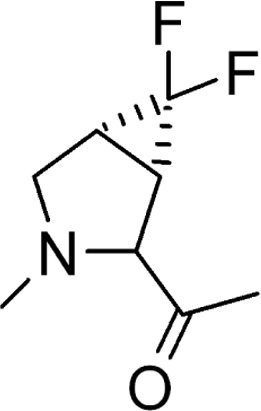
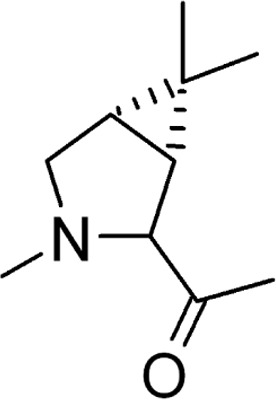
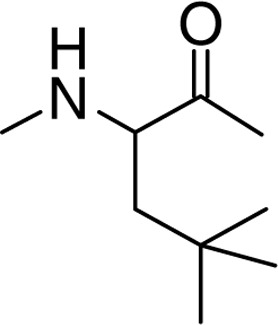
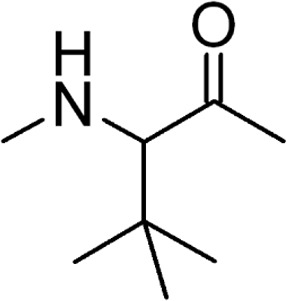
Table 1. Residue names and chemical structures.
| Residue | Name | Structure |
|---|---|---|
| c-Bua | Cyclobutylalanine |
|
| c-Pra | Cyclopropylalanine |
|
| Chg | Cyclohexylglycine |
|
| DCCP | Dichlorocyclopropylproline |
|
| DFCP | Difluorocyclopropylproline |
|
| DMCP | Dimethylcyclopropylproline |
|
| t-Bua | t-Butylalanine |
|
| t-Bug | t-Butylglycine |
|
In the structure-based design of potent tripeptide inhibitors, P1 and P2 were found to give the largest incremental increases in potency. For acyclic residues, Nva gives the most potent inhibitor (Table 2 ▶, Prongay et al., 2007 ▶). Examination of crystal structures shows that Abu is too short to fill the S1 pocket, Nva fills the pocket more completely, and Nle fills the pocket completely but causes some steric and torsional strain. Leu with γ branching has about the same activity as Nle, but additional branching in t-Bua or t-Bug gives compounds with no measurable inhibition. Including both the cyclic and the acyclic residues, c-Pra and c-Bua are optimal. Cyclization removes the torsional penalty for binding eclipsed conformations of the side chains. c-Bua completely fills S1. Further increases in the size of P1 give a significant loss in potency for both of these cyclic side chains. For a subset of these inhibitors, which are defined by the generic formula t-Boc–Cha–(dimethylcyclopropyl)Pro–P1–CONH2 and span a 30-fold range in potency, the relationship between inhibitor potency and surface area buried by P1 was examined. Using P1 = Abu as a reference, the relative experimental Ki* values were predicted by the differential buried surface area within a factor of 0.3–1.1 for Nva, c-Pra and c-Bua (Table 2 ▶) but 0.1 for Nle, a 10-fold discrepancy. Nle buries as much surface area as c-Bua but has introduced significant strain energy in both its conformation and that of S1, counteracting the favorable hydrophobic binding energy.
Table 2. P1 buried surface area/activity relationship.
The inhibitors have the generic formula of 9 except with a t-Boc cap instead of tert-butylurea.
| Compd | P1 | Ki* | SA | SA | Rel. Ki* SA | Rel. Ki* exp. | Ki* ratio exp./SA |
|---|---|---|---|---|---|---|---|
| 2 | Abu | 740 | 82 | 0 | 1 | 1 | 1.0 |
| 3 | Nva | 100 | 120 | 38 | 18 | 7 | 0.4 |
| 4 | Nle | 160 | 136 | 54 | 63 | 5 | 0.1 |
| 5 | c-Pra | 25 | 125 | 43 | 27 | 30 | 1.1 |
| 6 | c-Bua | 25 | 141 | 59 | 93 | 30 | 0.3 |
S2 is a partially closed cavity bounded on two sides by the faces of His57 and Arg155, while the Ala156 methyl group provides a small knob on a third side. The cavity is open towards the inhibitor backbone. His57 and Arg155 make polar interactions within or parallel to the cavity walls; these side chains do not project potential hydrogen-bonding groups into the cavity. This small cavity is filled by the Cβ and Cδ atoms of P2 leucine in 1. P2 proline rigidifies the backbone in the bound conformation, but lacks the Cδ contacts of leucine and loses about fivefold in potency. Proline was used as a scaffold for rigid leucine analogs culminating in 9 with dimethylcyclopropylproline (DMCP) (Table 3 ▶). The rigid DMCP fills S2 better than leucine and gives a substantial increase in potency (70-fold relative to Leu, 350-fold relative to Pro). Replacing the two distal methyl groups with isosteric Cl atoms gives an inhibitor with equal potency. The difluoro analog is too small to completely fill S2 and loses potency. Inhibitor potency versus surface area buried by P2 was examined for inhibitors that span a 90-fold potency range and have the generic formula tBu–urea–t-Bug–P2–c-Bua–CONH2. The relative potency of the cyclopropyl–Pro inhibitors is underestimated by a factor of 4–8 by the buried surface area (Table 3 ▶). By contrast, the relative potencies of Leu, DMFP and ODBP are overestimated by a factor of 3–20. For Leu, the lower potency is thought to arise from its greater backbone and side chain flexibility.
Table 3. P2 buried surface area/activity relationship (generic formula 9).
| Compd | P2 | Ki* | SA | SA | Rel. Ki* SA | Rel. Ki* exp. | Ki* ratio exp./SA |
|---|---|---|---|---|---|---|---|
| 7 | Pro | 5000 | 25 | 0 | 1 | 1 | 1.0 |
| 8 | Leu | 1000 | 63 | 38 | 19 | 5 | 0.3 |
| 9 | DMCP | 14 | 83 | 58 | 86 | 360 | 4.1 |
| 10 | DCCP | 19 | 70 | 45 | 32 | 260 | 8.1 |
| 11 | DFCP | 140 | 51 | 26 | 7 | 36 | 4.8 |
S3 is a small depression bounded by Ile132, Ala157 and Cys159. For the three P3 groups considered, the experimental potency varies only eightfold (Table 4 ▶). Correlations between buried surface area and potency were examined for inhibitors of the generic formula tBu–urea–P3–DMCP–P1–CONH2 with P1 = c-Pra or c-Bua (generally these two P1s give equipotent inhibitors). Val binds with the two methyl groups of its isopropyl group forming a ‘V’ pointing away from the surface and the Hβ atom pointing down (Fig. 2 ▶). Together these two methyl groups bury about as much surface area as a single fully buried methyl group (30 Å2; Table 4 ▶; Tanford, 1980 ▶). Chg buries more surface area, leading to a prediction of a modest potency increase as observed experimentally. t-Bug buries about the same surface area as Val, but largely by means of the third methyl group, which points directly toward the enzyme surface (Fig. 1 ▶). The eightfold increase in potency of t-Bug over Val inhibitors is under-predicted by a factor of ten from the buried surface area. Comparing t-Bug to Chg, its smaller buried surface area should give fivefold less potency, but it is fourfold more potent with the tert-butyl–urea cap and twofold less potent with the t-Boc cap. These potency differences are comparable with the experimental error of two- to threefold. The greater than expected activity of the t-Bug-containing inhibitors is probably due to greater rigidity and decreased entropic penalty for binding, which are apparently more important factors than buried surface area in the optimization of the P3 side chain.
Table 4. P3 buried surface area/activity relationship (generic formula 9, except 12 and 13 have P1 = c-Pra rather than c-Bua).
| Compd | P3 | Ki* | SA | SA | Rel. Ki* SA | Rel. Ki* exp. | Ki* ratio exp./SA |
|---|---|---|---|---|---|---|---|
| 12 | Val | 100 | 37 | 0 | 1.0 | 1 | 1.0 |
| 13 | Chg | 50 | 55 | 18 | 4.0 | 2 | 0.5 |
| 9 | t-Bug | 14 | 34 | 3 | 0.8 | 7 | 9.0 |
The tert-butyl–urea cap of 9 occupies S4. It affords about a threefold increase in potency over a conventional P4, such as N-acetyl-Val in 17, while reducing the molecular weight and the number of amide bonds. Both urea NH groups hydrogen bond to the Ala157 CO group and this gives a twofold increase in potency compared with t-Boc. In the series Cap–Chg–DMCP–c-Pra–CONH2 where Cap = ROCO, the progressive 30-fold increase in potency for R = Me, Et, iPr and tBu is well predicted by the increased buried surface area which was modeled on the basis of the structure of the Cap = t-Boc inhibitors (Table 5 ▶). Although Ac-Val buries slightly more surface area, it gives a less potent inhibitor than t-Boc. Boc binds in a somewhat different location than Val, shifted toward the top of the binding pocket, and also would have a lower entropic penalty for binding.
Table 5. P4 buried surface area/activity relationship (generic formula 9, except P3= Chg rather than t-Bug).
| Compd | P4 | Ki* | SA | Rel. Ki* SA | Rel. Ki* exp. | Ki* ratio exp./SA |
|---|---|---|---|---|---|---|
| 14 | MeO(CO) | 800 | 0 | 1 | 1 | 1.0 |
| 15 | EtO(CO) | 230 | 22 | 5 | 3 | 0.6 |
| 16 | iPrO(CO) | 60 | 52 | 54 | 13 | 0.2 |
| 5 | tBuO(CO) | 25 | 52 | 54 | 32 | 0.6 |
| 17 | Ac-Val | 68 | 55 | 68 | 12 | 0.2 |
The optimized tripeptide inhibitor 9, tBu–urea–t-Bug–DMCP–c-Bua–CONH2, is highly potent with a Ki* of 14 nM. The structure of its complex with protease (Fig. 1 ▶) shows each residue interacting with its binding subsite. Notable elements are c-Bua filling the S1 cavity and DMCP binding to the S2 surface as well as buttressing the catalytic triad in its active conformation. Features that contribute to binding include the formation of a reversible covalent bond, hydrogen bonds and the hydrophobic effect of burying nonpolar surface area. Nonpolar side chains were varied systematically in the discovery process, culminating in the burial of 310 Å2 of combined inhibitor and enzyme surface area with about half from each source in the protease:9 complex. c-Bua at P1 is 80% buried and contributes the largest factor to binding, followed by P2, P3-cap and P3. The latter three groups are only ∼40% buried, which highlights the exposed nature of this protease binding site.
3. Discussion
Crystallographic structures of protease/inhibitor complexes provided a basis for interpreting the potency of each inhibitor relative to its complementarity to the protease binding site. Optimizing the fit of P1 and P2 to their subsites was especially important. The open nature of the protease binding site limited the noncovalent affinity that could be obtained. This lower affinity was compensated by forming a covalent adduct between the keto amide of the inhibitors and the active site serine. The optimized tripeptide was substantially lower in molecular weight than the original undecapeptide lead inhibitors. The physical and pharmacological properties of 9 were also optimized (Venkatraman et al., 2006 ▶). This compound has successfully completed phase I clinical studies and has advanced to phase II as a potential treatment for hepatitis C infections (Zeuzem et al., 2005 ▶).
References
- Consensus Panel (1999). J. Hepatol. 30, 956. [PubMed]
- De Francesco, R., Tomei, L., Altamura, S., Summa, V. & Migliaccio, G. (2003). Antiviral Res. 58, 1–16. [DOI] [PubMed]
- DeLano, W. L. (2002). The Pymol Molecular Graphics System. DeLano Scientific LLC, San Carlos, California, USA.
- Gallinari, P., Brennan, D., Nardi, C., Brunetti, M., Tomei, L., Steinkühler, C. & De Francesco, R. (1998). J. Virol. 72, 6758–6769. [DOI] [PMC free article] [PubMed]
- Heathcote, E. J., Schiffman, M. L., Cooksley, W. G. E., Dusheiko, G. M., Lee, S. S., Balart, L., Reindollar, R., Reddy, R. K., Wright, T. L., Lin, A., Hoffman, J. & DePamphilis, J. (2000). N. Engl. J. Med. 343, 1673–1680. [DOI] [PubMed]
- Kim, J. L. et al. (1996). Cell, 87, 343–355. [DOI] [PubMed]
- Lamarre, D. et al. (2003). Nature (London), 426, 186–189.
- Llinas-Brunet, M. et al. (2004). J. Med. Chem. 47, 1605–1608. [DOI] [PubMed]
- Prongay, A. J. et al. (2007). J. Med. Chem. 50, 2310–2318. [DOI] [PubMed]
- Tanford, C. (1980). The Hydrophobic Effect. Formation of Micelles and Biological Membranes, 2nd ed. New York: John Wiley and Sons.
- Thomson, J. A. & Perni, R. B. (2006). Curr. Opin. Drug Discov. Dev. 9, 606–617. [PubMed]
- Venkatraman, S. et al. (2006). J. Med. Chem. 49, 6074–6086. [DOI] [PubMed]
- Yao, N., Reichert, P., Taremi, S. S., Prosise, W. W. & Weber, P. C. (1999). Structure (London), 7, 1353–1363. [DOI] [PubMed]
- Zeuzem, S., Feinman, S. V., Rasenack, J., Heathcote, E. J., Lai, M.-Y., Gane, E., O’Grady, J., Reichen, J., Diago, M., Lin, A., Hoffman, J. & Brunda, M. J. (2000). N. Engl. J. Med. 343, 1666–1672. [DOI] [PubMed]
- Zeuzem, S., Sarrazin, C., Homburg, F., Rouzier, R., Forestier, N., Gupta, S., Hussain, M., Shah, A., Cutler, D. L. & Zhang, J. (2005). American Association for the Study of Liver Diseases (AASLD), San Francisco, USA, 11–15 November 2005. Hepatology Abstract 67627.


