

Abstract
Immunogold electron microscopy and analysis were used to determine the organization of the major structural proteins of vesicular stomatitis virus (VSV) during virus assembly. We determined that matrix protein (M protein) partitions into plasma membrane microdomains in VSV-infected cells as well as in transfected cells expressing M protein. The sizes of the M-protein-containing microdomains outside the virus budding sites (50 to 100 nm) were smaller than those at sites of virus budding (approximately 560 nm). Glycoprotein (G protein) and M protein microdomains were not colocalized in the plasma membrane outside the virus budding sites, nor was M protein colocalized with microdomains containing the host protein CD4, which efficiently forms pseudotypes with VSV envelopes. These results suggest that separate membrane microdomains containing either viral or host proteins cluster or merge to form virus budding sites. We also determined whether G protein or M protein was colocalized with VSV nucleocapsid protein (N protein) outside the budding sites. Viral nucleocapsids were observed to cluster in regions of the cytoplasm close to the plasma membrane. Membrane-associated N protein was colocalized with G protein in regions of plasma membrane of approximately 600 nm. In contrast to the case for G protein, M protein was not colocalized with these areas of nucleocapsid accumulation. These results suggest a new model of virus assembly in which an interaction of VSV nucleocapsids with G-protein-containing microdomains is a precursor to the formation of viral budding sites.
Membrane microdomains provide a physiological scaffold for enveloped virus assembly. The goal of the experiments presented here was to determine how vesicular stomatitis virus (VSV) proteins are organized into membrane microdomains during assembly. VSV particles have a negative-strand RNA genome that is encapsidated in a helical nucleocapsid and enveloped by a lipid bilayer. The lipid bilayer is derived from host cell plasma membrane during the budding process. VSV has two membrane proteins: the M protein is an internal peripheral membrane protein that is associated with both the nucleocapsid and the lipid bilayer, and the G protein is an integral transmembrane protein that is expressed on the surface of the virion.
Membrane microdomains are regions of the plasma membrane that are enriched in a particular protein or lipid. They are dynamic and have lateral mobilities. Membrane microdomains function in cell signaling, intracellular trafficking, and virus assembly (9, 13, 52). Lipid rafts are the most common type of membrane microdomain studied to date. They are a collection of membrane microdomains that are insoluble in low concentrations of nonionic detergents (such as Triton X-100) at 4°C, are approximately 100 nm, and are enriched in sphingolipids and cholesterol (2, 9, 52). Many enveloped viruses bud from lipid rafts, including human immunodeficiency virus type 1, influenza virus, Ebola and Marburg viruses, measles virus, Newcastle disease virus, and respiratory syncytial virus (1, 4, 18, 30, 32, 40, 41, 43, 45, 47, 49, 55; reviewed in references 13 and 54). VSV proteins are soluble in Triton X-100 (23, 47, 49, 55, 58). Therefore, VSV is not considered to bud from lipid rafts. However, similar to the case for lipid rafts, the VSV envelope is enriched in sphingomyelin and cholesterol compared to the plasma membrane from which it buds (35, 47), suggesting that the virus buds from membrane microdomains that resemble lipid rafts. Brown and Lyles (10) developed an analysis technique for immunoelectron microscopy data, which showed that VSV G protein is organized into plasma membrane microdomains that are 100 to 150 nm in diameter in VSV-infected cells and in transfected cells that express G protein in the absence of other VSV viral components (10-12), further supporting the idea that VSV buds from membrane microdomains that resemble lipid rafts.
Viral protein incorporation into microdomains may be critical for efficient assembly into enveloped viruses. For example, a direct interaction between G protein and M protein has been difficult to demonstrate. However, G protein and M protein may dock into the same membrane microdomains based on affinity for similar lipids or protein-protein interactions with either host or viral proteins. We used immunoelectron microscopy to examine the lateral organization of VSV membrane proteins in regions of the plasma membrane both inside and outside the virus budding sites. The viral proteins associated with the plasma membrane outside the virus budding sites are likely precursors to virus budding sites. The evidence for this precursor-product relationship comes from pulse-chase radiolabeling experiments, in which VSV-infected cells were fractionated at various times during the chase (29). Membrane-associated M protein, G protein, and nucleocapsids behaved like kinetic intermediates in the formation of virions, i.e., the appearance of label in the plasma membrane fraction preceded its appearance in virions, and labeling in the plasma membrane fraction declined as the intracellular pools of labeled protein were depleted by the formation of virions.
In the experiments presented here, we determined that M protein partitions into membrane microdomains in VSV-infected cells as well as in transfected cells expressing M protein. The sizes of the M-protein-containing microdomains outside the virus budding sites (50 to 100 nm) were considerably smaller than those at sites of virus budding (approximately 600 nm), suggesting that M protein microdomains must cluster or merge at virus budding sites. Unexpectedly, we found that G protein and M protein microdomains were not colocalized in the plasma membrane outside the virus budding sites, nor was M protein colocalized with microdomains containing the host protein CD4, which efficiently forms pseudotypes with VSV envelopes. These results lend further support to the idea that separate membrane microdomains containing either viral or host proteins cluster or merge to form virus budding sites. We also determined whether G protein or M protein was colocalized with VSV nucleocapsid protein (N protein) outside the budding sites. Viral nucleocapsids were observed to cluster in regions of the cytoplasm close to the plasma membrane. However, membrane-associated M protein was not preferentially colocalized with these areas of nucleocapsid accumulation. In contrast, G protein and N protein were preferentially colocalized in plasma membrane regions of approximately 600 nm, suggesting that an interaction of VSV nucleocapsids with G-protein-containing microdomains is a precursor to the formation of viral budding sites.
MATERIALS AND METHODS
Cells and viruses.
The wild-type VSV (Indiana serotype, Orsay strain) was grown at 37°C in BHK cells in Dulbecco's modified Eagle medium containing 2% fetal bovine serum as described previously (28). The recombinant vaccinia virus vTF 7.3 that expresses bacteriophage T7 RNA polymerase (VV-T7) was provided by Bernard Moss (National Institutes of Health) and prepared in CV-1 cells as described previously (8). The recombinant VSV that expresses the T-cell antigen CD4 (VSV-CD4) was obtained from John K. Rose (Yale University School of Medicine) and grown as described previously (51).
Antibodies.
Primary antibodies were mouse anti-M protein antibody 23H12 (31), rabbit anti-M protein antibody (GenScript Corporation), rabbit anti-G protein antibody (Fitzgerald Industries International), mouse anti-N protein antibody 10G4 (39), and rat anti-CD4 antibody (GeneTex, Inc.). Isotype-matched negative control primary antibodies were mouse anti-hemagglutinin (HA) antibody (Sigma-Aldrich, Inc.), rabbit anti-HA antibody (Sigma-Aldrich, Inc.), and rat anti-HA antibody (Roche Diagnostics Corporation). Secondary antibodies were 6 nm colloidal gold goat anti-mouse antibody, 12 nm colloidal gold goat anti-mouse antibody, 12 nm colloidal gold goat anti-rabbit antibody, 6 nm colloidal gold goat anti-rat antibody (all from Jackson ImmunoResearch), and rhodamine-conjugated goat anti-mouse immunoglobulin G (IgG) (Molecular Probes).
Plasmid construction and transfection.
The M gene of the wild-type Orsay strain (8) was subcloned into the pET21d bacterial expression vector (Novagen) (16). A glycine at position 2 that was changed during cloning was mutagenized to wild-type serine by using the QuikChange II XL (Stratagene) site-directed mutagenesis kit. The M protein sequence was verified by automated sequence analysis in the WFU Biomolecular Resource Laboratory and analyzed using the European Molecular Biology open software suite. BHK cells were infected with VV-T7 at a multiplicity of infection of 5 PFU/cell for 1 h and then transiently transfected with empty vector or the M protein expression plasmid under the control of the T7 promoter for 16 h (16). This method was chosen because it is the only one that has been shown to produce levels of M protein comparable to those in VSV-infected cells (38). Unlike vectors that depend on host transcription, the vaccinia/T7 system is not affected by the M protein-mediated inhibition of host gene expression (8).
Immunolabeling and confocal microscopy.
BHK cells were seeded at a density of 7 × 10⁵ cells/ml in two-well chamber slides (Nunc). After 24 h, the cells were mock infected or infected with a multiplicity of infection of 20 PFU/cell of VSV to ensure that cells were synchronously infected. Cells were fixed with 4% paraformaldehyde (Sigma Chemical Company) for 10 min and washed in ice-cold wash buffer: phosphate-buffered saline (PBS) containing 0.1 M glycine (Fisher Chemical) and 10% goat serum (Gibco). Cells were permeabilized with 0.05% saponin (Calbiochem) for 5 min and then incubated with blocking buffer (PBS plus 10% goat serum) overnight while being rotated in the cold. Samples were labeled with a 1:250 dilution of mouse anti-M protein antibody or mouse anti-N protein antibody for 1 h and then with 5 μg/ml of rhodamine-conjugated goat anti-mouse IgG for 1 h (all antibody dilutions were made in blocking buffer). Confocal images were collected on a Zeiss Axiovert 100-M microscope equipped with a LSM 510 scanning unit and a 1.2 WC 63× Plan Apochromat objective. Plots were made using SigmaPlot 10 (Systat Software, Inc.), and statistical analyses were performed using SigmaStat 3.5 (Systat Software, Inc.).
Immunogold-labeling electron microscopy.
The immunogold-labeled electron microscopy samples were prepared and analyzed as described previously (10). BHK cells were seeded at a density of 1 × 10⁶ cells/ml in six-well tissue culture plates (Corning Incorporated). Cells were infected, fixed, and incubated with primary antibodies as described previously for confocal microscopy. Samples were labeled with colloidal gold-conjugated secondary antibodies in blocking buffer. The immunolabeled samples were postosmium fixed for 15 min, washed three times in PBS, Spurr resin embedded, and thin sectioned (80 nm) in the WFU Microscopy Core Laboratory. A Philips EM400 electron microscope operating at 80 keV was used to collect electron micrographs at a magnification of ×43,000. The micrographs were developed and digitized, and measurements were collected by using Image Pro 3.0 software (Media Cybernetics). The data were analyzed using Excel software (Microsoft). Graphs were made using SigmaPlot 10 (Systat Software, Inc.), and statistical analyses were performed using SigmaStat 3.5 (Systat Software, Inc.).
RESULTS
Intensity of M protein immunolabeling is higher in the plasma membrane than in the cytoplasm.
VSV M protein has previously been shown to be distributed throughout the cytoplasm and nuclei of virus-infected cells as well as transfected cells that express M protein in the absence of other VSV components (5, 15, 42, 44). A portion of M protein is associated with the cytoplasmic surface of the plasma membrane. However, the reported fraction of membrane-associated M protein varies widely, depending on the virus strain and the conditions of cell cultivation. The distribution of intracellular M protein in BHK cells infected with VSV was examined by confocal immunofluorescence microscopy to determine whether membrane-associated M protein could be distinguished from labeled M protein in the cytoplasm and whether there was any organization of M protein into membrane microdomains observable at the level of resolution of the confocal microscope. BHK cells were mock infected or infected with VSV for 4 or 8 h. The cells were fixed, permeabilized with saponin, and immunolabeled with primary anti-M protein antibody and rhodamine-conjugated secondary antibody. Confocal images were obtained with the equator of the cells in focus (Fig. 1A). Fields were shown by differential interference contrast imaging and rhodamine fluorescence (Fig. 1, left and right panels, respectively). Mock-infected BHK cells were elongated, whereas VSV-infected cells were round as a result of the viral cytopathic effect. In VSV-infected cells, M protein labeling was apparent in both the plasma membrane and in the cytoplasm at both 4 and 8 h postinfection (hpi). There was little if any labeling of M protein in the nuclei, likely due to the inefficient permeabilization of the nuclear envelope by saponin (39). At 4 hpi, a bright ring of labeling of M protein in the plasma membranes was distinct and separable from the fainter cytoplasmic M protein labeling. At 8 hpi, the M protein labeling was more intense. However, it was still possible to distinguish membrane labeling from cytoplasmic labeling. M protein appeared to be uniformly labeled in the plasma membrane, and there was no obvious domain organization at this level of resolution.
FIG. 1.

VSV M protein localization. (A) BHK cells were mock infected or infected with VSV for either 4 or 8 h. Cells were fixed, permeabilized, and labeled with mouse anti-M protein antibody, followed by goat anti-mouse antibody conjugated to rhodamine. Confocal microscopy was used to collect images of differential interference contrast (DIC) and M protein fluorescence. (B) Diagram of the cellular analysis of M protein labeling. A histogram of the rhodamine pixel intensity is shown for the cross section of the cell from panel A (white double arrow). M protein labeling was measured using the rhodamine pixel intensity recorded at sites (marked with arrows) within the plasma membrane and the cytoplasm. Two cross sections were taken of each cell and the pixel intensity readings were averaged. Two cytoplasmic pixel intensity readings were collected at the one-third and the two-thirds distances between each plasma membrane reading and the nucleus, as depicted with broken lines. (C) Average M protein pixel intensity at 4 and 8 hpi. Statistical differences (*, P < 0.001) in the pixel intensity of the plasma membrane and of the cytoplasm were determined using Student's t test. Error bars indicate standard deviations.
Plasma membrane and cytoplasmic labeling were quantified using Image-Pro software. Intersecting lines in the shape of an X were drawn through each cell. One such line is shown in Fig. 1A. A graph of pixel intensity versus distance along this line is shown in Fig. 1B. The peak pixel intensity of the plasma membrane was collected at the four points where the X crossed the plasma membrane. Two cytoplasmic pixel intensity readings were collected at the one-third and the two-thirds distances between each plasma membrane reading and the nucleus, as depicted in Fig. 1B. The average pixel intensities of both the plasma membrane and the cytoplasm of VSV-infected cells increased from 4 to 8 hpi (Fig. 1C). The ratios of membrane labeling to cytoplasmic labeling were calculated for each cell (n = 36) and were determined to be 2.7 ± 0.3 at 4 hpi and 2.3 ± 0.2 at 8 hpi (means ± standard deviations). The small difference in the ratio of M protein in the plasma membrane compared to that in the cytoplasm at 8 hpi versus 4 hpi was determined to be statistically significant (P < 0.001) using Student's t test. Therefore, the cellular distribution of M protein changes slightly as a function of time, but the important point is that the intensity of plasma membrane M protein immunolabeling was significantly greater (P < 0.001) than that in the cytoplasm at both time points.
M protein is organized into membrane microdomains outside the budding sites.
Since there was no obvious organization of M protein into membrane microdomains at the resolution of confocal microscopy, electron microscopy was utilized to determine whether M protein was organized into membrane microdomains in regions of plasma membrane outside the virus budding sites. BHK cells were mock infected or were infected with VSV for either 4 or 8 h. Cells were fixed, permeabilized, and labeled with mouse anti-M protein antibody, followed by anti-mouse IgG conjugated to 6-nm colloidal gold particles. Cells were prepared for electron microscopy and were lightly stained to obtain better contrast with the gold particles. The density of labeling by the gold particles was kept low so that little if any labeling could be detected in negative control samples. The low labeling efficiency also avoids the problem caused by the binding of one gold particle interfering with binding of another in regions of high labeling density.
Gold particles were present close to the plasma membrane as well as in the cytoplasm (Fig. 2A) as expected from the confocal microscopy analysis. The analysis technique developed by Brown and Lyles (10) was used to determine whether M protein resides in membrane microdomains. For this analysis, gold particles within 30 nm of the trace of the plasma membrane were considered likely to be associated with the membrane itself. The solid curve in Fig. 2A depicts the curvilinear trace of the plasma membrane, and the broken curves depict the distance of 30 nm from the plasma membrane trace. Thus, gold particles located between the broken curves were likely to be due to membrane-associated M protein. The method of Brown and Lyles depends on analyzing pairwise distances between gold particles in a large number of micrographs. To perform this analysis, 25 micrographs of arbitrarily chosen plasma membrane from two separate experiments were collected. Each micrograph was from a separate cell, and regions of plasma membrane containing virus budding sites were excluded from the analysis. In each micrograph, the distance between each gold particle located within 30 nm of the curvilinear trace of the plasma membrane was determined as depicted in Fig. 2A. The measurements were converted to pairwise distances between all gold particles in each micrograph. The pairwise distances were plotted as a histogram by sorting the distances between all gold particles in 20-nm increments. The numbers of pairwise distances were normalized to the numbers of gold particles that were analyzed at each increment to give a density of labeling plotted on the y axis against the distance between particles on the x axis. The basis for this analysis is that if M protein is organized into membrane microdomains, there will be more gold particles closer together compared to the average density of gold particles in the membrane, as is evident in Fig. 2A, in which there are more gold particles separated by short distances (<100 nm) than there are gold particles separated by long distances. When a large number of micrographs is analyzed, there are two possible results from this analysis, as diagramed in Fig. 2B. If M protein partitions into membrane microdomains, there will be a high density for short distances of separation compared to larger distances of separation (Fig. 2B, curve 1). However, if the M protein is randomly distributed, the density will be the same at all distances (Fig. 2B, curve 2). Figure 2C and D show results obtained from 50 micrographs at 4 and 8 hpi, respectively. The average density of M protein in the plasma membrane was calculated by dividing the total number of gold particles by the total length of membranes analyzed in the 50 micrographs, 0.08 particles per 20 nm at 4 hpi and 0.07 particles per 20 nm at 8 hpi (Fig. 2C and D). The density of gold particles within small distances of separation was substantially higher than the average density, while the density within large distances of separation was similar to the average density. These results indicate that M protein is present in membrane microdomains at both 4 and 8 hpi. The diameters of the M protein microdomains are approximated by an x axis intercept where the slope of the plot changes. A two-segment piecewise fit of the data yielded diameters of 100 nm at 4 hpi and 50 nm at 8 hpi. The slopes and y intercepts of the graphs in Fig. 2 depend on both the percentage of total M protein in microdomains and the density of labeling inside and outside the microdomains (10). Thus, the percentage of M protein in microdomains cannot be determined from these data. However, mathematical modeling suggests that a substantial proportion of M protein must be in microdomains to avoid having to postulate unreasonably high densities of M protein labeling (data not shown).
FIG. 2.

Analysis of M protein distribution outside budding sites in VSV-infected cells. BHK cells were mock infected or infected with VSV for 4 or 8 h. Cells were fixed, permeabilized, and labeled with mouse anti-M protein antibody, followed by 6 nm colloidal gold anti-mouse IgG. Cells were prepared for electron microscopy, and 50 electron micrographs were collected (25 per experiment at each time point). (A) Representative electron micrograph of a VSV-infected cell at 4 hpi. The 30-nm reflection of the curvilinear trace of the plasma membrane is detailed with broken lines, and the collected measurements are diagramed. (B) Theoretical histogram of pairwise distances depicting the possible outcomes: (i) membrane microdomains or (ii) no membrane microdomains (proteins distributed with the average density). (C and D) Pairwise distances between all particles within 50 micrographs were calculated from the collected measurements. The density was calculated as the number of particles in 20-nm increments normalized to the number of particles that could have been analyzed within each increment. The normalized density of particles per 20 nm was plotted on the y axis against the distance between particles on the x axis in a histogram. Histogram of the distribution of M protein outside the virus budding sites at (C) 4 hpi and (D) 8 hpi. The best fit of the data (two-segment fit) is depicted with a solid black line through the data points. The size of the membrane microdomains (vertical solid black line) is estimated as the x intercept where the graph changes slope. The average density of M protein in the plasma membrane was calculated by dividing the total number of gold particles by the total length of membranes analyzed in the 50 micrographs and is depicted with a horizontal broken line (0.08 particles per 20 nm at 4 hpi and 0.07 particles per 20 nm at 8 hpi).
M protein is present in large membrane microdomains at virus budding sites.
We evaluated whether M protein microdomains at virus budding sites are similar in size to those in plasma membrane outside the budding sites. Electron micrographs of 50 virus budding sites (25 per experiment) were collected from the samples analyzed in Fig. 2. Budding sites were selected as described previously (12), by using the criteria that the budding particle must be electron dense, must extend into the extracellular space, and must have cellular attachment. The distance of each gold particle within 30 nm of the plasma membrane was measured as depicted in Fig. 3A, starting from the tip of the budding virion to a distance of 1,000 nm (or until another budding site or the edge of a micrograph was reached). Data were obtained for both the right and left sides of the virion and combined. The density was calculated by sorting the distances between all gold particles and the tip of the virion in 20-nm increments and was normalized to the number of gold particles that were analyzed at each increment and plotted on the y axis against the distance from the tip of the virion on the x axis, as presented in Fig. 3B. The average length of the virus envelope, 153 nm (10), is depicted in the figure. The density of M protein was greatest at the tip of the budding sites, 0.34 particles per 20 nm, and decreased to the average density in the membrane as a whole at 284 nm from the tip of the budding site. Interestingly, the distance of high density of M protein labeling coincided with the theoretical circumference of the VSV particle, approximately 500 nm. The calculated size of the membrane microdomains containing M protein at virus budding sites is approximately 568 nm (284 nm × 2 sides). Thus, M protein membrane microdomains at the virus budding sites were considerably larger than M protein microdomains outside the budding sites. This result suggests that M protein microdomains may cluster to form virus budding sites.
FIG. 3.

Analysis of M protein distribution in budding sites of VSV-infected cells at 4 hpi. Electron micrographs of 50 virus budding sites (25 per experiment) were collected for the 4-hpi samples analyzed in Fig. 2. Measurements between each gold particle within 30 nm of the curvilinear trace of the plasma membrane were collected starting from the tip of the virion to a distance of 1,000 nm. Measurements were collected for each side of the virion and combined. (A) Representative electron micrograph of budding sites in a VSV-infected cell at 4 hpi showing a depiction of how the measurements were collected. The arrows represent virus budding sites and the arrowhead represents a cross section of a virus. (B) The collected measurements were converted to distances of each gold particle from the center of the tip of the virion. The density was calculated as the number of particles in 20-nm increments and normalized to the number of particles that could have been analyzed at each increment. The normalized density of particles per 20 nm was plotted on the y axis against the distance from the tip of the budding site on the x axis. The average length of the virus envelope, 153 nm (vertical broken line), was calculated previously by Brown and Lyles (10).
M protein is organized into membrane microdomains independently of other VSV components.
We hypothesized that like G protein (11), M protein is organized into membrane microdomains in the absence of other VSV components. BHK cells were infected with recombinant VV-T7 and then were transiently transfected with a plasmid encoding M protein under the transcriptional control of the T7 promoter. Transfected cells were fixed, permeabilized, and immunolabeled for electron microscopy, and 50 electron micrographs were collected and analyzed as in Fig. 2. Figure 4A shows an example micrograph of M protein labeling in the transfected cells. Heavy M protein labeling along the plasma membrane as well as formation of a virus-like particle (VLP) budding from the plasma membrane was apparent, as described previously (27, 33). Figure 4B shows an analysis of pairwise distances among gold particles in 50 micrographs. The average density of M protein labeling in the plasma membrane, 0.30 particles per 20 nm, is depicted. Because of the overexpression of M protein from the transfection system, this average density was approximately fourfold greater than that found in virus-infected cells (Fig. 2). As for VSV-infected cells, there was a greater density of M protein labeling at smaller distances of separation compared to the density at larger distances of separation. While it is possible that the distribution of M protein was affected by the vaccinia virus infection, this result indicates that M protein is organized into membrane microdomains in the absence of other VSV components. The size of these membrane microdomains could not be determined precisely because the data do not indicate a dramatic change in slope (compared to the data for Fig. 2, for example). The gradual change in slope in Fig. 4B is due to heterogeneity in the size of M-protein-containing microdomains (10). A similar level of heterogeneity was noted in the sizes of G-protein-containing microdomains at higher levels of G protein expression (10).
FIG. 4.
M protein partitions into membrane microdomains in the absence of other viral components. BHK cells were infected with VV-T7 and transfected with empty vector or an M protein expression plasmid under the control of the T7 promoter for 16 h. Immunogold labeling, electron microscopy preparation, and quantification of gold particle distribution were performed as done for Fig. 2. (A) Representative electron micrograph of M protein expressed in transiently transfected cells. The formation of virus-like particles can be seen at the membrane (arrows). (B) Histogram of the distribution of M protein in transiently transfected cells. The best fit of the data (logarithmic fit) is depicted with a solid black line. The average density of M protein in the plasma membrane is depicted with a horizontal broken line.
G and M proteins are not colocalized outside the budding sites.
M protein is able to stabilize G protein trimers (36), and chemically cross-linked virions have been shown to have G protein and M protein heterodimers (19), but a direct interaction between M protein and G protein has been difficult to establish. Also, a G protein mutant recombinant virus lacking the cytoplasmic tail forms microdomains and has incorporation into virus envelopes in a manner similar to that of wild-type VSV (11). The dispensability of the G protein cytoplasmic domain and the lack of concrete M protein and G protein association data suggest that M protein interacts with G protein indirectly through membrane microdomains. To test this hypothesis, BHK cells infected with VSV were double labeled with mouse anti-M protein antibody and rabbit anti-G protein antibody and then with 6-nm colloidal gold anti-mouse IgG and 12-nm colloidal gold anti-rabbit IgG. Cells were prepared for electron microscopy, and 50 electron micrographs (25 per experiment) of arbitrarily chosen plasma membrane were collected and analyzed. A representative electron micrograph of VSV-infected cells double labeled for M protein and G protein is shown in Fig. 5A. A cluster of three G-protein-labeled 12-nm gold particles is visible on the left side of Fig. 5A, while two clusters of M-protein-labeled 6-nm gold particles are visible on the right, giving the impression that G protein and M protein are in separate membrane microdomains. Distances were measured from each 12-nm G-protein-labeled gold particle to every 6-nm M-protein-labeled gold particle within 30 nm of the trace of the plasma membrane to a distance of 1,000 nm. The numbers of pairwise distances were sorted in 20-nm increments, normalized to the number of gold particles that were analyzed at each increment, and plotted for Fig. 5B in a manner similar to that for the analysis performed for Fig. 2. The average density of M protein labeling relative to G-protein-labeled gold particles was 0.07 particles per 20 nm at 4 hpi and 0.10 particles per 20 nm at 8 hpi (Fig. 5B). There was no change in density of M protein labeling at short distances versus long distances from G-protein-labeled gold particles. This result indicates that M protein and G protein were not localized in the same membrane microdomains in areas of plasma membrane outside the virus budding sites. As a control for colocalization of M protein and G protein, virus budding sites were analyzed in VSV-infected cells double labeled for M protein and G protein. A representative electron micrograph is shown in Fig. 5C. Distances were measured between all M-protein-labeled gold particles and G-protein-labeled particles within virus budding sites, sorted in 20-nm increments, normalized to the number of gold particles that were analyzed at each increment, and plotted for Fig. 5D. The average density of M protein labeling relative to G-protein-labeled gold particles was largely independent of the distance of separation within the microdomains defined by the virus budding sites. This density (0.16 particles per 20 nm [Fig. 5D]) was significantly higher (P < 0.001) than that derived from M protein relative to G protein outside the virus budding sites (0.07 particles per 20 nm [Fig. 5B]). These results support the conclusion that M protein and G protein membrane microdomains are separate outside the virus budding sites and are colocalized inside virus budding sites.
FIG. 5.

Analysis of the organization of M protein and G protein. BHK cells were mock infected or infected with VSV for either 4 or 8 h. Cells were fixed, permeabilized, and double labeled with mouse anti-M protein antibody and rabbit anti-G protein antibody and then with 6 nm colloidal gold anti-mouse IgG and 12 nm colloidal gold anti-rabbit IgG. Cells were prepared for electron microscopy, and 50 electron micrographs (25 per experiment) of arbitrarily chosen plasma membrane were collected. (A) Representative electron micrograph of VSV-infected cells double labeled for M protein and G protein at 4 hpi outside the virus budding sites. (B) Measurements were collected between each 12-nm G-protein-labeled gold particle with every 6-nm M-protein-labeled gold particle within 30 nm of the curvilinear trace of the plasma membrane to a distance of 1,000 nm. The density was calculated as the number of gold particles in 20-nm increments and normalized to the number of gold particles that could have been analyzed at each increment. The normalized density of particles per 20 nm was plotted on the y axis against the distance from the G protein on the x axis in a histogram. Values shown are for 4 hpi (solid horizontal black line and closed circles) and 8 hpi (open circles and broken horizontal black line). (C and D) Electron micrographs of 50 virus budding sites (25 per experiment) were collected from the 4 hpi samples analyzed above in panels A and B. (C) Representative electron micrograph of VSV-infected cells double labeled for M protein and G protein at 4 hpi at virus budding sites. (D) Measurements were collected between each 12-nm G-protein-labeled gold particle within virus budding sites to every 6-nm M-protein-labeled gold particle within virus budding sites. The density was calculated as the number of gold particles in 20-nm increments and normalized to the number of gold particles that could have been analyzed at each increment. The normalized density of particles per 20 nm was plotted on the y axis against the distance from the G protein on the x axis in a histogram. The average density of M-protein-labeled gold particles relative to G-protein-labeled gold particles is represented by a solid horizontal black line. The average density of M protein in the plasma membrane is depicted with a horizontal broken line.
M protein and CD4 protein are not colocalized outside the budding sites.
Some heterologous viral and host membrane proteins are efficiently incorporated into the VSV envelope to form viral pseudotypes. For example, the T-cell antigen CD4 has been shown to readily form pseudotypes with VSV (51). Non-VSV proteins may be incorporated into VSV envelopes due to their association with the same membrane microdomains as VSV proteins. For example, M protein microdomains might also contain CD4. This hypothesis was tested in BHK cells that were infected with a recombinant VSV-CD4. Cells were infected for either 4 or 8 h, were fixed and permeabilized, and were double labeled for M protein with 12 nm colloidal gold and for CD4 protein with 6 nm colloidal gold (Fig. 6A). Measurements were collected between each 12-nm M-protein-labeled gold particle and every 6-nm CD4-labeled gold particle associated with the plasma membrane in 50 micrographs, and the data were analyzed as for Fig. 5 (Fig. 6B). Previous data had indicated that CD4 in BHK cells exists in membrane microdomains that are similar to G-protein-containing microdomains, which are 100 to 150 nm in diameter (12). However, there was no higher density of CD4 immunolabeling at short distances from M-protein-labeled gold particles compared to long distances of separation (Fig. 6B). The average density of CD4 protein labeling relative to M-protein-labeled gold particles was 0.16 particles per 20 nm at 4 hpi and 0.42 particles per 20 nm at 8 hpi (Fig. 6B). The density of CD4 labeling was higher at 8 hpi than at 4 hpi, as reported previously (12). However, at neither time was there evidence that M protein and CD4 were colocalized in the same membrane microdomains.
FIG. 6.

Analysis of the organization of M protein with CD4 protein. BHK cells were mock infected or infected with a recombinant VSV-CD4 for either 4 or 8 h. Cells were fixed, permeabilized, and double labeled with mouse anti-M protein antibody and rat anti-CD4 protein antibody and then with 12 nm colloidal gold anti-mouse IgG and 6 nm colloidal gold anti-rat IgG. Cells were prepared for electron microscopy, and 50 electron micrographs were collected (25 per experiment). (A) Representative electron micrograph of VSV-CD4-infected cells double labeled for M protein and CD4 protein at 4 hpi outside the virus budding sites. (B) Measurements were collected between each 12-nm M-protein-labeled gold particle with every 6-nm CD4-protein-labeled gold particle within 30 nm of the curvilinear trace of the plasma membrane to a distance of 1,000 nm. The density was calculated as the number of gold particles in 20-nm increments and normalized to the number of gold particles that could have been analyzed at each increment. The normalized density of particles per 20 nm was plotted on the y axis against the distance from the M protein on the x axis in a histogram. Closed circles, 4 hpi; open circles, 8 hpi. The average density of CD4-labeled gold particles to M-protein-labeled gold particles is depicted with a horizontal solid black line at 4 hpi and a horizontal broken line at 8 hpi.
Association of G protein, but not M protein, with areas of nucleocapsid accumulation near the plasma membrane.
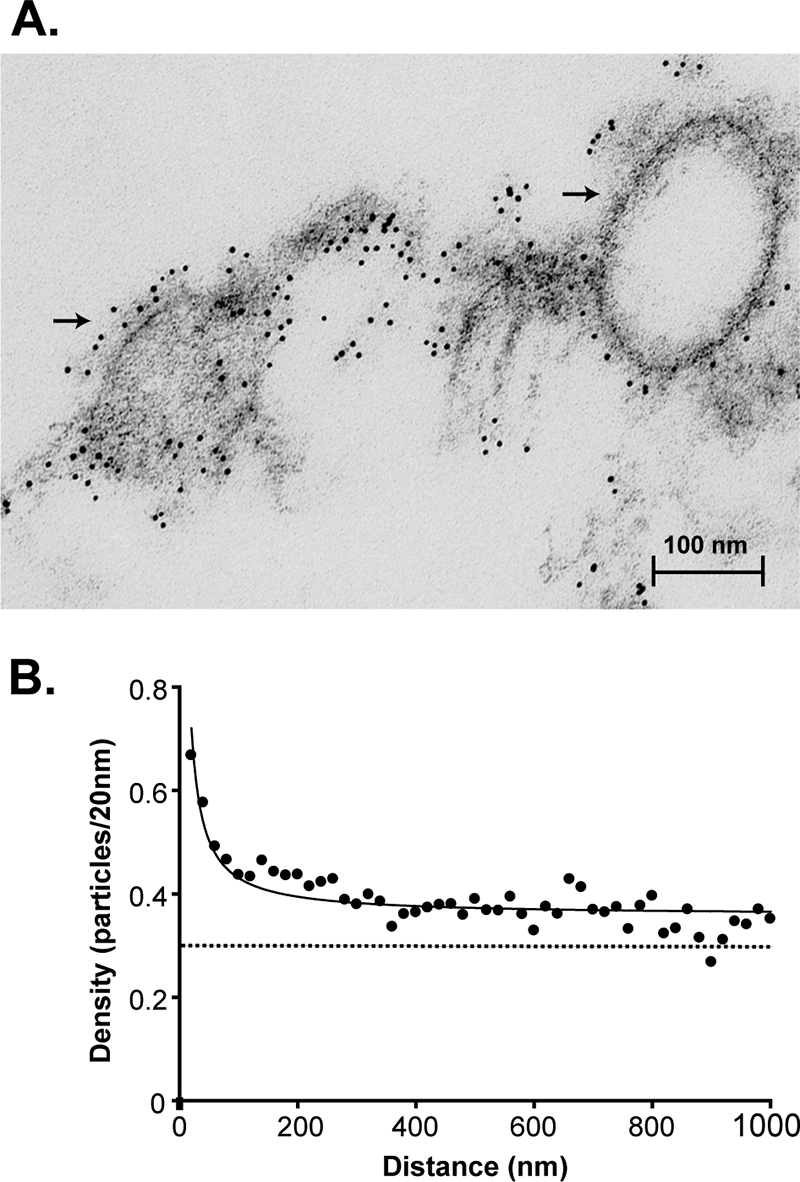
In VSV-infected cells, nucleocapsids often accumulate in focal areas of the cytoplasm. These areas of nucleocapsid accumulation are often closely associated with the plasma membrane. This association is illustrated in Fig. 7A, which shows a confocal micrograph of VSV-infected BHK cells immunolabeled for the viral N protein outside the virus budding sites. The location of areas of intense immunolabeling for N protein in proximity to the plasma membrane suggests that these might be regions of the cell involved in virus assembly. To determine whether M protein or G protein microdomains are colocalized with areas of nucleocapsid accumulation near the plasma membrane, VSV-infected BHK cells were double immunolabeled for N protein and either G protein or M protein. Figure 7B shows a micrograph of a cell double labeled for N protein with 6-nm gold particles and for G protein with 12-nm gold particles. N protein labeling near the plasma membrane was primarily associated with electron-dense structures of several hundred nanometers, which likely represent regions of accumulation of viral nucleocapsids. As in previous experiments, N protein labeling within 30 nm of the trace of the plasma membrane was considered to be due to nucleocapsids associated with the membrane. Distances were measured between each 12-nm G-protein-labeled gold particle and 6-nm N-protein-labeled gold particle within 30 nm of the plasma membrane in 50 micrographs and were analyzed as done for Fig. 5 and 6 (Fig. 7C). Also as before, the average density of N protein labeling near the membrane was calculated as the total number of gold particles associated with membranes divided by the total length of membranes analyzed in the 50 micrographs (0.07 particles per 20 nm [Fig. 7C]). The data for N protein localization in Fig. 7 have more noise than the data for other figures, due in part to the smaller number of gold particles associated with the plasma membrane. In order to facilitate statistical analysis, the data were collected into groups of five data points (20 to 100 nm, 120 to 200 nm, 220 to 300 nm, etc.), and a mean and 95% confidence interval were calculated for each group (Fig. 7D). The density of N protein labeling relative to G-protein-labeled particles was higher than the average density throughout most of the range of distances of separation to approximately 600 nm. The fact that the 95% confidence intervals do not overlap with the average density throughout this range indicates that the differences from the average density were statistically significant (P < 0.05). At distances of separation of >600 nm, the density of N protein labeling was not significantly different from the average density. The distribution of N protein labeling observed in Fig. 7D is the expected result if G protein is preferentially localized in regions of plasma membrane near relatively large (approximately 600-nm) regions of nucleocapsid accumulation.
FIG. 7.

Analysis of the organization of N protein with G protein. (A) BHK cells were mock infected or infected with VSV for 4 h. Cells were fixed, permeabilized, and labeled with mouse anti-N protein antibody, followed by goat anti-mouse antibody conjugated to rhodamine. Cells were imaged using confocal microscopy. (B to D) BHK cells were mock infected or infected with VSV for 4 h. Cells were fixed, permeabilized, and double labeled with mouse anti-N protein antibody and rabbit anti-G protein antibody and then with 6 nm colloidal gold anti-mouse IgG and 12 nm colloidal gold anti-rabbit IgG. Cells were prepared for electron microscopy, and 50 electron micrographs (25 per experiment) of arbitrarily chosen plasma membrane were collected. (B) Representative electron micrograph of VSV-infected cells double labeled for N protein and G protein at 4 hpi outside the virus budding sites. (C and D) Measurements were collected between each 12-nm G-protein-labeled gold particle with every 6-nm N-protein-labeled gold particle within 30 nm of the curvilinear trace of the plasma membrane to a distance of 1,000 nm. (C) The density was calculated as the number of gold particles in 20-nm increments and normalized to the number of gold particles that could have been analyzed at each increment. The normalized density of particles per 20 nm was plotted on the y axis against the distance from the G protein on the x axis in a histogram. The average density of N protein in the plasma membrane is depicted with a horizontal broken line. (D) The density of particles per 20 nm in panel C was pooled into groups of five, and the average density and 95% confidence interval were plotted. The average density of N protein in the plasma membrane is depicted with a horizontal broken line. Error bars indicate standard deviations.
Figure 8 shows results of similar experiments with VSV-infected cells double labeled with 12-nm gold particles for M protein and 6-nm gold particles for N protein. In contrast to the results with G protein (Fig. 7C and D), the density of N protein labeling relative to that of M protein was near the average density in the plasma membrane (0.06 particles per 20 nm [Fig. 8B]) throughout the range of distances of separation. There was a slight downward slope in the data, suggesting that there might be a small degree of preferential N protein labeling at short distances from M protein labeling, but the extent of colocalization of N protein with M protein was not nearly as extensive as that with G protein.
FIG. 8.

Analysis of the organization of N protein with M protein. BHK cells were mock infected or infected with VSV for 4 h. Cells were fixed, permeabilized, and double labeled with mouse anti-N protein antibody and rabbit anti-M protein antibody and then with 6 nm colloidal gold anti-mouse IgG and 12 nm colloidal gold anti-rabbit IgG. Cells were prepared for electron microscopy, and 50 electron micrographs (25 per experiment) of arbitrarily chosen plasma membrane were collected. (A) Representative electron micrograph of VSV-infected cells double labeled for N protein and M protein at 4 hpi outside the virus budding sites. (B) Measurements were collected between each 12-nm M-protein-labeled gold particle with every 6-nm N-protein-labeled gold particle within 30 nm of the curvilinear trace of the plasma membrane to a distance of 1,000 nm. The density was calculated as the number of gold particles in 20-nm increments and normalized to the number of gold particles that could have been analyzed at each increment. The normalized density of particles per 20 nm was plotted on the y axis against the distance from the M protein on the x axis in a histogram. The average density of M-protein-labeled gold particles relative to N-protein-labeled gold particles is represented with a solid horizontal black line. The average density of N protein in the plasma membrane is depicted with a horizontal broken line.
DISCUSSION
The results reported in this study address the lateral organization of the VSV major structural proteins in the host plasma membrane during virus infection. Previous results from our laboratory had shown that the viral G protein is present in membrane microdomains of 100 to 150 nm in diameter (10). In the experiments presented here, we determined that M protein was present in 50- to 100-nm membrane microdomains (Fig. 2) and that M protein microdomains are formed in the absence of other VSV components (Fig. 4). The formation of M protein microdomains is consistent with previous data on the interactions of M protein with model phospholipid bilayers and its behavior in transfected cells. M protein binds to lipids bearing a negative charge (3, 34, 35, 57) and is able to induce curvature in unilamellar vesicles bearing a negative charge (53). M protein has also been shown to induce the lateral segregation of negatively charged lipids in mixed lipid bilayers (34). In addition to lipids, host proteins may be involved in the formation of M protein microdomains. M protein expressed in transfected cells has the ability to bind the plasma membrane and has the inherent ability to release VLP from the plasma membrane (15, 27, 33). The release of VLP involves the interaction of M protein with host Nedd4-like ubiquitin ligases (17, 24-26) that are part of the host cellular multivesicular body machinery, similar to the case for the late budding domains found in other enveloped viruses (7). The ability of VSV M protein to form membrane microdomains in VSV-infected cells as well as in transfected cells is similar to the ability of Ebola virus matrix protein and human immunodeficiency virus gag protein to be incorporated into lipid rafts independently of other viral components (6, 46). However, matrix proteins of other viruses, such as influenza viruses, require the presence of viral envelope glycoproteins in order to associate with the plasma membrane and to be incorporated into lipid rafts (1, 14, 21, 58).
While M protein microdomains outside the virus budding sites were 50 to 100 nm (Fig. 2), M protein microdomains at sites of virus budding were larger, extending approximately 280 nm from the tip of the budding virion, i.e., approximately 560 nm from one side to the other (Fig. 3). This measurement is similar to the amount of membrane required to form the virus envelope, since the circumference of a bullet-shaped particle that is 180 nm long and 70 nm wide is approximately 500 nm. The observation that M protein microdomains are larger at sites of virus budding suggests that M protein microdomains cluster or merge to form virus budding sites. This idea is based on the assumption that plasma membrane M protein outside the budding sites is a precursor to M protein in virions. As pointed out in the introduction, this assumption is supported by pulse-chase results (29). However, it is difficult to rule out an alternative model, in which M protein forms both small (50- to 100-nm) and large (560-nm) microdomains, and the large microdomains form budding sites too quickly to be detected outside the virus budding sites.
Further support for the idea that membrane microdomains must cluster or merge to form virus budding sites comes from analysis of the sizes of G protein microdomains as well as analysis of VSV pseudotype formation with the host protein CD4 (12). G protein and CD4 are present in separate membrane microdomains 100 to 150 nm in diameter in regions of plasma membrane outside the virus budding sites. However, both glycoproteins are present together in larger microdomains at sites of virus budding, suggesting that membrane microdomains containing G protein or CD4 must cluster or merge to form virus budding sites. It was proposed that clustering of these microdomains might be due to the presence of M protein, which would drive the clustering through incorporation into nucleocapsid-M protein complexes during virus assembly (12). However, neither G protein (Fig. 5) nor CD4 (Fig. 6) was colocalized in the same membrane microdomains with M protein outside the budding sites. These results indicate that the enrichment of M protein in G-protein- or CD4-containing microdomains is not involved in the incorporation of these glycoproteins into virus budding sites. It is possible that the incorporation of G protein or CD4 into virus budding sites might be driven by M protein present in these microdomains at a low level. However, it is more likely that another viral or host factor besides M protein drives the clustering of microdomains to form the virus budding site.
The other major structural component involved in VSV assembly besides G protein and M protein is the viral nucleocapsid. Nucleocapsids are assembled during the process of RNA replication and accumulate in focal areas of the cytoplasm near the plasma membrane (Fig. 7A). We examined the localization of membrane-associated N protein with both G protein and M protein at the plasma membrane and found that G protein and N protein were colocalized outside the virus budding sites (Fig. 7). The region of colocalization extended for a distance of approximately 600 nm from the sites of G protein labeling, which is consistent with the size of the regions of nucleocapsid accumulation visible by both confocal and electron microscopy (Fig. 7). The association of the G protein microdomains with these regions of nucleocapsid accumulation may make nucleocapsids competent to recruit M protein and additional G protein into virus budding sites.
In contrast to G protein, there was little if any colocalization of M protein with N protein in regions of plasma membrane outside the virus budding sites (Fig. 8). This result is consistent with previous results from our laboratory, indicating that intracellular nucleocapsids do not bind M protein prior to initiation of the budding process (22). Collectively, the results presented here, together with previous results, suggest a new model for virus assembly (Fig. 9), in which the assembly process is initiated by the association of nucleocapsids with G-protein-containing microdomains. This association may be mediated through viral RNA or a protein whose activity is responsive to sequences in viral RNA, since a cis-acting RNA sequence at the 5′ end of the genome is required for the incorporation of minigenome RNA into virus-like particles (56). A step subsequent to the association with G protein microdomains would make the nucleocapsids competent to bind M protein. The mechanism of this step is unknown, but may involve host factors recruited to the sites of virus assembly, since it has not yet been possible to recreate M protein binding to intracellular nucleocapsids in a cell-free system using only viral components (22; E. A. Flood and D. S. Lyles, unpublished data). Once the assembly of M protein begins, the recruitment of additional M protein into the nucleocapsid-M protein complex occurs rapidly (37). This recruitment step may be responsible for the clustering of M-protein-containing microdomains at the sites of virus assembly (Fig. 9). Such a model in which virus assembly is initiated in G-protein-containing microdomains would be consistent with the observation that the deletion of G protein or its cytoplasmic domain reduces the efficiency of virus assembly (48, 50). This model would also be consistent with the phenotype of temperature-sensitive M protein mutants of VSV, which release spherical particles that contain nucleocapsids but very little M protein (38). Complementation of these mutants with wild-type M protein does not increase the incorporation of nucleocapsids into these particles, but rather converts them to a bullet-like shape due to the formation of nucleocapsid-M protein complexes (38).
FIG. 9.
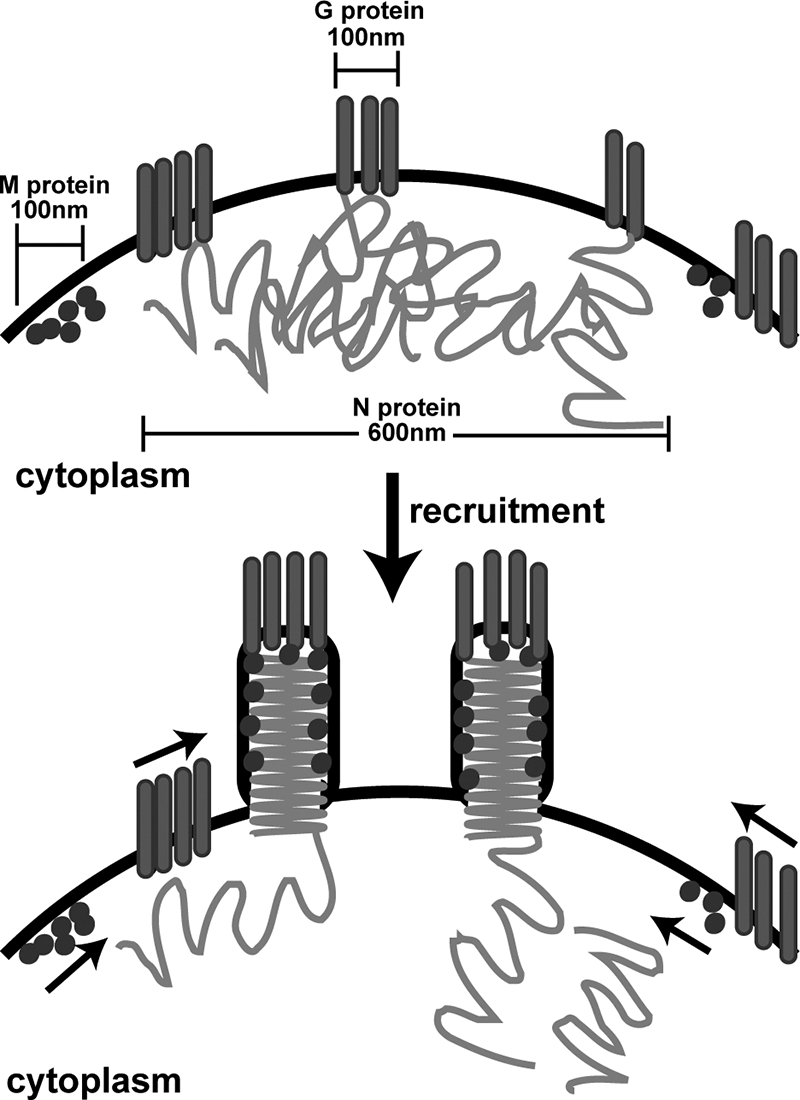
Model for VSV budding by G protein and N protein association and membrane microdomain clustering. M protein and G protein partition into distinct membrane microdomains that are approximately 100 nm in diameter. G protein is preferentially localized in regions of plasma membrane near relatively large (approximately 600-nm) regions of nucleocapsid accumulation. We propose that virus assembly is initiated by the association of N protein with G protein. Next, the recruitment of M protein into nucleocapsid-M protein complexes induces the clustering of M protein and additional G protein microdomains into the virus budding sites.
The concept of membrane microdomain clustering presented here is analogous to the clustering of membrane microdomains in other well-studied systems, such as the T-cell receptor signaling complex. Upon T-cell activation, the T-cell receptor is recruited into the “immunological synapse,” a group of clustered lipid rafts containing immunoreceptor signaling components, adaptor proteins, and cell adhesion proteins, which are present prior to signaling in separate smaller membrane microdomains (20). Similarly, the assembly of virus budding sites from separate membrane microdomains may require a sequence of steps or “signals” that bring the different microdomains together to form a virus budding site.
Acknowledgments
We acknowledge the Microscopy Core Laboratory, especially Ken Grant for his expert technical assistance with the electron microscope and Paula Moore and Bilinda Dawson for assistance with the preparation of the electron microscopy samples. We also thank Mark Lively, Linda McPhail, David Ornelles, Gregory Shelness, Maryam Ahmed, and Cassandra Lambeth for critical advice.
This research was supported by Public Health Service grant AI15892 from the National Institute for Allergy and Infectious Diseases. The Microscopy Core Laboratory is supported in part by the core grant for the Comprehensive Cancer Center of Wake Forest University CA12197 from the National Cancer Institute.
Footnotes
Published ahead of print on 26 March 2008.
REFERENCES
- 1.Ali, A., R. T. Avalos, E. Ponimaskin, and D. P. Nayak. 2000. Influenza virus assembly: effect of influenza virus glycoproteins on the membrane association of M1 protein. J. Virol. 748709-8719. [DOI] [PMC free article] [PubMed] [Google Scholar]
- 2.Anderson, R. G., and K. Jacobson. 2002. A role for lipid shells in targeting proteins to caveolae, rafts, and other lipid domains. Science 2961821-1825. [DOI] [PubMed] [Google Scholar]
- 3.Baudin, F., I. Petit, W. Weissenhorn, and R. W. Ruigrok. 2001. In vitro dissection of the membrane and RNP binding activities of influenza virus M1 protein. Virology 281102-108. [DOI] [PubMed] [Google Scholar]
- 4.Bavari, S., C. M. Bosio, E. Wiegand, G. Ruthel, A. B. Will, T. W. Geisbert, M. Hevey, C. Schmaljohn, A. Schmaljohn, and M. J. Aman. 2002. Lipid raft microdomains: a gateway for compartmentalized trafficking of Ebola and Marburg viruses. J. Exp. Med. 195593-602. [DOI] [PMC free article] [PubMed] [Google Scholar]
- 5.Bergmann, J. E., and P. J. Fusco. 1988. The M protein of vesicular stomatitis virus associates specifically with the basolateral membranes of polarized epithelial cells independently of the G protein. J. Cell Biol. 1071707-1715. [DOI] [PMC free article] [PubMed] [Google Scholar]
- 6.Bhattacharya, J., A. Repik, and P. R. Clapham. 2006. Gag regulates association of human immunodeficiency virus type 1 envelope with detergent-resistant membranes. J. Virol. 805292-5300. [DOI] [PMC free article] [PubMed] [Google Scholar]
- 7.Bieniasz, P. D. 2006. Late budding domains and host proteins in enveloped virus release. Virology 34455-63. [DOI] [PubMed] [Google Scholar]
- 8.Black, B. L., R. B. Rhodes, M. McKenzie, and D. S. Lyles. 1993. The role of vesicular stomatitis virus matrix protein in inhibition of host-directed gene expression is genetically separable from its function in virus assembly. J. Virol. 674814-4821. [DOI] [PMC free article] [PubMed] [Google Scholar]
- 9.Brown, D. A., and E. London. 1997. Structure of detergent-resistant membrane domains: does phase separation occur in biological membranes? Biochem. Biophys. Res. Commun. 2401-7. [DOI] [PubMed] [Google Scholar]
- 10.Brown, E. L., and D. S. Lyles. 2003. A novel method for analysis of membrane microdomains: vesicular stomatitis virus glycoprotein microdomains change in size during infection, and those outside of budding sites resemble sites of virus budding. Virology 310343-358. [DOI] [PubMed] [Google Scholar]
- 11.Brown, E. L., and D. S. Lyles. 2003. Organization of the vesicular stomatitis virus glycoprotein into membrane microdomains occurs independently of intracellular viral components. J. Virol. 773985-3992. [DOI] [PMC free article] [PubMed] [Google Scholar]
- 12.Brown, E. L., and D. S. Lyles. 2005. Pseudotypes of vesicular stomatitis virus with CD4 formed by clustering of membrane microdomains during budding. J. Virol. 797077-7086. [DOI] [PMC free article] [PubMed] [Google Scholar]
- 13.Chazal, N., and D. Gerlier. 2003. Virus entry, assembly, budding, and membrane rafts. Microbiol. Mol. Biol. Rev. 67226-237. [DOI] [PMC free article] [PubMed] [Google Scholar]
- 14.Chen, B. J., G. P. Leser, E. Morita, and R. A. Lamb. 2007. Influenza virus hemagglutinin and neuraminidase, but not the matrix protein, are required for assembly and budding of plasmid-derived virus-like particles. J. Virol. 817111-7123. [DOI] [PMC free article] [PubMed] [Google Scholar]
- 15.Chong, L. D., and J. K. Rose. 1993. Membrane association of functional vesicular stomatitis virus matrix protein in vivo. J. Virol. 67407-414. [DOI] [PMC free article] [PubMed] [Google Scholar]
- 16.Connor, J. H., M. O. McKenzie, and D. S. Lyles. 2006. Role of residues 121 to 124 of vesicular stomatitis virus matrix protein in virus assembly and virus-host interaction. J. Virol. 803701-3711. [DOI] [PMC free article] [PubMed] [Google Scholar]
- 17.Craven, R. C., R. N. Harty, J. Paragas, P. Palese, and J. W. Wills. 1999. Late domain function identified in the vesicular stomatitis virus M protein by use of rhabdovirus-retrovirus chimeras. J. Virol. 733359-3365. [DOI] [PMC free article] [PubMed] [Google Scholar]
- 18.Dolganiuc, V., L. McGinnes, E. J. Luna, and T. G. Morrison. 2003. Role of the cytoplasmic domain of the Newcastle disease virus fusion protein in association with lipid rafts. J. Virol. 7712968-12979. [DOI] [PMC free article] [PubMed] [Google Scholar]
- 19.Dubovi, E. J., and R. R. Wagner. 1977. Spatial relationships of the proteins of vesicular stomatitis virus: induction of reversible oligomers by cleavable protein cross-linkers and oxidation. J. Virol. 22500-509. [DOI] [PMC free article] [PubMed] [Google Scholar]
- 20.Dykstra, M., A. Cherukuri, H. W. Sohn, S. J. Tzeng, and S. K. Pierce. 2003. Location is everything: lipid rafts and immune cell signaling. Annu. Rev. Immunol. 21457-481. [DOI] [PubMed] [Google Scholar]
- 21.Enami, M., and K. Enami. 1996. Influenza virus hemagglutinin and neuraminidase glycoproteins stimulate the membrane association of the matrix protein. J. Virol. 706653-6657. [DOI] [PMC free article] [PubMed] [Google Scholar]
- 22.Flood, E. A., and D. S. Lyles. 1999. Assembly of nucleocapsids with cytosolic and membrane-derived matrix proteins of vesicular stomatitis virus. Virology 261295-308. [DOI] [PubMed] [Google Scholar]
- 23.Harder, T., P. Scheiffele, P. Verkade, and K. Simons. 1998. Lipid domain structure of the plasma membrane revealed by patching of membrane components. J. Cell Biol. 141929-942. [DOI] [PMC free article] [PubMed] [Google Scholar]
- 24.Harty, R. N., M. E. Brown, J. P. McGettigan, G. Wang, H. R. Jayakar, J. M. Huibregtse, M. A. Whitt, and M. J. Schnell. 2001. Rhabdoviruses and the cellular ubiquitin-proteasome system: a budding interaction. J. Virol. 7510623-10629. [DOI] [PMC free article] [PubMed] [Google Scholar]
- 25.Harty, R. N., J. Paragas, M. Sudol, and P. Palese. 1999. A proline-rich motif within the matrix protein of vesicular stomatitis virus and rabies virus interacts with WW domains of cellular proteins: implications for viral budding. J. Virol. 732921-2929. [DOI] [PMC free article] [PubMed] [Google Scholar]
- 26.Jayakar, H. R., K. G. Murti, and M. A. Whitt. 2000. Mutations in the PPPY motif of vesicular stomatitis virus matrix protein reduce virus budding by inhibiting a late step in virion release. J. Virol. 749818-9827. [DOI] [PMC free article] [PubMed] [Google Scholar]
- 27.Justice, P. A., W. Sun, Y. Li, Z. Ye, P. R. Grigera, and R. R. Wagner. 1995. Membrane vesiculation function and exocytosis of wild-type and mutant matrix proteins of vesicular stomatitis virus. J. Virol. 693156-3160. [DOI] [PMC free article] [PubMed] [Google Scholar]
- 28.Kaptur, P. E., R. B. Rhodes, and D. S. Lyles. 1991. Sequences of the vesicular stomatitis virus matrix protein involved in binding to nucleocapsids. J. Virol. 651057-1065. [DOI] [PMC free article] [PubMed] [Google Scholar]
- 29.Knipe, D. M., D. Baltimore, and H. F. Lodish. 1977. Separate pathways of maturation of the major structural proteins of vesicular stomatitis virus. J. Virol. 211128-1139. [DOI] [PMC free article] [PubMed] [Google Scholar]
- 30.Laliberte, J. P., L. W. McGinnes, M. E. Peeples, and T. G. Morrison. 2006. Integrity of membrane lipid rafts is necessary for the ordered assembly and release of infectious Newcastle disease virus particles. J. Virol. 8010652-10662. [DOI] [PMC free article] [PubMed] [Google Scholar]
- 31.Lefrancois, L., and D. S. Lyles. 1982. The interaction of antibody with the major surface glycoprotein of vesicular stomatitis virus. II. Monoclonal antibodies of nonneutralizing and cross-reactive epitopes of Indiana and New Jersey serotypes. Virology 121168-174. [DOI] [PubMed] [Google Scholar]
- 32.Leser, G. P., and R. A. Lamb. 2005. Influenza virus assembly and budding in raft-derived microdomains: a quantitative analysis of the surface distribution of HA, NA and M2 proteins. Virology 342215-227. [DOI] [PubMed] [Google Scholar]
- 33.Li, Y., L. Luo, M. Schubert, R. R. Wagner, and C. Y. Kang. 1993. Viral liposomes released from insect cells infected with recombinant baculovirus expressing the matrix protein of vesicular stomatitis virus. J. Virol. 674415-4420. [DOI] [PMC free article] [PubMed] [Google Scholar]
- 34.Luan, P., and M. Glaser. 1994. Formation of membrane domains by the envelope proteins of vesicular stomatitis virus. Biochemistry 334483-4489. [DOI] [PubMed] [Google Scholar]
- 35.Luan, P., L. Yang, and M. Glaser. 1995. Formation of membrane domains created during the budding of vesicular stomatitis virus. A model for selective lipid and protein sorting in biological membranes. Biochemistry 349874-9883. [DOI] [PubMed] [Google Scholar]
- 36.Lyles, D. S., M. McKenzie, and J. W. Parce. 1992. Subunit interactions of vesicular stomatitis virus envelope glycoprotein stabilized by binding to viral matrix protein. J. Virol. 66349-358. [DOI] [PMC free article] [PubMed] [Google Scholar]
- 37.Lyles, D. S., and M. O. McKenzie. 1998. Reversible and irreversible steps in assembly and disassembly of vesicular stomatitis virus: equilibria and kinetics of dissociation of nucleocapsid-M protein complexes assembled in vivo. Biochemistry 37439-450. [DOI] [PubMed] [Google Scholar]
- 38.Lyles, D. S., M. O. McKenzie, P. E. Kaptur, K. W. Grant, and W. G. Jerome. 1996. Complementation of M gene mutants of vesicular stomatitis virus by plasmid-derived M protein converts spherical extracellular particles into native bullet shapes. Virology 21776-87. [DOI] [PubMed] [Google Scholar]
- 39.Lyles, D. S., L. Puddington, and B. J. McCreedy, Jr. 1988. Vesicular stomatitis virus M protein in the nuclei of infected cells. J. Virol. 624387-4392. [DOI] [PMC free article] [PubMed] [Google Scholar]
- 40.Manié, S. N., S. Debreyne, S. Vincent, and D. Gerlier. 2000. Measles virus structural components are enriched into lipid raft microdomains: a potential cellular location for virus assembly. J. Virol. 74305-311. [DOI] [PMC free article] [PubMed] [Google Scholar]
- 41.Marty, A., J. Meanger, J. Mills, B. Shields, and R. Ghildyal. 2004. Association of matrix protein of respiratory syncytial virus with the host cell membrane of infected cells. Arch. Virol. 149199-210. [DOI] [PubMed] [Google Scholar]
- 42.McCreedy, B. J., Jr., and D. S. Lyles. 1989. Distribution of M protein and nucleocapsid protein of vesicular stomatitis virus in infected cell plasma membranes. Virus Res. 14189-205. [DOI] [PubMed] [Google Scholar]
- 43.Nguyen, D. H., and J. E. Hildreth. 2000. Evidence for budding of human immunodeficiency virus type 1 selectively from glycolipid-enriched membrane lipid rafts. J. Virol. 743264-3272. [DOI] [PMC free article] [PubMed] [Google Scholar]
- 44.Ohno, S., and N. Ohtake. 1987. Immunocytochemical study of the intracellular localization of M protein of vesicular stomatitis virus. Histochem. J. 19297-306. [DOI] [PubMed] [Google Scholar]
- 45.Ono, A., and E. O. Freed. 2001. Plasma membrane rafts play a critical role in HIV-1 assembly and release. Proc. Natl. Acad. Sci. USA 9813925-13930. [DOI] [PMC free article] [PubMed] [Google Scholar]
- 46.Panchal, R. G., G. Ruthel, T. A. Kenny, G. H. Kallstrom, D. Lane, S. S. Badie, L. Li, S. Bavari, and M. J. Aman. 2003. In vivo oligomerization and raft localization of Ebola virus protein VP40 during vesicular budding. Proc. Natl. Acad. Sci. USA 10015936-15941. [DOI] [PMC free article] [PubMed] [Google Scholar]
- 47.Pickl, W. F., F. X. Pimentel-Muinos, and B. Seed. 2001. Lipid rafts and pseudotyping. J. Virol. 757175-7183. [DOI] [PMC free article] [PubMed] [Google Scholar]
- 48.Robison, C. S., and M. A. Whitt. 2000. The membrane-proximal stem region of vesicular stomatitis virus G protein confers efficient virus assembly. J. Virol. 742239-2246. [DOI] [PMC free article] [PubMed] [Google Scholar]
- 49.Scheiffele, P., A. Rietveld, T. Wilk, and K. Simons. 1999. Influenza viruses select ordered lipid domains during budding from the plasma membrane. J. Biol. Chem. 2742038-2044. [DOI] [PubMed] [Google Scholar]
- 50.Schnell, M. J., L. Buonocore, E. Boritz, H. P. Ghosh, R. Chernish, and J. K. Rose. 1998. Requirement for a non-specific glycoprotein cytoplasmic domain sequence to drive efficient budding of vesicular stomatitis virus. EMBO J. 171289-1296. [DOI] [PMC free article] [PubMed] [Google Scholar]
- 51.Schnell, M. J., L. Buonocore, E. Kretzschmar, E. Johnson, and J. K. Rose. 1996. Foreign glycoproteins expressed from recombinant vesicular stomatitis viruses are incorporated efficiently into virus particles. Proc. Natl. Acad. Sci. USA 9311359-11365. [DOI] [PMC free article] [PubMed] [Google Scholar]
- 52.Simons, K., and E. Ikonen. 1997. Functional rafts in cell membranes. Nature 387569-572. [DOI] [PubMed] [Google Scholar]
- 53.Solon, J., O. Gareil, P. Bassereau, and Y. Gaudin. 2005. Membrane deformations induced by the matrix protein of vesicular stomatitis virus in a minimal system. J. Gen. Virol. 863357-3363. [DOI] [PubMed] [Google Scholar]
- 54.Suomalainen, M. 2002. Lipid rafts and assembly of enveloped viruses. Traffic 3705-709. [DOI] [PubMed] [Google Scholar]
- 55.Vincent, S., D. Gerlier, and S. N. Manie. 2000. Measles virus assembly within membrane rafts. J. Virol. 749911-9915. [DOI] [PMC free article] [PubMed] [Google Scholar]
- 56.Whelan, S. P., and G. W. Wertz. 1999. The 5′ terminal trailer region of vesicular stomatitis virus contains a position-dependent cis-acting signal for assembly of RNA into infectious particles. J. Virol. 73307-315. [DOI] [PMC free article] [PubMed] [Google Scholar]
- 57.Zakowski, J. J., W. A. Petri, Jr., and R. R. Wagner. 1981. Role of matrix protein in assembling the membrane of vesicular stomatitis virus: reconstitution of matrix protein with negatively charged phospholipid vesicles. Biochemistry 203902-3907. [DOI] [PubMed] [Google Scholar]
- 58.Zhang, J., A. Pekosz, and R. A. Lamb. 2000. Influenza virus assembly and lipid raft microdomains: a role for the cytoplasmic tails of the spike glycoproteins. J. Virol. 744634-4644. [DOI] [PMC free article] [PubMed] [Google Scholar]