

Abstract
Objectives
To describe the frequency of pepsin-positive tracheal secretions (a proxy for the aspiration of gastric contents), outcomes associated with aspiration (including a positive Clinical Pulmonary Infection Score [a proxy for pneumonia] and use of hospital resources), and risk factors associated with aspiration and pneumonia in a population of critically ill tube-fed patients.
Design
Prospective descriptive study conducted over a 2-yr period.
Setting
Five intensive care units in a university-affiliated medical center with level I trauma status.
Patients
Each of the 360 adult patients participated for 4 days. Among the inclusion criteria were mechanical ventilation and tube feedings. An exclusion criterion was physician-diagnosed pneumonia at the time of enrollment.
Intervention
None.
Measurements and Major Results
Almost 6,000 tracheal secretions collected during routine suctioning were assayed for pepsin; of these, 31.3% were positive. At least one aspiration event was identified in 88.9% (n = 320) of the participants. The incidence of pneumonia (as determined by the Clinical Pulmonary Infection Score) increased from 24% on day 1 to 48% on day 4. Patients with pneumonia on day 4 had a significantly higher percentage of pepsin-positive tracheal secretions than did those without pneumonia (42.2% vs. 21.1%, respectively; p < .001). Length of stay in the intensive care unit and need for ventilator support were significantly greater for patients with pneumonia (p < .01). A low backrest elevation was a risk factor for aspiration (p = .024) and pneumonia (p = .018). Other risk factors for aspiration included vomiting (p = .007), gastric feedings (p = .009), a Glasgow Coma Scale score <9 (p = .021), and gastroesophageal reflux disease (p = .033). The most significant independent risk factors for pneumonia were aspiration (p < .001), use of paralytic agents (p = .002), and a high sedation level (p = .039).
Conclusions
Aspiration of gastric contents is common in critically ill tube-fed patients and is a major risk factor for pneumonia. Furthermore, it leads to greater use of hospital resources. Modifiable risk factors for aspiration need to be addressed.
Keywords: critical illness, enteral nutrition, aspiration pneumonia, risk factors, gastroesophageal reflux, gastric emptying
Tracheobronchial aspiration can be defined as the inhalation of oropharyngeal or gastric contents into the respiratory tract (1). Although aspiration from either source is important, the type of greatest concern in critically ill tube-fed patients is tracheobronchial aspiration of gastric contents. The extent to which aspiration of gastric contents occurs is difficult to determine, primarily because most clinical studies have relied on flawed detection methods (such as observing tracheal secretions for dye-stained formula or glucose) (2–7). Nonetheless, there is evidence that it is a formidable problem. For example, a recent study found that 30 of 40 critically ill patients who received enteral formula stained with yellow microscopic beads had at least one episode of aspiration (as defined by detection of a yellow color in tracheal secretions by fluorometry) (8). The mean percentage of samples containing colored beads was 22.1% (range, 0% to 94%).
Aspiration of gastric contents is a recognized risk factor for ventilator-associated pneumonia in critically ill patients (9–12). However, more information is needed to determine the extent to which the frequency of tracheobronchial aspiration of gastric contents predisposes to pneumonia and other adverse outcomes. This was an analysis to determine the occurrence of aspiration as a risk factor for pneumonia and as a determinant of clinical outcomes in comparison with other factors.
Specific Objectives
In a population of critically ill tube-fed patients, specific objectives of the study were to describe the frequency of pepsin-positive tracheal secretions (a proxy for the aspiration of gastric contents), the outcomes associated with aspiration (including a positive Clinical Pulmonary Infection Score [a proxy for pneumonia] and use of hospital resources), and the risk factors associated with aspiration and pneumonia.
MATERIALS AND METHODS
This prospective descriptive study was conducted between November 2002 and December 2004 in five intensive care units (ICUs) in a Midwestern university-affiliated medical center with level I trauma status. Approval was received from the appropriate institutional review board before initiation of the study, and written informed consent was obtained from patients or their legal guardians.
Description of Sample
Demographic information pertaining to the final sample of 360 patients is provided in Table 1. (Reasons for failure of an additional 186 patients to complete the study are also included in Table 1.) Inclusion criteria were admission to one of the five ICUs at the study site, mechanical ventilation, feeding by a nasally or orally placed tube or gastrostomy, and complete data for all of the variables of interest. Exclusion criteria were physician-diagnosed pneumonia at the time of enrollment and use of jejunostomy feedings. (The rationale for the latter was to avoid possible occlusion of small-caliber jejunostomy tubes by frequent residual volume measurements.) Informed consent was sought for all patients who met the inclusion criteria. Although subject availability varied, three patients were usually enrolled simultaneously at any given time. A summary of treatment conditions is presented in Table 2. None of the patients had endotracheal tubes that allowed continuous aspiration of subglottic secretions.
Table 1.
Demographic information
| Variable | No. (%) of Patients |
|---|---|
| Final sample | 360 |
| Enrolled but failed to complete study because of | 186 |
| Extubation | 104 |
| Discontinuation of tube feedings | 28 |
| Death or withdrawal of care | 27 |
| Problems with specimen preparation or storage | 20 |
| Lapse in data collection due to inclement weather | 4 |
| Withdrawal of consent from family | 3 |
| Age, yrs, mean ± SD (range) | 52.2 ± 18.1 (18–95) |
| Gender | |
| Male | 215 (59.7) |
| Female | 145 (40.3) |
| Intensive care unit from which enrolled: | |
| Trauma/surgery | 121 (33.6) |
| Neurosurgery/neuromedicine | 115 (31.9) |
| General medicine | 58 (16.1) |
| Cardiac surgery | 38 (10.6) |
| Cardiac medicine | 28 (7.8) |
| APACHE II score on admission, mean ± SD (range) | 22.8 ± 6.3 (8–41) |
| GERD diagnosed prior to admission | 30 (8.3) |
| Gastroparesis diagnosed prior to admission | 2 (0.6) |
APACHE, Acute Physiology and Chronic Health Evaluation; GERD, gastroesophageal reflux disease.
Table 2.
Description of treatment conditions (n = 360)
| Condition | No. (%) of Patients |
|---|---|
| Feeding site | |
| Stomach throughout duration of study | 182 (50.6) |
| Small bowel throughout duration of study | 141 (39.2) |
| Switch from small bowel to stomach | 24 (6.7) |
| Switch from stomach to small bowel | 13 (3.6) |
| Type of feeding device in gastric-fed patients at time of enrollment in study | |
| 14- to 18-Fr polyvinyl chloride nasogastric or orogastric sump tubes | 91 |
| 10-Fr polyurethane nasally or orally inserted tubes | 88 |
| 20-Fr gastrostomy tube | 16 |
| Type of feeding device in small bowel-fed patients at time of enrollment of study | |
| 10-Fr polyurethane nasally or orally inserted tubes | 165 |
| Combination of tracheostomy/gastrostomy performed prior to enrollment in study | 9 |
| Enteral formula administration | |
| No. of days in ICU before feedings started, mean ± SD (range) | 3.3 ± 1.7 (1–10) |
| Enrolled during first day of tube feedings | 262 (72.8) |
| Start rate, mean ± SD | 22.8 ± 11.1 mL/hr |
| Advancement rate, mean ± SD | 17.2 ± 8.4 mL/hr |
| Maximal rate, mean ± SD | 54.9 ± 18.6 mL/hr |
| No. of patients with mean backrest elevation, in degrees | |
| ≥30 | 137 (38.1) |
| ≥40 | 22 (6.1) |
| ≥45 | 5 (1.4) |
| Use of stress ulcer prophylaxis | |
| H2 receptor antagonist | 264 (73.3) |
| Proton pump inhibitor | 94 (26.1) |
| Sucralfate | 2 (0.6) |
| Use of prokinetics | |
| None | 198 (55.0) |
| Metoclopramide | 151 (41.9) |
| Erythromycin | 8 (2.2) |
| Combination of metoclopramide and erythromycin | 3 (0.8) |
| Use of opioids | 256 (71.1) |
| Use of paralytics | 103 (28.6) |
| Use of gastric suction during small-bowel feedings | 44 |
Fr, French; ICU, intensive care unit.
Data Collection
Research nurses were present daily from 0800 through 2400 to prospectively collect data; measurements made during the study are summarized in Table 3. Bedside nurses collected specimens in sputum traps when suctioning was performed for therapeutic purposes on days 1, 2, and 3. The secretions were saved and given to the investigators, who prepared them for storage and eventual pepsin analysis. The mean number of secretions obtained per patient was 13.6 (range, 4–28). No secretions were obtained between 2400 and 0800 because of the lack of a data collector; in addition, an average of 2.3 specimens per patient were lost for other reasons (including failure of the bedside nurse to save specimens, unavailability of patients transported out of the ICU for tests, and occasional technical problems encountered during preparation of specimens).
Table 3.
Summary of measurements
| Measurement | Frequency |
|---|---|
| Assay of sputum for pepsin | Samples collected at time of routine suctioning between 0800 and 2400 on days 1, 2, and 3 |
| Clinical pulmonary infection score | Days 1, 2, 3, and 4 |
| Angle of backrest elevation | Hourly between 0800 and 2400 on days 1, 2, and 3 |
| Level of consciousness | Every 4 hrs between 0800 and 2400 on days 1, 2, and 3 |
| Level of sedation | |
| Site of feeding tube | |
| Residual volume from feeding tube | |
| Presence of vomiting | |
| Presence of gastric suction | |
| Use of paralytic agents | |
| Use of prokinetics | |
| Use of opioids | |
| APACHE II score | At time of admission to ICU |
| Hospital length of stay | At time of discharge or death |
| ICU length of stay | |
| Ventilator days |
APACHE, Acute Physiology and Chronic Health Evaluation; ICU, intensive care unit.
Pepsin Immunoassay
An immunoassay with rooster polyclonal antibodies to purified human pepsin was used to detect pepsin in the suctioned tracheal secretions. The procedure for the assay has been described previously; in an animal model, the assay was found to have a sensitivity of 93% and a specificity of 100% (13). Within 1 hr after collection, each secretion was prepared in a research laboratory for later analysis. Homogenization of the specimen preceded mixing (1:1) with Laemmli Sample Buffer and boiling for 5 mins before it was floated in a sonicator for 5 mins. Following these procedures, the specimen was frozen at −20°C until the assay was performed. The assay can detect pepsin in a concentration as low as 1 μg/mL. Gels were read by the biochemist (YHC), who was blinded to the patients’ clinical status; results were recorded as positive or negative.
Clinical Pulmonary Infection Score
The presence of ventilator-associated pneumonia was determined with a simplified version of the Clinical Pulmonary Infection Score (CPIS), as described by Luna et al. (14). This assessment was calculated on days 1, 2, 3, and 4 to identify patients with ventilator-associated pneumonia. The calculation was made by using the variables and scoring method displayed in Table 4. Data regarding infiltrates were obtained from radiographic reports. The first blood gas measurement of the day was used to calculate the oxygenation PaO2/FIO2 ratio. The volume and appearance of tracheal secretions were estimated by bedside nurses. Blood leukocyte data were obtained from laboratory reports, and temperature data were obtained from the medical record. Provided an infiltrate was present, a CPIS score ≥6 was used as a proxy for ventilator-associated pneumonia.
Table 4.
Simplified clinical pulmonary infection score
| Component | Value | Points |
|---|---|---|
| Temperature, °C | ≥36.5 and ≤38.4 | 0 |
| ≥38.5 and ≤38.9 | 1 | |
| ≥39.0 and ≤36.0 | 2 | |
| Blood leukocytes per mm3 | ≥4000 and ≤11,000 | 0 |
| <4000 or >11,000 | 1 | |
| Tracheal secretions | Few | 0 |
| Moderate | 1 | |
| Large | 2 | |
| Purulent | +1 | |
| Oxygenation: PaO2/FIO2 mm Hg | >240 or presence of ARDS | 0 |
| ≤240 and absence of ARDS | 2 | |
| Chest radiograph | No infiltrate | 0 |
| Patchy or diffuse infiltrate | 1 | |
| Localized infiltrate | 2 |
ARDS, acute respiratory distress syndrome. Table data are from (14).
Lengths of Stay and Ventilator Usage
Charts were reviewed in the Medical Records Department to calculate the hospital and ICU lengths of stay and the number of ventilator days.
Angle of Backrest Elevation
The angle of backrest elevation was determined on the hour from 0800 through 2400 on days 1, 2, and 3. Stryker Apex or Stryker EPIC II (+) Critical Care Beds (Stryker Medical, Kalamazoo, MI), used for all of the patients, had a mechanism whereby a digital read-out of backrest elevation could be obtained. Comparisons (n = 1,002) made between the bed readouts and those obtained from a handheld angle reader showed a strong positive correlation (Pearson r = .87; p < .001). The mean bed read-outs tended to be higher than the mean readings obtained from the handheld device (21.3 ± 13.3 vs. 18.9 ± 11.7). Fewer than 1% of the comparisons were outside the 95% individual confidence interval.
Level of Consciousness
The Glasgow Coma Scale (GCS), adjusted for use with intubated patients, was used to assess the level of consciousness.
Level of Sedation
The Vancouver Interaction and Calmness Scale (VICS) was used to assess the level of sedation (Table 5). This scale was specifically developed for use with adult, critically ill, mechanically ventilated patients and consists of two five-item subscales quantifying interaction along a continuum of 5 to 30 points; the total range of scores is from 10 to 60 (15). A low score indicates a high level of sedation.
Table 5.
Vancouver Interaction and Calmness Scale (VICS)
| Score (Range) | Strongly Agree | Agree | Mildly Agree | Mildly Disagree | Disagree | Strongly Disagree |
|---|---|---|---|---|---|---|
| Interaction (5–30) | ||||||
| Patient interacts | 6 | 5 | 4 | 3 | 2 | 1 |
| Patient communicates | 6 | 5 | 4 | 3 | 2 | 1 |
| Information communicated by patients is reliable | 6 | 5 | 4 | 3 | 2 | 1 |
| Patient cooperates | 6 | 5 | 4 | 3 | 2 | 1 |
| Patient needs encouragement to respond to questions | 1 | 2 | 3 | 4 | 5 | 6 |
| Calmness (5–30) | ||||||
| Patient appears calm | 6 | 5 | 4 | 3 | 2 | 1 |
| Patient appears restless | 1 | 2 | 3 | 4 | 5 | 6 |
| Patient appears distressed | 1 | 2 | 3 | 4 | 5 | 6 |
| Patient is moving around uneasily in bed | 1 | 2 | 3 | 4 | 5 | 6 |
| Patient is pulling at lines/tubes | 1 | 2 | 3 | 4 | 5 | 6 |
Best possible total score, 60; worst possible total score, 10.
Feeding Tube Site
Treating physicians determined the desired feeding site. Approximately 93% (n = 336) of the feeding tubes were inserted blindly at the bedside by nurses; the remainder were inserted by physicians under fluoroscopy or during special procedures. Tube site was determined by radiography at the time of insertion; subsequent radiographs were reviewed to determine whether tube location changed during the 3-day observation period. Bedside assessments for tube location (including pH testing of aspirates and measurement of external tubing length) were performed at 4-hr intervals.
Gastric Residual Volume
Sixty-milliliter syringes were used to measure residual volumes from the feeding tubes. The policy of the institution where the study was conducted called for returning a gastric residual volume (GRV) ≤200 mL to the patient; any amount greater than 200 mL was discarded.
Other Observations
The number of vomiting episodes and the frequency with which gastric suction was used were determined by observation and by interviewing bedside nurses who provided direct care. Chart reviews were used to assess the frequency with which paralytic agents, prokinetic agents, and opioids were used.
Data Analysis
The percentage of secretions positive for pepsin was calculated for each patient. In addition, patients were divided into two groups: infrequent aspirators (those having 0% to 25% pepsin-positive tracheal secretions) and frequent aspirators (those having >25% pepsin-positive tracheal secretions). The percentages assigned to patients in each group were averaged so that group comparisons could be made. For the effect size of 0.98, sample size (n = 360), and alpha <0.01 two-tailed, power is 100% to detect a relationship between aspiration and pneumonia.
Continuous variables were described by mean ± SD; categorical level variables were described by frequencies and percents. Statistically significant differences for the incidence of aspiration and the presence/absence of pneumonia were determined by the independent-samples Student’s t-test; nonparametric equivalent statistical methods were used when assumptions for parametric methods were not met. The chi-square test was used to assess associations between dichotomized variables. The Fisher’s exact test was used when the sample size was too low to meet the criteria for use of the chi-square test. A backward stepwise logistic regression analysis was also used to assess the significance of selected risk factors for aspiration and pneumonia. Statistical significance was evaluated at alpha levels <.05, <.01, and <.001 (two-tailed). Risk factors included in the multivariate logistic regression were selected according to two criteria: clinical relevance and statistical significance <.05. Statistical software (SPSS 12.0, SPSS, Chicago, IL) was used for all analyses.
RESULTS
Frequency of Aspiration
A total of 5,857 tracheal secretions were assayed for pepsin; of these, 31.3% were positive. The percentage of pepsin-positive tracheal secretions among the 360 patients ranged from 0% to 100%. At least one aspiration event was identified in 88.9% (n = 320) of the participants. The mean number of pepsin-positive tracheal secretions per patient was 1.6 on each of the 3 observation days.
As stated earlier, the patients were divided into two groups according to their percentage of pepsin-positive tracheal secretions. The mean percentage of pepsin-positive tracheal secretions in the low-aspiration group (n = 175) was 11.1 ± 8.4%; in contrast, it was 50.4 ± 18.1% in the high-aspiration group (n = 185). Fewer than 1% (n = 3) of the 360 patients had overt aspiration events that had been witnessed; the remaining aspirations were clinically silent.
Relationship Between Aspiration and Pneumonia
As shown in Figure 1, the mean percentage of pepsin-positive tracheal secretions was twice as high for patients with pneumonia on day 4 as for those without (42.4 ± 25.1% vs. 21.1 ± 18.2%, respectively; p < .001). As the number of aspiration events accumulated over the study period, the incidence of pneumonia steadily increased (from 24% on day 1 to 36% on day 2 and 44% on day 3; Figure 2). Unfortunately, we could not exclude the possibility that some or most of the cases of pneumonia identified on day 1 were due to aspiration occurring before or during intubation. Only seven (17.5%) of the 40 patients free from aspiration of gastric contents had pneumonia on day 4; in contrast, three of the four patients whose secretions were consistently positive for pepsin developed pneumonia.
Figure 1.
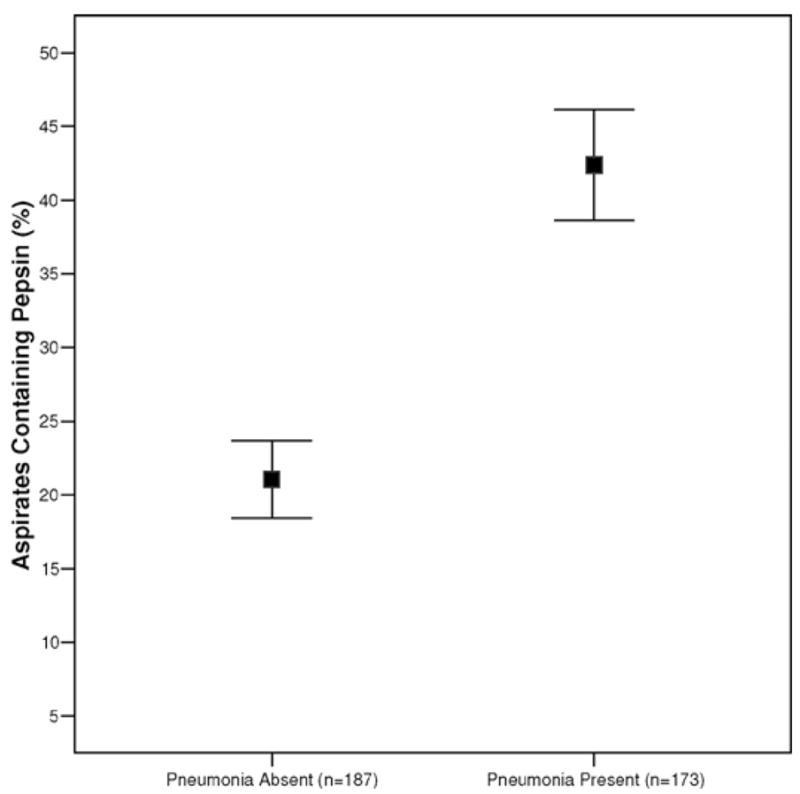
Relationship between percentage of tracheobronchial aspirates containing pepsin and the occurrence of pneumonia by day 4 (extensions indicate 95% confidence intervals).
Figure 2.
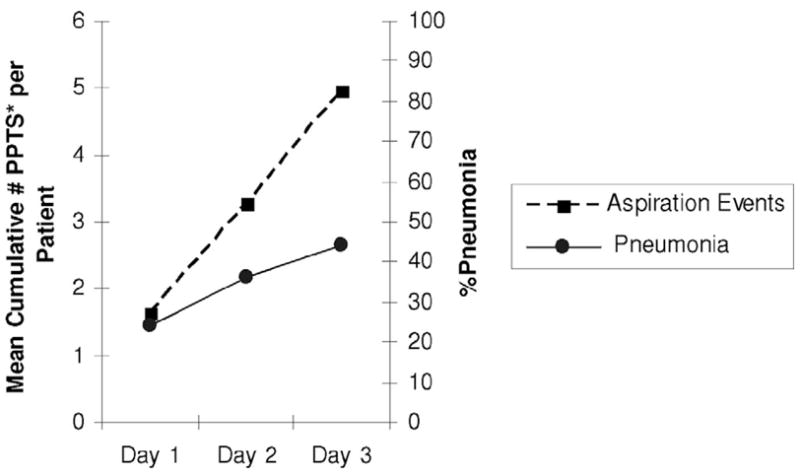
Incidence of pneumonia increased steadily with the accumulation of pepsin-positive tracheal secretions (PPTS [%], proxy for aspiration event). The mean number of pepsin-positive tracheal secretions per patient on day 1 was 1.62; at the end of day 2 the total accumulated number per patient was 3.21; and at the end of day 3 it was 4.84.)
Thirty-two patients had bronchoalveolar lavage performed to confirm the presence or absence of ventilator-associated pneumonia; results from these procedures agreed with the calculated CPIS scores in 27 of the 32 cases (p < .001). Positive CPIS scores were confirmed in 17 of 20 cases (85%), whereas negative CPIS scores were confirmed in 10 of 12 (83%).
Effect of Aspiration and Pneumonia on Use of Hospital Resources
The relationship between aspiration and use of hospital resources is shown in Table 6. Although not statistically significant, the hospital and ICU lengths of stay (LOS) were each approximately 2 days longer in the high-aspiration group. The need for ventilator support was approximately 2.6 days longer in the high-aspiration group (p = .033). The relationship between the presence/absence of pneumonia and use of hospital resources is shown in Table 7. Hospital LOS was about 3.5 days longer in the group with pneumonia, whereas the ICU LOS was about 3.8 days longer (p = .023 and .004, respectively). Also, the need for ventilator support was 4.3 days longer in the group with pneumonia (p = .001). The increased use of resources in the high-aspiration group largely reflected the significant relationship between aspiration frequency and pneumonia. For example, in the absence of pneumonia, the high-aspiration group’s need for ventilator support was <1 day longer than in the low-aspiration group (p = .58).
Table 6.
Relationship between aspiration frequency and use of hospital resources
| No. of Days, Mean ± SD
|
|||
|---|---|---|---|
| Outcome | Low-Aspiration Group (n = 175) | High-Aspiration Group (n = 185) | p Value |
| Hospital length of stay | 26.8 ± 16.1 | 28.9 ± 15.2 | .190 |
| Intensive care unit length of stay | 20.5 ± 10.5 | 22.9 ± 13.7 | .068 |
| Ventilator use | 16.7 ± 9.1 | 19.3 ± 13.7 | .033a |
Significant at p < .05.
Table 7.
Relationship between pneumonia and use of hospital resources
| No. of Days, Mean ± SD
|
|||
|---|---|---|---|
| Outcome | Pneumonia Present (n = 173) | Pneumonia Absent (n = 187) | p Value |
| Hospital length of stay | 29.7 ± 15.6 | 26.2 ± 13.6 | .023a |
| Intensive care unit length of stay | 23.7 ± 19.2 | 19.9 ± 9.9 | .004b |
| Ventilator use | 20.3 ± 13.9 | 16.0 ± 8.8 | .001b |
Significant at p < .05;
significant at p < .01.
Risk Factors for Aspiration
Table 8 includes findings from a series of univariate analyses examining selected risk factors for aspiration. Age and APACHE II score did not significantly discriminate the groups with high proportions of aspirates containing pepsin vs. those with low proportions of positive aspirates.
Table 8.
Selected risk factors for aspiration
| Variable | Low-Aspiration Group (n = 175) | High-Aspiration Group (n = 185) | p Value |
|---|---|---|---|
| Age, yrs, mean ± SD | 52.9 ± 17.7 | 51.6 ± 18.5 | .505 |
| APACHEII score, mean ± SD | 22.3 ± 6.7 | 23.4 ± 6.0 | .091 |
| Percentage of patients with backrest elevation of | |||
| <30 degrees | 56.0 | 67.6 | .024a |
| <40 degrees | 90.9 | 96.8 | .020a |
| <45 degrees | 97.7 | 99.5 | .157 |
| Level of consciousness: GCS, mean ± SD | 7.5 ± 3.1 | 6.9 ± 2.7 | .030a |
| Percentage of patients with GCS score <9 | 65.1 | 76.2 | .021a |
| Mean sedation score: VICS | 36.5 ± 5.4 | 35.6 ± 3.9 | .066 |
| Percentage of patients with VICS score ≤35 | 75.4 | 81.1 | .193 |
| No. of patients with vomiting | 4 | 16 | .01a |
| No. of patients with diagnosed GERD | 9 | 21 | .033a |
GCS, Glasgow Coma Scale; VICS, Vancouver Calmness and Interaction Scale; GERD, gastroesophageal reflux disease.
Significant at <.05. Total sample included in analysis (n = 360).
Angle of Backrest Elevation
As indicated in Table 2, only 1.4% (n = 5) of the patients had mean backrest elevations ≥45 degrees. Furthermore, only 6.1% (n = 22) had mean backrest elevation ≥40 degrees. In contrast, 38.1% (n = 137) had mean backrest elevation ≥30 degrees. Adequate numbers to make comparisons between groups were attained only with the 30-degree cut-point. Because published guidelines to prevent aspiration and pneumonia call for head-of-bed elevation to at least 30 degrees (16, 17), this value was used to make group comparisons. As shown in Table 8, a mean backrest elevation <30 degrees occurred more often in the high-aspiration group than in the low-aspiration group (67.6% vs. 56.0%, respectively; p = .024). Four of the five patients with a mean backrest elevatio≥45 degrees were in the low-aspiration group. Sixteen of the 22 patients with a mean backrest elevatio≥40 degrees were in the low-aspiration group (p = .020).
Level of Consciousness
Compared to infrequent aspirators, the high-aspiration group had a lower mean GCS score (6.9 ± 2.7 vs. 7.5 ± 3.1; p = .030). Because overall mean GCS scores have little clinical relevance, the score was dichotomized at 9 for group comparisons. A GCS score <9 occurred more often in the high-aspiration group than in the low-aspiration group (76.2% vs. 65.1%; p = .021).
Level of Sedation
As shown in Table 8, the mean level of sedation did not significantly differentiate between the two aspiration groups (p = .066). The majority (74.1%) of the 5,329 sedation scale readings were the same (a value of 35). Dichotomizing the score at a level of ≤35 or >35 did not improve discrimination between the two aspiration groups (p = .195).
Feeding Tube Site
To determine the effect of tube site (gastric vs. small bowel) on aspiration, only the 322 patients with a consistent feeding site over the 3-day observation period were included in the analysis. The mean percentage of pepsin-positive tracheal secretions was significantly higher in gastric-fed patients than in small-bowel-fed patients (35.6 ± 25.32 vs. 24.1 ± 20.01, respectively; p < .001). Gastric feedings were used more often in the high-aspiration group than in the low-aspiration group (56.6% vs. 43.4%, respectively; p = .009). When the presence of gastroesophageal reflux disease (GERD), use of promotility agents, and use of opioids was controlled for in the analysis, the significant relationship between tube site and aspiration remained (p = .007).
Gastric Residual Volume
To determine the effect of gastric residual volume on aspiration, only the 182 patients who were consistently fed in the stomach were included in the analysis. The overall mean GRV was greater in the high-aspiration group than in the low-aspiration group (41.9 ± 42.7 mL vs. 31.9 ± 27.2 mL, respectively); however, this finding has no clinical or statistical significance (p = .058). Two or more GRVs ≥200 mL were observed in 20 (11%) of the 182 gastric-fed patients during the 3-day observation period. Fifteen of these 20 patients were in the high-aspiration group (p = .085). Sixteen of the 20 patients with two or more GRVs ≥200 mL had large-bore feeding tubes. No consistent pattern was observed in the management of increased residual volumes. Some treating physicians considered two or more GRVs ≥150 sufficient cause to reduce or stop feedings. However, others chose to begin prokinetics and allow feedings to continue at a reduced rate when GRVs in this range were observed.
Vomiting
A total of 33 vomiting episodes occurred among 20 patients; 16 of the 20 patients who experienced vomiting were in the high-aspiration group (p = .01). Vomiting immediately preceded the three witnessed aspiration events.
Gastric Suction
Forty-four (31.2%) of the 141 patients who received small-bowel feedings throughout the study period had simultaneous gastric suction during at least one of the 4-hr observation periods. The mean percentage of pepsin-positive tracheal secretions was 18.9 ± 19.7% among these individuals; in contrast, it was 26.4 ± 19.8% among those (n = 97) who did not (p = .041). Thirty-one of the 44 patients who received concurrent gastric suction during small-bowel feedings were in the low-aspiration group (p = .046).
Use of Medications
As shown in Table 2, paralytics were used in about one fourth (n = 103) of the patients. There was no significant difference between the high- and low-aspiration groups according to use of these agents (p = .47). Prokinetics were used in fewer than half (n = 162) of the patients; use of these agents was almost identical in the high-and low-aspiration groups (45.4% vs. 45.1%, respectively; p = .56). Opioids were used at least once in 71.1% (n = 256) of the patients; furthermore, these agents were used rather consistently (the mean percentage of observations in which opioids were present was 59.4 ± 28.7%). No significant difference was found between the high- and low-aspiration groups according to opioid use.
Transgression of the Gastroesopha-geal Sphincter
Passage of a nasogastric or an orogastric tube through the gastroesophageal sphincter did not have a significant effect on aspiration frequency. The mean percentage of pepsin-positive tracheal secretions for the 166 patients with nasally or orally placed gastric tubes was 35.0 ± 25.6%, as opposed to 41.3 ± 25.3% for the 16 patients with gastrostomy tubes (p = .363). Furthermore, tube size had no effect on aspiration; the mean percent of pepsin-positive tracheal secretions was almost identical in the 79 patients with 10-French nasogastric/orogastric tubes and the 87 patients with ≥14-French nasogastric/orogastric tubes (35.4 ± 25.2% vs. 35.7 ± 25.5%, respectively; p = .927).
Gastroesophageal Reflux Disease
Of the 30 patients with a diagnosis of GERD on admission, 21 were in the high-aspiration group (p = .033). These patients were evenly distributed according to feeding site: 11 were fed in the stomach throughout the entire study, 11 were fed in the small bowel throughout the entire study, and eight were fed in either the stomach or small bowel before the feeding site was changed during the course of the study.
Binary Logistic Regression Analysis for Aspiration
When the following variables (a backrest elevation <30 degrees, a GCS score <9, presence of vomiting, and presence of GERD) were entered into a backward stepwise logistic regression, all remained in the model: vomiting (p = .005), backrest elevation <30 degrees (p = .033), GCS score <9 (p = .031), and presence of GERD (p = .021). Controlling for a low GCS score, vomiting, and GERD, the risk of aspiration was approximately 1.6 times greater when the patient’s backrest elevation was positioned at <30 degrees (risk, 1.63; 95% confidence interval, 1.04–2.54).
Risk Factors Associated with Pneumonia
A univariate analysis identified multiple risk factors for pneumonia (Table 9). Among these were frequency of aspiration (p < .001), a backrest elevation <30 degrees (p = .018), a GCS score <9 (p = .018), a sedation score ≤35 (p = .010), use of paralytic agents (p = .003), use of opioids (p = .037), and younger age (p = .019). When significant univariate variables were entered into a backward logistic regression analysis (Table 10), only aspiration (p < .001), a sedation score ≤35 (p = .009), and use of paralytics (p = .001) remained in the model. When we controlled for sedation and the use of paralytics, the risk for pneumonia was approximately 4.2 times greater in the high-aspiration group (risk, 4.19; 95% confidence interval, 2.64–6.5).
Table 9.
Selected risk factors for pneumonia
| Variable | Pneumonia Absent (n = 187) | Pneumonia Present (n = 173) | p Value |
|---|---|---|---|
| Age, yrs, mean ± SD | 54.3 ± 18.2 | 49.9 ± 17.8 | .019a |
| Gender, F/M | 82/105 | 63/110 | .076 |
| APACHE II score, mean ± SD | 22.8 ± 6.7 | 23.0 ± 5.9 | .791 |
| Percentage with pepsin-positive tracheal secretions, mean ± SD | 21.1 ± 18.2 | 42.4 ± 25.1 | <.001c |
| Percentage of patients with backrest elevation of | |||
| <30 degrees | 56 | 68 | .018a |
| <40 degrees | 91 | 97 | .041a |
| <45 degrees | 97 | 100 | .025a |
| Level of consciousness: GCS, mean ± SD | 7.8 ± 2.9 | 6.5 ± 2.7 | .004b |
| Percentage of patients with GCS score <9 | 64.2 | 78.0 | .018a |
| VICS score, mean ± SD | 36.8 ± .42 | 35.2 ± .24 | .001b |
| Percentage of patients with VICS score ≤35 | 70.6 | 86.7 | <.001c |
| Use of paralytic agents, percentage of patients | 18.7 | 39.3 | <.001c |
| Use of opioids, percentage of Patients | 66.3 | 75.3 | .037a |
GCS, Glasgow Coma Scale; VICS, Vancouver Calmness and Interaction Scale.
Significant at <.05;
significant at <.01;
significant at <.001.
Total sample included in the analysis (n = 360).
Table 10.
Preliminary identification of risk factors associated with pneumonia in tube-fed patients, determined by multivariate stepwise logistic regression
| Variable | Wald Statistic | p Value | Risk | 95% Confidence Interval |
|---|---|---|---|---|
| High-aspiration group | 37.22 | .000 | 4.2 | 2.7–6.7 |
| Paralytic agents used | 13.98 | .000 | 2.7 | 1.6–4.5 |
| High sedation | 7.68 | .006 | 2.3 | 1.3–4.1 |
The incidence of pneumonia did not differ significantly among patients who received H2 receptor antagonists (n = 264) and in those (n = 94) who received proton pump inhibitors (50% vs. 40%, respectively; p = .096). It was not possible to evaluate the effect of sucralfate, because it was administered to only two patients.
DISCUSSION
This was an analysis to determine the occurrence of aspiration as a risk factor for pneumonia and as a determinant of clinical outcomes in comparison with other factors.
Frequency of Aspiration
The percentage of pepsin-positive tracheal secretions in our aspiration study was somewhat higher than the percentage of tracheal secretions stained with yellow beads in a similar study (31.3% vs. 22.1%, respectively) (8). In addition, the number of patients in our study who experienced at least one aspiration event is similar but slightly higher than that reported by other investigators (88.9% and 75%, respectively) (8). Because the vast majority of patients in our study aspirated at least once, it was necessary to compare frequent and infrequent aspirators (rather than comparing those with and without aspiration).
Relationship Between Aspiration and Pneumonia
Our findings indicate a strong relationship between aspiration frequency and subsequent pneumonia; furthermore, our findings support the assumption made by others that gastroesophageal reflux is a risk factor for pneumonia (9). The percentage of pepsin-positive tracheal secretions was twice as high for patients with pneumonia on day 4 as for those without; in addition, as aspirations accumulated over the 3-day study period, the incidence of pneumonia steadily increased (rising from 24% on day 1 to 48% on day 3). This is a reasonable finding, given that sustained small-volume aspirations of gastric contents predispose to chemical pneumonitis and later to infectious pneumonia. Frequent small-volume aspirations could also serve as a marker for unobserved larger-volume aspirations. It is likely that the cumulative effect of ventilator use added to the increased incidence of pneumonia.
Effect of Aspiration and Pneumonia on Use of Hospital Resources
Although greater use of hospital resources was identified in the high-aspiration group (as compared to the low-aspiration group), it was largely due to the significant relationship between aspiration frequency and pneumonia. Significantly longer hospital and ICU LOS as well as days of ventilator support were identified for patients with pneumonia (vs. those without pneumonia). These findings are consistent with previous reports (18, 19).
Risk Factors for Aspiration
Angle of Backrest Elevation
Descriptive data from our study suggest that elevation of the backrest to levels of 40 degrees and 45 degrees has a protective effect against aspiration. Statistical comparison between the high- and low-aspiration groups showed that a backrest elevation to 30 degrees or higher is associated with less aspiration risk (p = .024). Other investigators have reported infrequent use of backrest elevation to at least 30 degrees for critically ill, enterally fed patients (20). The supine position is a well-recognized risk factor for aspiration. It has been estimated that up to 30% of patients who are kept in a supine position will have gastroesophageal reflux (1).
Level of Consciousness
Difference between mean GCS scores in the high- and low-aspiration groups was small and lacked clinical significance. However, as shown in Table 8, a GCS score <9 occurred significantly more often in the high-aspiration group. This finding likely has clinical significance and has been identified as a useful cut-point by other investigators (9, 21).
Level of Sedation
Little difference was found between mean sedation scores in the two aspiration groups; in part, this may be due to problems with the sedation scale used in our study.
Feeding Tube Site
Our findings suggest that a postpyloric feeding site has a protective effect against aspiration. However, this finding should be interpreted with caution since patients were not randomized to gastric or postpyloric feedings. A recent meta-analysis failed to confirm that gastric feeding is associated with a higher risk of aspiration/pneumonia (22). In our study, the presence of GERD and use of promotility and opioid medications had no significant effect on the relationship between tube site and aspiration. However, it is possible that unmeasured factors (such as use of clonidine) could account for this relationship. Because only two patients had diagnosed preexistent gastroparesis, it was not possible to evaluate the effect of this variable.
Gastric Residual Volume
No signifi-cant difference was found between mean GRVs in the high- and low-aspiration groups. However, the presence of two or more GRVs ≥200 mL was observed more frequently in the high-aspiration group (n = 15) than in the low-aspiration group (n = 5). Although not statistically significant, this finding likely has clinical relevance. The high GRVs were usually identified by large-bore sump tubes, probably because small-bore tubes tend to underestimate gastric residual volumes (23).
Vomiting
Vomiting was an infrequent finding. However, more than three-fourths of the patients who vomited at least once were in the high-aspiration group.
Gastric Suction
Our findings suggest that use of concurrent gastric suction during small-bowel feedings has a protective effect against aspiration. Over two-thirds of the patients who received these treatments concurrently were in the low-aspiration group.
Use of Medications
It was impossible to evaluate the effect of prokinetics on aspiration because they were evenly used in the high- and low-aspiration groups. Whereas prokinetics were used proactively in some patients, they were given to others only after high residuals were observed. It is difficult to explain why opioid use did not differ significantly between the high- and low-aspiration groups, since opioids are associated with delayed gastric emptying.
Transgression of the Gastroesophageal Sphincter
Aspiration was at least as frequent when gastrostomy tubes were used as when feeding tubes (regardless of size) transgressed the gastroesophageal sphincter. Other investigators have reported similar findings (24, 25).
GERD
Because gastroesophageal reflux predisposes to aspiration, it is not surprising that significantly more patients with GERD were identified in the high-aspiration group.
Risk Factors for Pneumonia
Risk for pneumonia was over four times greater in the high-aspiration group than in the low-aspiration group. This finding clearly indicates the significant impact of aspiration on pneumonia. A connection between aspiration and pneumonia has also been reported by other investigators (10, 26, 27). Among other risk factors for pneumonia identified in our study were a high sedation level, a low backrest elevation, and use of paralytics. Other investigators have reported similar findings (10, 11, 28). The greater incidence of pneumonia in younger patients was likely due to the relatively high proportion of young male trauma victims included in our study. Trauma and male gender are recognized risk factors for ventilator-associated pneumonia (29). Dichotomized scores on the sedation scale were far more effective in differentiating between patients with and without pneumonia than between patients in the high- and low-aspiration groups. Nonetheless, the clinical utility of the scale is questionable, given that over 70% of the values reported in this study were 35, despite a possible range of 10 to 60.
The greater number of significant risk factors identified for pneumonia (as compared to those identified for tracheobronchial aspiration of gastric contents) likely reflects the presence of additional causes of pneumonia (beyond aspiration of gastric contents). For example, aspiration of oropharyngeal secretions is also more likely when the level of consciousness is low, sedation level is high, and the backrest angle is low.
Strengths and Limitations
Strengths of the study include the use of an aspiration detection method with a high level of sensitivity and specificity, a large sample size (360 patients and almost 6,000 tracheal secretions), multiple observations of risk factors and other data over a 3-day observation period, and collection of data by skilled research nurses. The high sensitivity of the pepsin assay might also be perceived as a limitation since it detected aspiration in 88.9% of the patients; however, as described above, the assay’s sensitivity ceased to be a problem when a distinction was made between frequent and infrequent aspirators. A limitation of the study was use of the CPIS to diagnose pneumonia (30). Despite good agreement between CPIS scores and bronchoalveolar lavage findings for the 32 patients who had the latter procedure performed, it is probable that the CPIS overestimated pneumonia. However, any overestimation of pneumonia likely occurred in both the high- and low-aspiration groups; thus, comparisons between groups were probably not affected. Additional limitations included failure to collect tracheal secretions between 2400 and 0800 for pepsin analysis and failure to use a continuous read-out of backrest elevation. However, it is likely that any measurement errors made during our serial assessments were evenly distributed among the 360 participants.
CONCLUSIONS
Aspiration of gastric contents is common in critically ill tube-fed patients and is a major risk factor for pneumonia. This finding has strong implications for clinical practice, in that efforts to reduce aspiration may also reduce the incidence of pneumonia. Greater use of hospital resources in the high-aspiration group was largely due to the greater incidence of pneumonia among frequent aspirators.
It is probable that interventions to minimize aspiration can improve outcomes for critically ill tube-fed patients. Our findings support recommendations by expert panels to elevate the head of the bed to an angle of at least 30 degrees for enterally fed patients (unless a medical contraindication exists) (16, 17). Our findings also support a recommendation to initiate additional measures to reduce aspiration risk when gastric residual volumes ≥200 mL are identified (17). Although our study was not a randomized controlled trial, it provided some evidence that aspiration was reduced in patients who received postpyloric feedings. Although there is disagreement about the efficacy of postpyloric feedings in preventing aspiration, clinicians agree that small-bowel feedings are preferred when gastric feedings are poorly tolerated (17).
Acknowledgments
Supported by the National Institute of Nursing Research, National Institutes of Health, R01NR05007.
Footnotes
The authors have no financial interests to disclose.
The study was performed at Saint Louis University Hospital, in St. Louis, MO.
References
- 1.Marik PE. Aspiration pneumonitis and aspiration pneumonia [see comment] N Engl J Med. 2001;344:665–671. doi: 10.1056/NEJM200103013440908. [DOI] [PubMed] [Google Scholar]
- 2.Potts RG, Zaroukian MH, Guerrero PA, et al. Comparison of blue dye visualization and glucose oxidase test strip methods for detecting pulmonary aspiration of enteral feedings in intubated adults. Chest. 1993;103:117–121. doi: 10.1378/chest.103.1.117. [DOI] [PubMed] [Google Scholar]
- 3.Winterbauer RH, Durning RBJ, Barron E, et al. Aspirated nasogastric feeding solution detected by glucose strips. Ann Intern Med. 1981;95:67–68. doi: 10.7326/0003-4819-95-1-67. [DOI] [PubMed] [Google Scholar]
- 4.Metheny NA, Dahms TE, Stewart BJ, et al. Efficacy of dye-stained enteral formula in detecting pulmonary aspiration. Chest. 2002;121:1–6. doi: 10.1378/chest.122.1.276. [DOI] [PMC free article] [PubMed] [Google Scholar]
- 5.Kinsey GC, Murray MJ, Swensen SJ, et al. Glucose content of tracheal aspirates: Implications for the detection of tube feeding aspiration. Crit Care Med. 1994;22:1557–1562. [PubMed] [Google Scholar]
- 6.Elpern EH, Jacobs ER, Tangney C, et al. Nonspecificity of glucose reagent strips as a marker of formula. Am Rev Respir Dis. 1986;131:A288. [Google Scholar]
- 7.Metheny NA, Dahms TE, Stewart BJ, et al. Verification of inefficacy of the glucose method in detecting aspiration associated with tube feedings. Med Surg Nursing. 2005;14:112–121. [PMC free article] [PubMed] [Google Scholar]
- 8.McClave SA, Lukan JK, Stefater JA, et al. Poor validity of residual volumes as a marker for risk of aspiration in critically ill patients [see comment] Crit Care Med. 2005;33:324–330. doi: 10.1097/01.ccm.0000153413.46627.3a. [DOI] [PubMed] [Google Scholar]
- 9.Drakulovic MB, Torres A, Bauer TT, et al. Supine body position as a risk factor for nosocomial pneumonia in mechanically ventilated patients: A randomised trial. Lancet. 1999;354:1851–1858. doi: 10.1016/S0140-6736(98)12251-1. [DOI] [PubMed] [Google Scholar]
- 10.Cook DJ, Walter SD, Cook RJ, et al. Incidence of and risk factors for ventilator-associated pneumonia in critically ill patients. Ann Intern Med. 1998;129:433–440. doi: 10.7326/0003-4819-129-6-199809150-00002. [DOI] [PubMed] [Google Scholar]
- 11.Torres A, Serra-Batlles J, Ros E, et al. Pulmonary aspiration of gastric contents in patients receiving mechanical ventilation: The effect of body position. Ann Intern Med. 1992;116:540–543. doi: 10.7326/0003-4819-116-7-540. [DOI] [PubMed] [Google Scholar]
- 12.Yavagal DR, Karnad DR, Oak JL. Metoclopramide for preventing pneumonia in critically ill patients receiving enteral tube feeding: a randomized controlled trial. Crit Care Med. 2000;28:1408–1411. doi: 10.1097/00003246-200005000-00025. [DOI] [PubMed] [Google Scholar]
- 13.Metheny NA, Dahms TE, Chang YH, et al. Detection of pepsin in tracheal secretions after forced small-volume aspirations of gastric juice. JPEN J Parenter Enteral Nutr. 2004;28:79–84. doi: 10.1177/014860710402800279. [DOI] [PMC free article] [PubMed] [Google Scholar]
- 14.Luna CM, Blanzaco D, Niederman MS, et al. Resolution of ventilator-associated pneumonia: Prospective evaluation of the clinical pulmonary infection score as an early clinical predictor of outcome [see comment] Crit Care Med. 2003;31:676–682. doi: 10.1097/01.CCM.0000055380.86458.1E. [DOI] [PubMed] [Google Scholar]
- 15.de Lemos J, Tweeddale M, Chittock D. Measuring quality of sedation in adult mechanically ventilated critically ill patients: The Vancouver Interaction and Calmness Scale Sedation Focus Group. J Clin Epidemiol. 2000;53:908–919. doi: 10.1016/s0895-4356(00)00208-0. [DOI] [PubMed] [Google Scholar]
- 16.Tablan OC, Anderson LJ, Besser R, et al. Guidelines for preventing health-care–associated pneumonia, 2003: Recommendations of CDC and the Healthcare Infection Control Practices Advisory Committee. MMWR Morbid Mortal Wkly Rep Recom Rep. 2004;53:1–36. [PubMed] [Google Scholar]
- 17.McClave SA, DeMeo MT, DeLegge MH, et al. North American Summit on Aspiration in the Critically Ill Patient: Consensus statement. JPEN J Parenter Enteral Nutr. 2002;26(6 Suppl):S80–S85. doi: 10.1177/014860710202600613. [DOI] [PubMed] [Google Scholar]
- 18.Papazian L, Bregeon F, Thirion X, et al. Effect of ventilator-associated pneumonia on mortality and morbidity. Am J Respir Crit Care Med. 1996;154:91–97. doi: 10.1164/ajrccm.154.1.8680705. [DOI] [PubMed] [Google Scholar]
- 19.Fagon JY, Chastre J, Vuagnat A, et al. Nosocomial pneumonia and mortality among patients in intensive care units. JAMA. 1996;275:866–869. [PubMed] [Google Scholar]
- 20.Grap MJ, Cantley M, Munro CL, et al. Use of backrest elevation in critical care: A pilot study. Am J Crit Care. 1999;8:475–480. [PubMed] [Google Scholar]
- 21.Adnet F, Baud F. Relation between Glasgow Coma Scale and aspiration pneumonia. Lancet. 1996;348:123–124. doi: 10.1016/s0140-6736(05)64630-2. [DOI] [PubMed] [Google Scholar]
- 22.Marik PE, Zaloga GP. Gastric versus post-pyloric feeding: A systematic review. Crit Care (London) 2003;7:R46–R51. doi: 10.1186/cc2190. [DOI] [PMC free article] [PubMed] [Google Scholar]
- 23.Metheny NA, Stewart J, Nuetzel G, et al. Effect of feeding-tube properties on residual volume measurements in tube-fed patients. J Parent Enter Nutr. 2005;29:192–197. doi: 10.1177/0148607105029003192. [DOI] [PubMed] [Google Scholar]
- 24.Kuo B, Castell DO. The effect of nasogastric intubation on gastroesophageal reflux: A comparison of different tube sizes. Am J Gastroenterol. 1995;90:1804–1807. [PubMed] [Google Scholar]
- 25.Hassett JM, Sunby C, Flint LM. No elimination of aspiration pneumonia in neurologically disabled patients with feeding gastrostomy. Surg Gynecol Obstet. 1988;167:383–388. [PubMed] [Google Scholar]
- 26.Akca O, Koltka K, Uzel S, et al. Risk factors for early-onset, ventilator-associated pneumonia in critical care patients: Selected multiresistant versus nonresistant bacteria [see comment] Anesthesiology. 2000;93:638–645. doi: 10.1097/00000542-200009000-00011. [DOI] [PubMed] [Google Scholar]
- 27.Schmidt J, Holas M, Halvorson K, et al. Video-fluoroscopic evidence of aspiration predicts pneumonia and death but not dehydration following stroke. Dysphagia. 1994;9:7–11. doi: 10.1007/BF00262752. [DOI] [PubMed] [Google Scholar]
- 28.Orozco-Levi M, Torres A, Ferrer M, et al. Semirecumbent position protects from pulmonary aspiration but not completely from gastroesophageal reflux in mechanically ventilated patients. Am J Respir Crit Care Med. 1995;152(4 Pt 1):1387–1390. doi: 10.1164/ajrccm.152.4.7551400. [DOI] [PubMed] [Google Scholar]
- 29.Rello J, Ollendorf DA, Oster G, et al. Epidemiology and outcomes of ventilator-associated pneumonia in a large US database [see comment] CHEST. 2002;122:2115–2121. doi: 10.1378/chest.122.6.2115. [DOI] [PubMed] [Google Scholar]
- 30.Schurink CA, van Nieuwenhoven CA, Jacobs JA, et al. Clinical pulmonary infection score for ventilator-associated pneumonia: accuracy and inter-observer variability. Intensive Care Med. 2004;30:217–224. doi: 10.1007/s00134-003-2018-2. [DOI] [PubMed] [Google Scholar]