Abstract
The SOCS family of genes are negative regulators of cytokine signalling with SOCS-1 displaying tumor suppressor activity. SOCS-1, CIS and SOCS-3 have been implicated in the regulation of red blood cell production. In this study, a detailed examination was conducted on the expression patterns of these three SOCS family members in normal erythroid progenitors and a panel of erythroleukemic cell lines. Unexpectedly, differences in SOCS gene expression were observed during maturation of normal red cell progenitors, viz changes to CIS were inversely related to the alterations of SOCS-1 and SOCS-3. Similarly, these SOCS genes were differentially expressed in transformed erythoid cells –erythroleukemic cells immortalized at an immature stage of differentiation expressed SOCS-1 and SOCS-3 mRNA constitutively, whereas in more mature cell lines SOCS-1 and CIS were induced only after exposure to erythropoietin (Epo). Significantly, when ectopic expression of the tyrosine kinase Lyn was used to promote differentiation of immature cell lines, constitutive expression of SOCS-1 and SOCS-3 was completely suppressed. Modulation of intracellular signalling via mutated Epo receptors in mature erythroleukemic lines also highlighted different responses by the three SOCS family members. Close scrutiny of SOCS-1 revealed that, despite large increases in mRNA levels, the activity of the promoter did not alter after erythropoietin stimulation; in addition, erythroid cells from SOCS-1−/− mice displayed increased sensitivity to Epo. These observations indicate complex, stage-specific regulation of SOCS genes during normal erythroid maturation and in erythroleukemic cells.
Introduction
Erythropoiesis is controlled by a number of cytokines, in particular erythropoietin (Epo), the hormone that regulates the expansion of the erythroid compartment from the burst-forming unit-erythroid (BFU-E) stage, through the colony-forming units-erythroid (CFU-E) stage to late erythroblasts. During this process, Epo promotes cell viability, enhances proliferation and induces differentiation (Koury and Bondurant, 1992). Over the past decade, the Epo-stimulated intracellular signalling pathways that direct these responses have largely been elucidated, for example, JAK/STAT and ras/MAP kinase cascades (Ihle, 1995; Klingmuller, 1997; Constantinescu et al., 1999; Tilbrook and Klinken, 1999). Significantly, abnormalities in the JAK/STAT and ras pathway have been associated with cancer induction (Marshall, 1988; Waldmann and Rabes, 1996; Bromberg et al., 1999; Lacronique et al., 1997).
The negative regulation of Epo stimulation has received more recent attention. One negative pathway that has been defined involves SHP-1, a phosphatase that downregulates Epo signalling by dephosphorylating the Epo receptor and JAK2 (Klingmuller et al., 1995). In addition, the SOCS family of negative regulators of cytokine signalling have been isolated (Yoshimura et al., 1995; Endo et al., 1997; Naka et al., 1997; Starr et al., 1997). Transcripts for these SOCS genes increase rapidly in response to a variety of cytokines and the SOCS family act via a negative feedback loop to suppress cytokine-induced signal transduction. There are eight members of the SOCS family, each containing a SH2 domain and a SOCS box that acts as an adaptor between elongins and activated signalling molecules, targeting them for proteasomal degradation (Starr et al., 1997; Hilton et al., 1998; Kamura et al., 1998; Zhang et al., 1999).
CIS, the initial SOCS family member, was identified as an Epo-inducible molecule (Yoshimura et al., 1995). Expression of CIS mRNA is elevated upon activation of JAK2 and STAT5, and the CIS promoter contains STAT5 consensus binding sites (Matsumoto et al., 1997; Verdier et al, 1998b). It has been suggested that CIS is involved in the proteasome-mediated inactivation of the Epo receptor (Verdier et al., 1998a).
SOCS-1 was isolated as an inhibitor of cytokine receptor phosphorylation and STAT activation, by suppressing the activity of JAK kinases (Endo et al., 1997; Naka et al., 1997; Starr et al., 1997). It can also associate with, and reduce the activity of, tyrosine kinases Tyk2 (Naka et al., 1997) and Tec, but not Lyn (Ohya et al., 1997). Interestingly, SOCS-1 has been shown to suppress stem cell factor (SCF)-induced proliferation, while favoring viability promoted by this cytokine (De Sepulveda et al., 1999). It is noteworthy that SOCS-1 displays features of a tumour suppressor, and silencing of the gene has been associated with cancer development (Yoshikawa et al., 2001; Rottapel et al., 2002).
SOCS-3 is tyrosine phosphorylated following Epo, IL-2, epidermal growth factor and platelet-derived growth factor stimulation (Cohney et al., 1999; Cacalano et al., 2001). It can bind to both JAK1 and the IL2 receptor β chain, inhibit STAT 5 signalling and maintain activation of the ras/MAP kinase pathway by binding to RasGAP (Cacalano et al., 2001). In addition, SOCS-3 can suppress Epo signalling by associating with the Epo receptor and JAK2 (Cohney et al., 1999; Sasaki et al., 2000; Cacalano et al., 2001).
Three SOCS genes have been associated with erythropoiesis, viz SOCS-1, CIS and SOCS-3. They are either induced by Epo (Yoshimura et al., 1995; Starr et al., 1997; Pircher et al., 2001) or expressed in fetal liver (Starr et al., 1997; Marine et al., 1999). While CIS −/− mice have no detectable phenotype (Marine et al., 1999), SOCS-1−/− mice suffer from mild anemia and an excess of nucleated erythroid cells in the spleen (Alexander et al., 1999; Metcalf et al., 1999). It has been reported that SOCS-3 is essential for fetal liver erythropoiesis (Marine et al., 1999). Deletion of SOCS-3 results in embryonic lethality because of erythrocytosis and accumulation of nucleated erythroid cells in the fetal liver; moreover, transgene-mediated overexpression of SOCS-3 suppresses fetal liver erythropoiesis (Marine et al., 1999). However, others have failed to detect an erythroid defect in SOCS-3−/− mice, possibly because these mice die before erythropoiesis switches to the fetal liver (Roberts et al., 2001).
In this study, we examined the expression and regulation of SOCS-1, CIS and SOCS-3 during the maturation of erythroid cells. Our results identified distinct expression profiles for these SOCS genes in normal red cell progenitors, as well as immortalized erythroid cell lines. Differential SOCS gene expression was altered appreciably by ectopic expression of the tyrosine kinase Lyn and mutated Epo receptors. These data demonstrate that unique patterns of regulation exist for SOCS genes expressed during erythroid maturation and in transformed cells.
Results
Differential expression of SOCS genes in normal erythroid progenitors
To determine the expression patterns of SOCS-1, CIS and SOCS-3 genes during red cell maturation, erythroid progenitors were isolated from the spleens of mice treated with phenylhydrazine. High levels of BFU-E are found in the spleen immediately after phenylhydrazine treatment (Sasaki et al., 2000; Vannucchi et al., 2000), and the maturation of these progenitors has been shown to model accurately erythroid terminal differentiation (Hodges et al., 1999). Splenocytes enriched for BFU-E were obtained 1 day postphenylhydrazine treatment and cultured in the presence of Epo for 48 h. Figure 1a shows the morphological changes that occurred as the cells underwent erythroid maturation in vitro – the transition from large blast-like cells to reticulocytes is evident. A significant increase in benzidine positive (18–83%) and Ter119-positive cells accompanied this terminal differentiation. mRNA was isolated from these cultures and SOCS gene expression analysed by semiquantitative RT–PCR (Vannucchi et al., 2000). Significantly, differential expression of SOCS genes was observed in these maturing erythroid cells (Figure 1b,c). Initially, high levels of CIS mRNA and low levels of SOCS-1 and SOCS-3 transcripts were detected. However, 24 h after exposure to Epo, the pattern was reversed – CIS content fell, while SOCS-1 and SOCS-3 rose significantly. By 48 h post-Epo stimulation, CIS levels had rebounded, whereas SOCS-1 and SOCS-3 levels fell slightly. These data demonstrate that the patterns of SOCS gene expression alter considerably during erythroid maturation.
Figure 1.
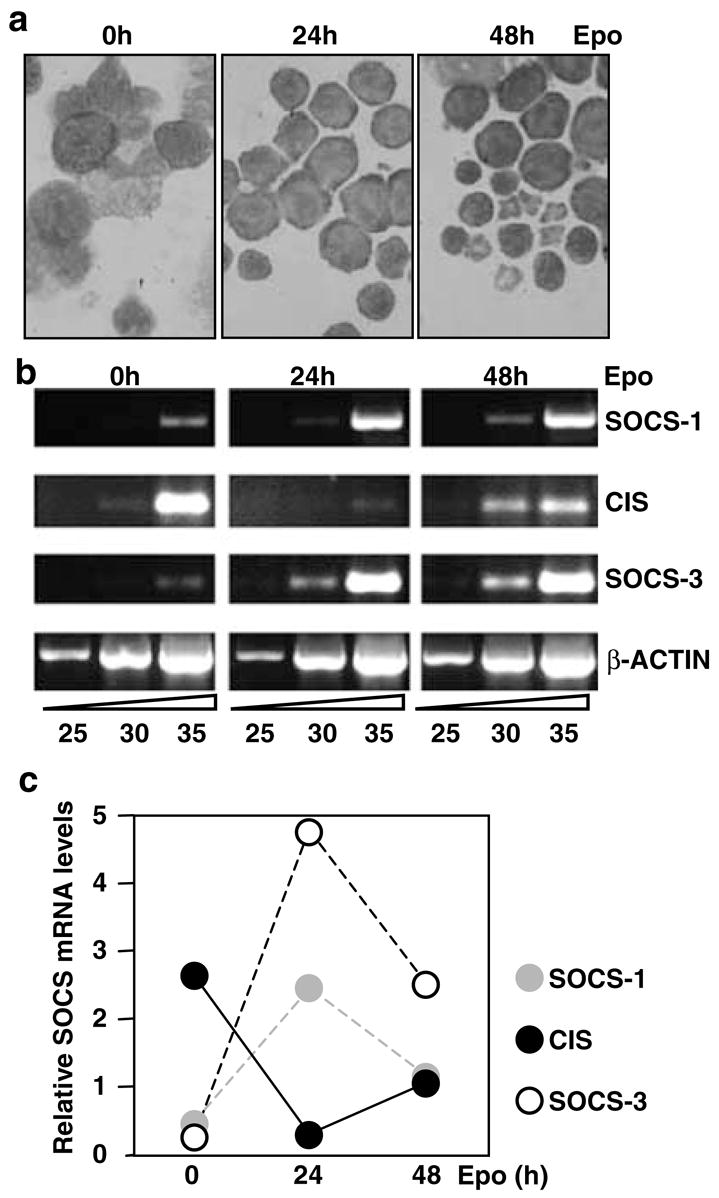
Expression of SOCS-1, SOCS-3 and CIS mRNA in normal erythroid progenitors, (a) Cytocentrifuge preparations of splenic erythroid cells isolated from phenylhydrazine-treated mice stimulated in vitro for 0, 24 or 48 h with Epo (5 U/ml). (b) mRNA was isolated from splenocytes and subjected to RT-PCR analysis for 25, 30 or 35 cycles using primers specific for SOCS-1, SOCS-3, CIS and β-actin. (c) PCR products for SOCS-1, SOCS-3 and CIS were quantitated using NIH Image 1.6 and plotted relative to β-actin levels
Differential expression of SOCS genes in immortalized erythroid cells
As phenylhydrazine-treated splenocytes represent a heterogeneous population of erythroid cells, Epo-responsive cell lines immortalized at different stages of red cell maturation were sought. To this end, five erythroleukemic cell lines transformed by raf, myc and raf/myc oncogenes were characterized according to their surface protein profiles, together with hemoglobin synthesis and proliferation following Epo stimulation. The surface markers used for this analysis were: Epo receptor, c-Kit, Ter119 and transferrin receptor. Epo receptor levels vary with the maturation stage of erythriod cells – low levels are present on BFU-E, but these rise to a peak on CFU-E/proerythroblasts (Landschulz et al., 1989). Similarly, transferrin receptors peak around the proerythroblast stage of development (Iacopetta et al., 1982). c-Kit is displayed on the surface of BFU-E, but not by CFU-E onwards (De Jong et al., 1995; Uoshima et al., 1995), whereas Ter119 is expressed exclusively by cells beyond the CFU-E stage (Ikuta et al., 1990). Figure 2a summarizes the analysis of the cell lines and shows that R11 was transformed at the most immature stage, as it expressed c-Kit, had few Epo receptors (approximately 400 per cell) and did not display Ter119. In contrast, the RM5 and J2E lines were immortalized at the most mature phase displaying no c-Kit, high levels of Epo receptors (approximately 1000 per cell) and Ter119. The J2E-NR and ME17 lines have intermediate phenotypes, with J2E-NR designated less mature than ME-17 based on the lack of Ter119. Although each of these transformed cell lines remained more viable in response to Epo (Tilbrook et al., 1997), only J2E cells proliferated and produced significant quantities of hemoglobin after hormonal stimulation. Importantly, intracellular signalling in J2E cells stimulated with Epo is comparable with signalling cascases activated in other erythroid model systems (Tilbrook et al., 1996a,b, 1997, 2001a, Tilbrook et al., b; Tilbrook and Klinken, 1999).
Figure 2.
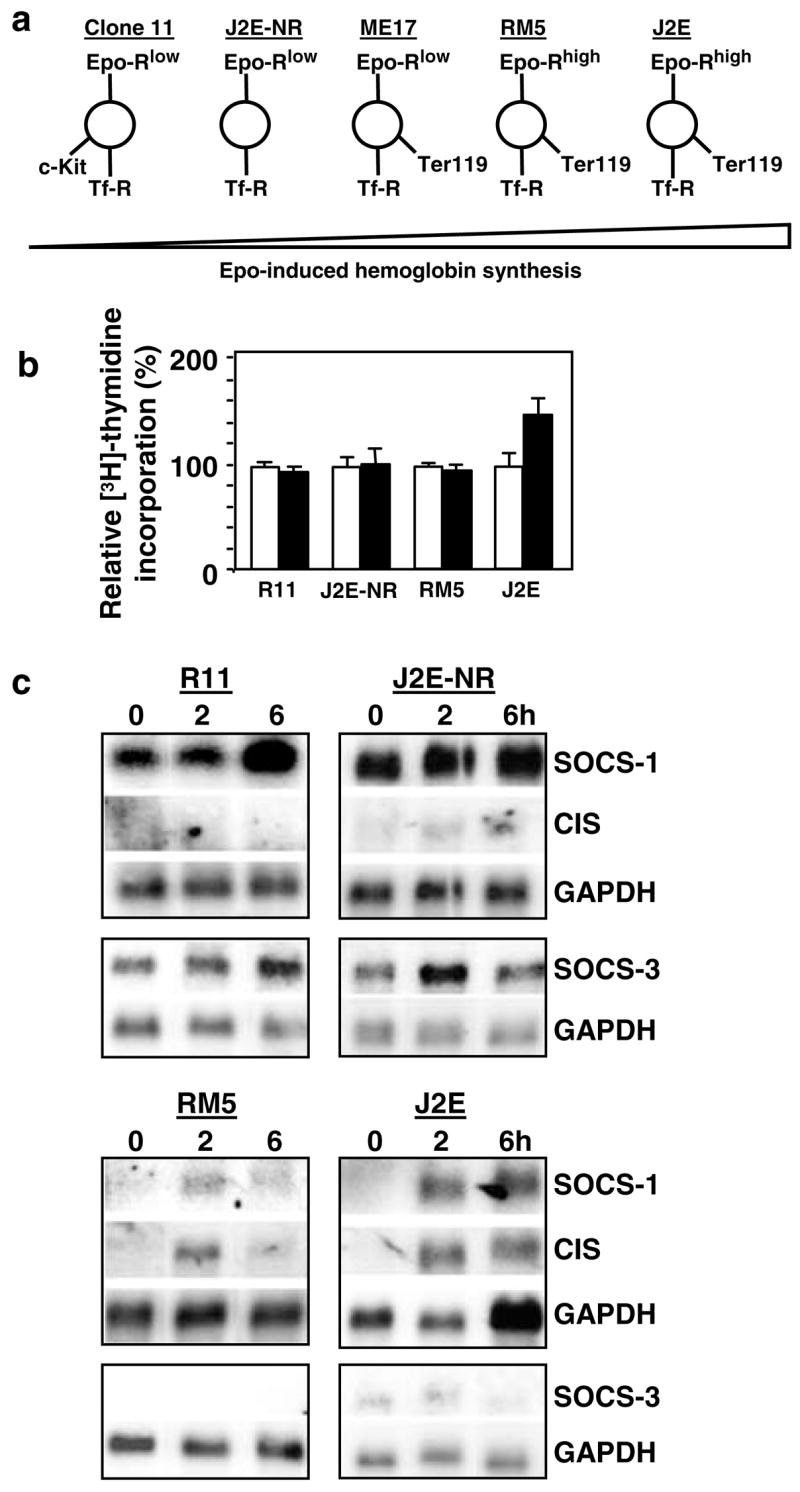
Expression of SOCS-1, SOCS-3 and CIS mRNA in erythroleukemic cell lines, (a) Flow cytometry was used to characterize cell surface expression of c-Kit, Epo receptor (Epo-R), transferrin receptor (Tf-R) and Ter119 on erythroleukemic cell lines, (b) [3H]thymidine incorporation of unstimulated (white histogram) or Epo-stimulated (5U/ml; black histogram) cells is expressed as a per cent relative to unstimulated cells, (c), Northern analysis of poly A+ RNA from cells stimulated with Epo (5U/ml) for 0–6h. Membranes were probed with SOCS-1, followed by CIS and then GAPDH. Independent membranes were probed with SOCS-3 and GAPDH
To compare expression patterns of SOCS family members, each of the cell lines was exposed to Epo and the levels of SOCS-1, CIS and SOCS-3 mRNA ascertained. Considerable SOCS-1 and SOCS-3 mRNA were present in the less mature R11 and J2E-NR cell lines prior to Epo stimulation, while CIS mRNA was barely detectable (Figure 2c). This observation was remarkably similar to the expression of SOCS genes in splenocytes 24 h after culture in Epo (Figure 1b). Modest increases in SOCS-1 and SOCS-3 mRNA were observed in these cells after exposure to Epo (Figure 2c). In contrast, SOCS-1 and CIS transcripts were not detected in the more mature J2E and RM5 cells, but were induced within 2 h of Epo stimulation. Although SOCS-3 mRNA levels were also very low in J2E and RM5 cells, they were unaffected by Epo. Similar patterns of induction were observed for ME17 cells (data not shown). These patterns of SOCS gene expression were observed in five independent experiments.
It was concluded from these experiments that differential expression of SOCS genes seen in nontransformed erythroid cells (Figure 1), also occurred in cell lines immortalized at different stages of red cell differentiation. It is noteworthy that SOCS-1 and SOCS-3 were constituitively expressed in the immature lines, whereas SOCS-1 and CIS were induced by Epo in mature lines.
Lyn suppresses constitutive SOCS-1 and SOCS-3 expression
To determine whether constitutive SOCS-1 and SOCS-3 expression in transformed cells with an immature phenotype (Figure 2c) could be altered by promoting maturation, the tyrosine kinase Lyn was overexpressed in R11 and J2E-NR cells. Previously, we have reported that the J2E-NR cells ‘de-differentiated’ from the parental J2E line and failed to mature in response to Epo because of a severe depletion in Lyn (Tilbrook et al., 1996a, 1997). Enforced expression of Lyn promotes the maturation of J2E-NR cells, and also normal erythroid progenitors (Tilbrook et al., 1997, 2001b). Figure 3a shows that expression of exogenous Lyn also prompted spontaneous hemoglobin synthesis in R11 and J2E-NR cells, but did not affect the ability of the cells to proliferate in response to Epo (Figure 3b). In addition, R11 cells overexpressing Lyn matured morphologically (Figure 3c), no longer expressed c-Kit, but displayed Ter119 (Figure 3d), had higher levels of Epo receptors on their surface (Figure 3e) and expressed elevated levels of erythroid transcription factors (NF-E2, EKLF and GATA-1) as well as globin protein (Figure 3f).
Figure 3.
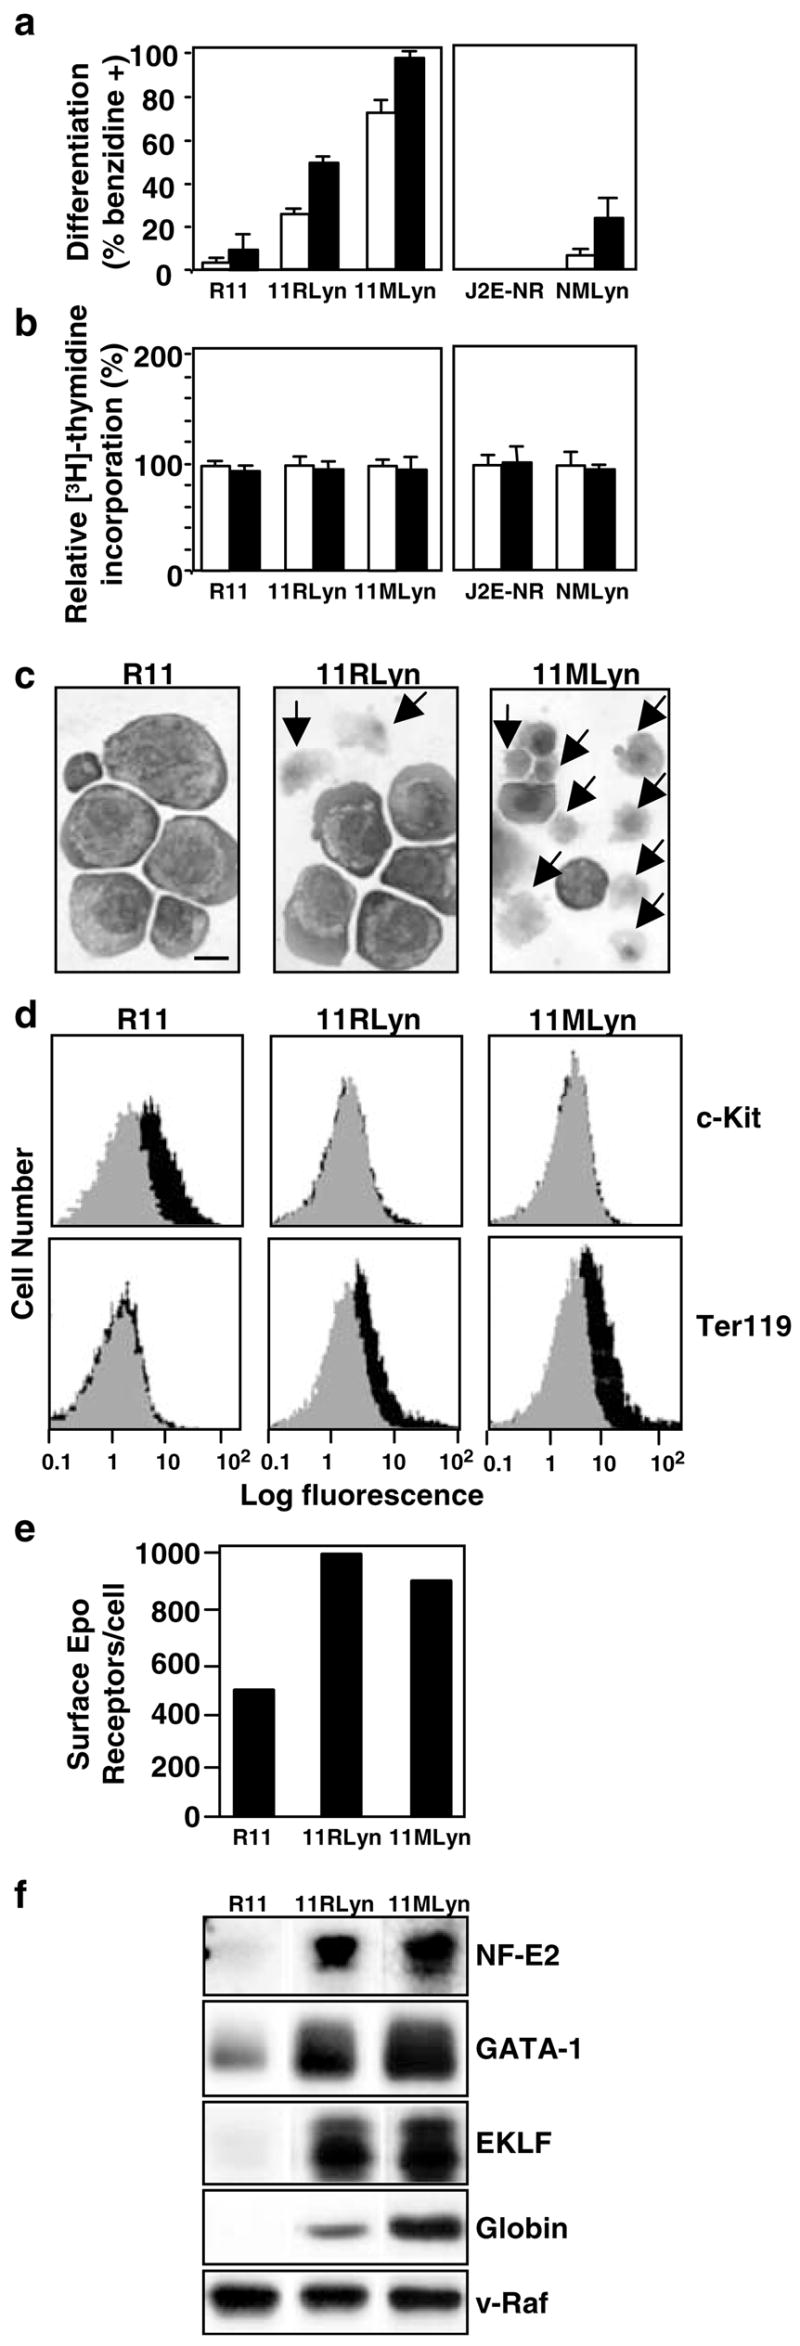
Introduction of Lyn into immature erythroleukemic cell lines promotes maturation, (a) R11, 11RLyn, 11MLyn, J2E-NR and NMLyn cells were unstimulated (white histogram) or stimulated with Epo (5U/ml; black histogram) for 48 h, then hemoglobin synthesis measured by the benzidine staining, (b) [3H]thymidine incorporation of unstimulated (white histogram) or Epo-stimulated (5 U/ml; black histogram) cells is expressed as a per cent relative to unstimulated cells, (c) Cytocentrifuge preparations of R11, 11RLyn and 11MLyn cells in the absence of Epo. Note the enucleating erythroblasts and reticulocytes, indicated by arrows. The bar represents 10 μm. (d) Expression of c-Kit and Ter119 on the surface of R11, 11RLyn and 11MLyn cells was determined by flow cytometry. The gray area represents the background fluorescence, while the black area represents antibody binding, (e) Epo receptor numbers were determined by Scatchard analysis, (f) Cell lysates were immunoblotted with antibodies to NF-E2, GATA-1, EKLF, globin and v-Raf (loading control)
The expression profile of SOCS-1, CIS and SOCS-3 mRNA expression in Lyn-transfected cells was then monitored by Northern analysis (Figure 4a). Strikingly, in both R11 and J2E-NR cells over-expressing Lyn (11RLyn and NMLyn, respectively), SOCS-1 and SOCS-3 mRNA were no longer expressed constitutively. However, unlike the J2E and RMS cell lines (Figure 2b), SOCS-1 and CIS were not induced by Epo. The suppression of SOCS-1 and SOCS-3 mRNA levels by Lyn was specific because transcripts for other genes were not reduced, for example, GAPDH, EKLF (Figure 4b) and GATA-1 (data not shown). These data demonstrate that constitutive SOCS-1 and SOCS-3 expression in erythroleukemic cells exhibiting an immature phenotype was inhibited by exogenous Lyn – these changes correlated with maturation and hemoglobin production in response to Epo (Figure 3).
Figure 4.
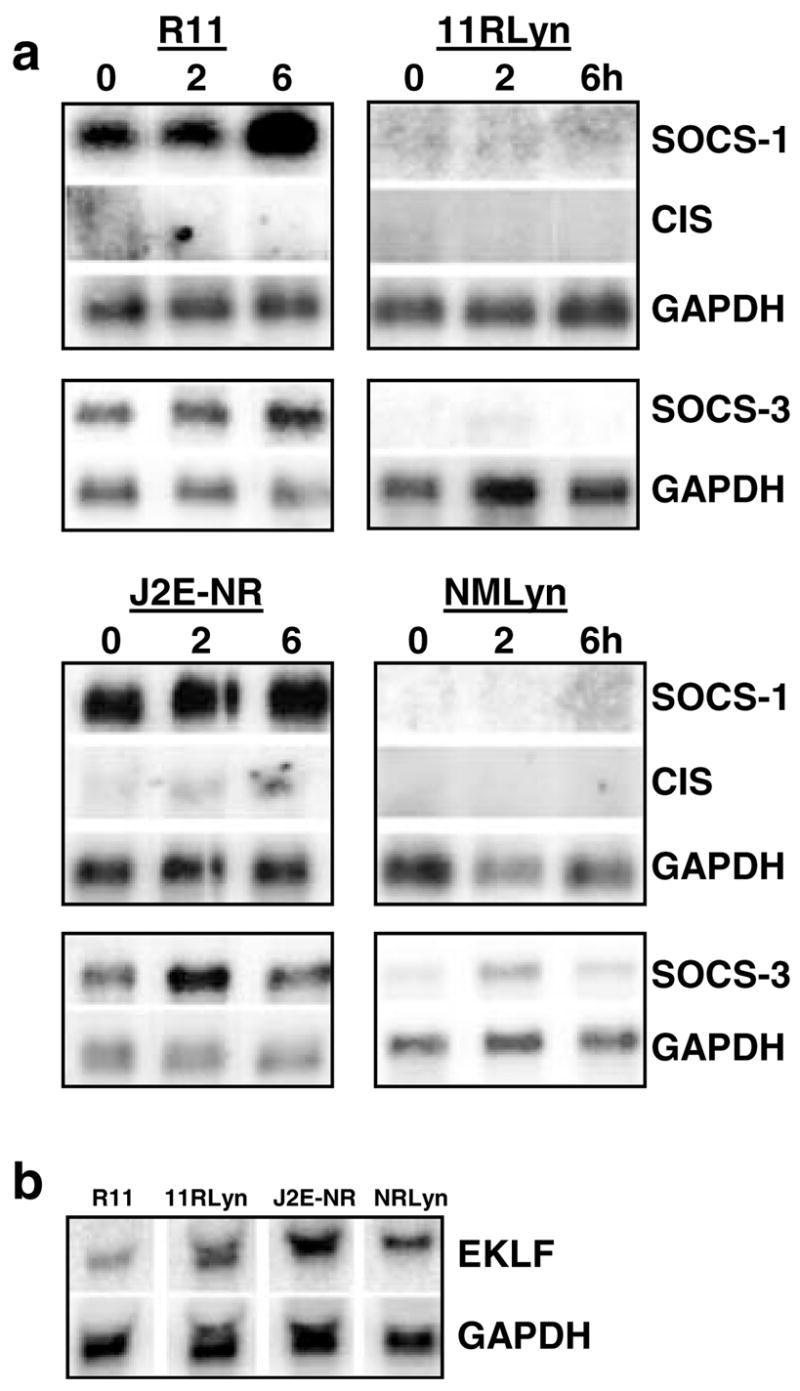
Lyn suppresses constitutive SOCS-1 and SOCS-3 mRNA expression, (a) Northern analysis of poly A+ RNA from immature erythroleukemic cell lines R11 and J2E-NR expressing exogenous Lyn (11RLyn, NMLyn) stimulated with Epo (5U/ml) for 0–6h. Membranes were probed with SOCS-1, followed by CIS and then GAPDH. Independent membranes were probed with SOCS-3 and GAPDH. (b) Northern analysis of total mRNA from unstimulated cells, probed with EKLF and GAPDH
Mutated Epo receptors affect SOCS gene expression
Having observed the effects of Lyn on members of the SOCS family, the impact of altering the JAK/STAT pathway on differential SOCS expression was examined next. Manipulation of JAK2 and STATS activation was achieved by introduction of mutant Epo receptors into J2E cells. We have recently demonstrated that coexpression of wild-type Epo receptors with mutant receptors has marked biological consequences, that is, cells bearing the truncated Δ321 receptor are hypersensitive to Epo, whereas those containing the W282R point-mutant do not respond to Epo (Cull et al., 2000). The truncated Δ321 receptors lack the negative regulatory C-terminal domain (D’Andrea et al., 1991), whereas the W282R mutant fails to bind JAK2 (Miura et al., 1994)). Figure 5a,b demonstrates the modified Epo-responsiveness of these cells. The characteristic transient increase in JAK2 and STAT5 phosphorylation after Epo stimulation was observed in parental J2E cells (Figure 5c,d); concomitantly, epo-induced STAT5 binding to a β-casein element was detected by electrophoretic mobility shift assays (data not shown). In contrast, extended activation of JAK2 and STAT5 was seen in J2E cells containing the Δ321 receptor (Figure 5c,d). Cells transfected with the W282R mutant receptor, on the other hand, completely failed to activate both JAK2 and STAT5. Therefore, introduction of altered receptors had a profound effect on their ability to activate JAK/STAT pathway and, consequently, their capacity to manufacture hemoglobin.
Figure 5.
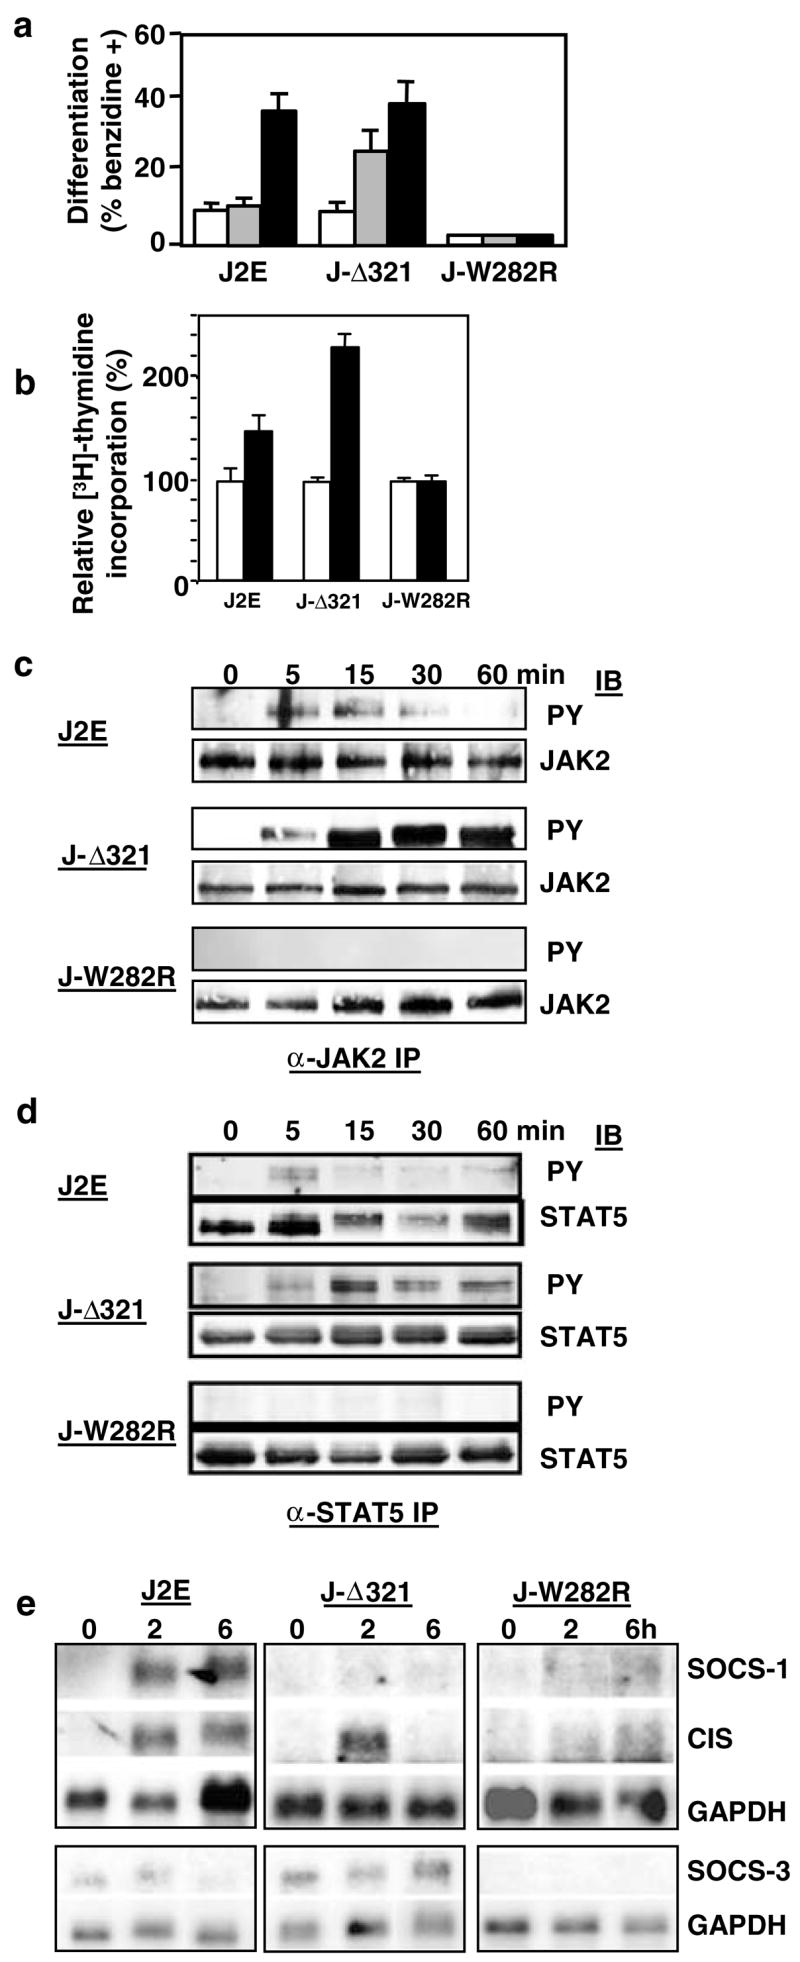
Altered JAK/STAT signalling affects SOCS gene profile, (a) J2E cells and those bearing the mutant Δ321 Epo receptor (J-Δ321) and W282R Epo receptor (J-W282R) were unstimulated (white histogram) or stimulated with Epo (0.01 U/ml, striped histogram; 5 U/ml, black histogram) for 48 h and hemoglobin synthesis measured by the benzidine staining, (b) [3H]thymidine incorporation of unstimulated (white histogram) or Epo-stimulated (5 U/ml; black histogram) cells is expressed as a per cent relative to unstimulated cells, (c, d) Cells were stimulated with Epo (5 U/ml) for 0–60min and proteins (5 mg) were immunoprecipitated with anti-JAK2 (c) or anti-STAT5 (d) antibodies, then immunoblotted with antiphosphotyrosine antibodies followed by anti-JAK2 (c) or anti-STAT5 (d) antibodies, (e) Northern analysis of poly A+ RNA from cells stimulated with Epo (5 U/ml) for 0–6 h. Membranes were probed with SOCS-1, followed by CIS and then GAPDH. Independent membranes were probed with SOCS-3 and GAPDH
Northern blotting was then used to examine the impact of altered JAK/STAT signalling on SOCS gene expression (Figure 5e). Intriguingly, extended STAT5 activation in J-Δ321 prevented SOCS-1 induction, whereas CIS and SOCS-3 were essentially unaffected. This phenomenon was also observed when an extended time course was conducted, and confirmed with other independent clones expressing the Δ321 mutant receptors (data not shown). In contrast, J-W282R cells that fail to activate JAK2 and STAT5 did not express SOCS-1, CIS or SOCS-3 after Epo stimulation. Therefore, modulating the JAK/STAT pathway activation via mutant Epo receptors clearly altered the expression patterns of SOCS genes.
SOCS-1 promoter is not Epo inducible
SOCS-1 is constitutively expressed in the less mature J2E-NR clone, whereas it is Epo inducible in parental J2E cells (Figure 2b). The promoter of the SOCS-1 gene was examined to determine whether differences in promoter activity existed between cell lines displaying quite distinct expression patterns. Several luciferase constructs, encompassing over 2kb upstream of the initiation site, were generated and transfected into J2E and J2E-NR cells. Figure 6 shows that a minimal promoter of 100bp, lacking any potential STAT sites, was active in both cell types. Increasing the 5′ region to include possible STAT binding motifs generated a modest increase in promoter activity. When SOCS-1 promoter activity was compared between J2E and J2E-NR cells, no significant differences were observed (Figure 6), despite the consitutive expression of SOCS-1 mRNA in J2E-NR cells (Figure 2). Furthermore, Epo stimulation did not enhance the activity of the SOCS-1 promoter in either cell line, even though SOCS-1 transcripts were induced in J2E cells (Figure 2). These data are consistent with results observed previously in fibroblasts (Schluter et al., 2000), and indicate that SOCS-1 promoter activity does not necessarily correlate with SOCS-1 mRNA levels.
Figure 6.
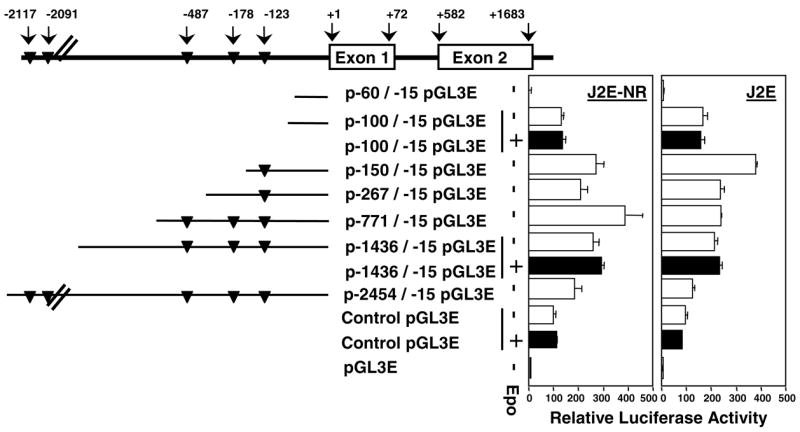
SOCS-1 promoter activity is not Epo-inducible. Schematic representation of the SOCS-1 promoter, putative STAT binding sites (TTCCNNNAA; triangles) and the various promoter constructs. pGL3E-SOCS-1 reporter constructs (10 μg) and 1 μg of pRL-SV40 were electroporated into J2E and J2E-NR cells, then harvested after 48 h of culture, with (black bar) or without (white bar) Epo (5 U/ml). Dual luciferase reporter assays were performed and levels of SOCS-1 promoter activity were expressed relative to the pGL3 control set at 100%
Lack of SOCS-1 contributes to Epo hypersensitivity
J2E cells bearing the Δ321 mutant receptor were hypersensitive to Epo, and SOCS-1 levels did not rise after hormonal stimulation (Figure 5). The increased responsiveness to Epo, therefore, may reside with the inability to synthesize this negative regulator of signalling. To determine whether a lack of SOCS-1 may contribute to increased Epo sensitivity, red cell progenitors from fetal livers of SOCS-1−/− mice were exposed to a range of epo concentrations and erythroid colony formation monitored. Figure 7 shows that CFU-E from SOCS-1−/− mice were indeed more responsive to lower concentrations of Epo than SOCS+/− and +/+ progenitors. Interestingly, a few Epo-inducible colonies were generated from progenitors isolated from SOCS-1−/− mice. Comparable results were obtained with BFU-E (data not shown). These observations demonstrate that the absence of SOCS-1 can contribute to increased sensitivity to Epo.
Figure 7.
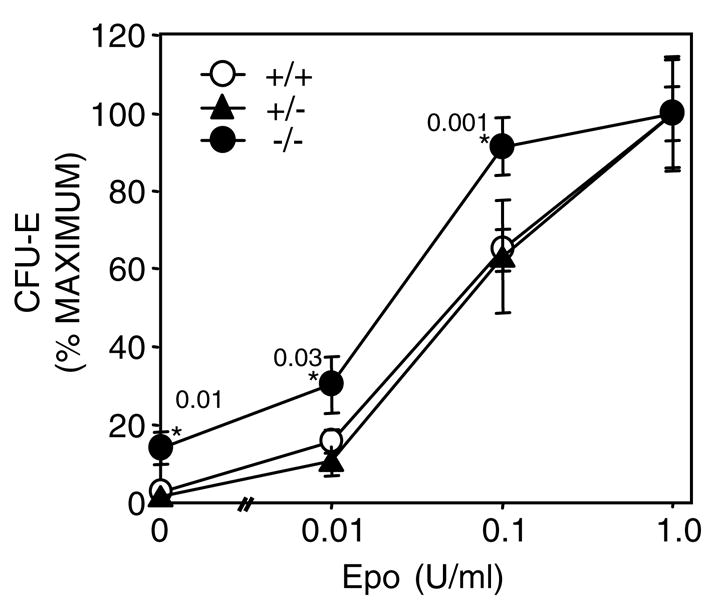
Erythroid progenitors lacking SOCS-1 are hypersensitive to Epo. Fetal liver cells isolated from SOCS-1+/+ (open circle), +/− (triangle) and −/− (closed circle) mice were plated in methylcellulose with varying concentrations of Epo. CFU-E numbers were determined 2 days later. The results shown are expressed as the percentage of the maximal colony numbers for the 1 U/ml Epo plates (+/− standard error; n = 6). Astericks indicate statistically significant (Student’s t-test) differences between −/−and +/− or +/+ cells with P-values displayed
Discussion
In this manuscript, we have shown that SOCS genes are expressed and regulated differently during erythroid terminal differentiation. Differential expression of SOCS-1, SOCS-3 and CIS was observed in normal red cell progenitors and erythroleukemic cell lines. During the Epo-initiated maturation of enriched BFU-E, expression of SOCS-1 and SOCS-3 was inversely related to CIS, that is, SOCS-1 and SOCS-3 peaked after 24 h exposure to Epo, then fell slightly, whereas CIS reached a nadir at 24 h before rising again (Figure 1). Similarly, erythroleukemic cell lines arrested at different stages of red cell maturation displayed unique patterns of SOCS gene expression – SOCS-1 and SOCS-3 were constitutively expressed in transformed cells bearing an immature phenotype, while SOCS-1 and CIS were inducible in cell lines immortalized at a more mature stage (Figure 2). These data suggest that SOCS genes, not only perform specific tasks within erythroid cells (Starr et al., 1997; Verdier et al., 1998a, b; Sasaki et al., 2000; Cacalano et al., 2001; Pircher et al., 2001), but are regulated independently in a stage-specific manner. It is conceivable, therefore, that alterations to the expression of SOCS genes must occur for maturation of erythroid cells to proceed.
Epo releases the block in differentiation imposed by the raf/myc oncogenes on mature erythroleukemic lines (Busfield and Klinken, 1992), by initiating the well-characterized intracellular signalling pathways (Tilbrook et al., 1996a, b, 1997, 2001a, Tilbrook et al., b; Tilbrook and Klinken, 1999). The inducibility of SOCS-1 and CIS in these cell lines is consistent with previous reports (Yoshimura et al., 1995; Starr et al., 1997). Likewise, the limited accumulation of SOCS-3 after exposure to Epo (Figure 2) supports the contention that expression of this SOCS family member is Epo independent (Marine et al., 1999). However, to our knowledge, constitutive expression of SOCS-1 and SOCS-3 by less mature erythroleukemic lines has not been reported before. It would appear that these cells have been immortalized at a stage of maturation, which reflects high SOCS-1 and SOCS-3, but low CIS, a profile observed during the differentiation of enriched BFU-E (Figure 1).
The constitutive expression of SOCS-1 and SOCS-3 in immature erythroleukemic lines also correlated with a poor capacity to differentiate. We have shown previously that ectopic expression of the tyrosine kinase Lyn promotes differentiation of immortalized cell lines and nontransformed erythroid progenitors (Tilbrook et al., 1997, 2001b). Strikingly, the ability of immature erythroleukemic lines overexpressing Lyn to mature along the erythroid pathway coincided with the elimination of constitutive SOCS-1 and SOCS-3 expression (Figures 3 and 4). It is not clear from these results whether Lyn is directly upstream of SOCS-1 and SOCS-3, or whether it promotes cellular maturation, and inhibition of these SOCS genes is an indirect consequence of differentiation. These observations suggest that a reduction of SOCS gene expression at specific stages of maturation may be a necessary prerequisite for differentiation to proceed.
Mice lacking SOCS-1 display erythroid defects, including a subnormal hematocrit and an accumulation of immature red blood cells (Alexander et al., 1999; Metcalf et al., 1999). Data presented here indicate that the erythroid abnormalities in SOCS-1−/− mice may be due, in part, to the increased sensitivity of red cell progenitors to Epo (Figure 7). The absence of this negative regulator could have contribruted to the heightened Epo responsiveness. Similarly, SOCS-1−/− mice are hypersensitive to interferon γ (Alexander et al., 1999; Brysha et al., 2001) and GM-CSF, but not M-CSF (Metcalf et al., 1999).
Increased sensitivity to Epo was also observed in J2E erythroleukemic cells containing the 321 mutant Epo receptor (Figure 5). Strikingly, despite extended JAK2 and STAT5 activation, SOCS-1 was not activated in this cell line. This receptor lacks the C-terminal negative regulatory domain (D’Andrea et al., 1991), which has been shown to bind the phosphatase SHP-1 (Klingmuller et al., 1995). The hypersensitive response to this truncated receptor has been attributed to the inability of SHP-1 to bind and dephosphorylate the receptor (Klingmuller et al., 1995). Our observations indicate that the C-terminal of the Epo receptor may also be required to activate SOCS-1. It is possible, therefore, that the negative regulatory domain of the receptor contributes to the downregulation of Epo signalling not only via SHP-1, but also by SOCS-1 activation.
The experiments described here revealed that the SOCS-1 promoter was not Epo responsive, despite the large increase in SOCS-1 mRNA levels (Figures 2 and 6). It is possible that other parts of the gene may confer Epo inducibility to the locus; alternatively, stabilization of SOCS-1 transcripts may be an important component in the accumulation of mRNA. Other forms of SOCS gene regulation are emerging, including translational repression (Gregorieff et al., 2000; Schluter et al., 2000). Interestingly, the activity of the promoter was hardly affected by the inclusion of STAT sites. These data in erythroid cells are commensurate with observations in fibroblasts (Schluter et al., 2000). It is noteworthy that STAT1 activation of SOCS-1 is indirect, as STAT1 induces transcription factor IRF-1, which in turn stimulates SOCS-1 transcription (Saito et al., 2000).
In summary, the data presented here demonstrate that SOCS-1, CIS and SOCS-3 show distinct patterns of expression during erythroidmaturation. Different responses to Epo stimulation and Lyn-induced differentiation were observed for these SOCS genes. Collectively, these results indicate complex, independent regulation of SOCS gene family members is required for the production of red blood cells.
Materials and Methods
Analysis of SOCS gene expression in erythroid progenitor cells
C57 mice (8 weeks old) were injected intraperitoneally with phenylhydrazine (60mg/kg body weight) on two consecutive days. Spleens were removed 1 day later and a single-cell suspension prepared in Iscove’s Modified Dulbecco’s Media, 20% fetal calf serum (FCS), 10% WEHI 3B D− conditioned media (IL-3), 100ng/ml recombinant rat SCF (Amgen, Thousand Oaks, CA, USA). RNA was isolated at 0, 24 and 48 h following Epo stimulation (5U/ml). RT-PCR analysis was performed for 25, 30 and 35 cycles using the following sets of PCR primers: mCIS (5′-ATG GTC CTC TGC GTA CAG-3′; 5′-TGA CAA GCA GTT AGA GTC-3′), mSOCS-1 (5′-ATG GTA GCA CGC AAC CAG GTG-3′; 5′-CTC CAG CAG CTC GAA AAG GCA-3′), mSOCS-3 (5′-GGA GTG GTG GCT CCT GGC TCT-3′; 5′-GGT AAT TGC ATG GCT GCT GCA-3′) and β-actin (5′-GTG ACG AGG CCC AGA GCA AGA G-3′; 5′-AGG GGC CGG ACT CAT CGT ACT C-3′) and fragments were separated electrophoretically on 1% agarose gels. Quantitation of the size and density of the PCR band was undertaken using NIH Image 1.6. Cell morphology was examined microscopically after cytocentrifuging cells onto glass slides and immersion in Wright’s stain (Busfield and Klinken, 1992).
Cell culture
J2E (Klinken et al., 1988), J2E-NR (Klinken and Nicola, 1990) RM5, R11 (Metz et al., 1995) and ME17 (Cory et al., 1991) cells were maintained in Dulbecco’s modified Eagle’s medium with 5% FCS. Cells were stimulated with recombinant human Epo (0.01–5U/ml; Eprex, Jannsen-Cilag, Australia). Hemoglobin synthesis determined by benzidine staining (Cooper et al., 1974). [3H]thymidine uptake assays were performed essentially as we have described previously (Busfield and Klinken, 1992). Cell morphology was examined microscopically after cytocentrifuging cells onto glass slides and immersion in Wright’s stain (Busfield and Klinken, 1992).
Cell surface protein analysis
Cells (106) were incubated with antibodies to transferrin receptor (R17 208; (Trowbridge et al., 1982), c-Kit (Ogawa et al., 1991) or Terll9 (Ikuta et al., 1990) for 30min on ice, washed three times in PBS–2% FCS followed by incubation with a secondary antibody conjugated to fluorescein isothiocyanate (Silenus, Melbourne, Australia) for 30 min on ice, then washed three times in PBS–2% FCS before analysis on a FACScanII instrument (Becton Dickinson, Mountainview, CA, USA). Cells incubated in the absence of primary antibody were analysed as controls. Scatchard analysis of [I125] Epo binding to cell surface receptors has been described in detail elsewhere (Tilbrook et al., 1996b).
Northern analyses
Total cellular RNA was isolated from cells (Chomczynski and Sacchi, 1987), then poly A+ RNA was extracted and separated electrophoretically on 1% agarose gels with formaldehyde. Following transfer to nylon membranes (Hybond N+, Amersham, Bucks, UK), 32P-labelled probes for SOCS-1, SOCS-3 (Starr et al., 1997), CIS (Yoshimura et al., 1995), EKLF (Miller and Bieker, 1993) and GAPDH (Piechaczyk et al., 1984) were used for hybridization. Phosphor-screens were used for visualization on a Phosphorlmager (Molecular Dynamics, CA, USA) and quantitation using Imagequant software.
Amphotropic viral infection of erythroid cells
J2E cell lines infected with the pMSCV-neo 2.2 vector (Hawley et al., 1994) containing either a truncated Epo receptor (J-Δ321) or mutated JAK2 binding site receptor (J-W282R) are described elsewhere (Cull et al., 2000). Results from a representative clone of three original isolates are shown. R11 and J2E-NR cell lines infected with pRuftkNeo (Rayner and Gonda, 1994) or pMSCV-neo 2.2 (Hawley et al., 1994) retroviral vectors expressing wild-type Lyn (11RLyn and NMLyn, respectively) have been described previously (Tilbrook et al., 1997).
Protein analysis
For immunoprecipitations, cells were serum deprived for 4h, stimulated with Epo (5U/ml) for 60 min and lysed in buffer (150 mM NaCl, 1% Triton X-100, 20mM Tris pH 7.5, 1 mM phenylmethylsulfonyl fluoride, 10 μg/ml aprotinin). Immunoprecipitations were conducted with 3–5 mg protein with anti-STAT5 (sc835; Santa Cruz Biotechnology Inc., CA, USA) or anti-JAK2 (06–255; Upstate Biotechnology, NY, USA) antibody. Immunoprecipitated proteins or cell lysates (100/μg) were immunoblotted and membranes probed with antibodies to STAT5b, GATA-1, Raf (sc835, sc265, sc133; Santa Cruz Biotechnology Inc., Santa Cruz, CA, USA), globin (#55447; Cappel Research, Organon Technika, Belgium), EKLF (Bieker and Southwood, 1995), NF-E2 (Andrews et al., 1993) or phosphotyrosine (4G10; Upstate Biotechnology, NY, USA), followed by incubation with horseradish peroxidase-conjugated antibodies. Visualization was by enhanced chemiluminescence (Amersham, Bucks., UK).
SOCS-1 −/− mice fetal liver assays
Murine fetal livers were harvested from 13-day-old fetuses and individually plated in triplicate in a 12-well tray as described previously (Tilbrook et al., 2001b) with various concentrations of Epo. Benzidine-positive CFU-E were counted 2 days later, while BFU-E were enumerated after 7 days of culture. The genotype of each fetus was determined by PCR (Starr et al., 1997).
SOCS-1 promoter analysis
The murine SOCS-1 gene including the promoter region (pgmSOCS-1) was cloned into pBluescript-SK (+) as a NotI fragment (W Alexander, Walter and Eliza Hall Institute, Melbourne, Australia). SOCS-1 promoter constructs, created using restriction enzyme digestion and/or PCR, were cloned into pBluescript and then subcloned into pGL3E. pGL3E SOCS-1 promoter constructs (10 μg) were electroporated into cells (107) together with 1 μg of pRL-SV40 (Promega, Madison, WI, USA) at 300 V/1000 μFD using a Gene Pulser II (Bio-Rad). Transfected cells were harvested after 48 h of culture in the presence or absence of Epo (5 U/ml) and dual luciferase reporter assays were performed (Promega, Madison, WI, USA) on an Autolumat LB953 (EG&G Berthold, Oak Ridge, TN, USA). Levels of activity were expressed relative to the pGL3 control.
Acknowledgments
We acknowledge the expert technical assistance from Shane Meakins, Research Centre, Royal Perth Hospital. Recombinant human Epo (Eprex) was a generous gift from Dr J Adams and Dr J Patava (Janssen-Cilag, Australia). This work was supported by grants from NHMRC (#99-0596 and the Block Grant to the Walter and Eliza Hall Institute), the Cancer Foundation of Western Australia, the Medical Research Foundation of Royal Perth Hospital, The Neurotrauma Research Program of Western Australia, the National Institutes of Health, Bethesda, Maryland (Grant CA-22556), National Cancer Institute and The National Institutes of Health, Bethesda, Maryland (Grant CA-77447). SJB is an NHMRC RD Wright Postdoctoral Fellow. RS was supported by a Postdoctoral Fellowship from the Australian Research Council.
References
- Alexander WS, Starr R, Fenner JE, Scott CL, Handman E, Sprigg NS, Corbin JE, Cornish AL, Darwiche R, Owczarek CM, Kay TWH, Nicola NA, Hertzog PJ, Metcalf D, Hilton DJ. Cell. 1999;98:597–608. doi: 10.1016/s0092-8674(00)80047-1. [DOI] [PubMed] [Google Scholar]
- Andrews NC, Erdjument-Bomage H, Davidson MB, Tempst P, Orkin SH. Nature. 1993;362:722–728. doi: 10.1038/362722a0. [DOI] [PubMed] [Google Scholar]
- Bieker JJ, Southwood CM. Mol Cell Biol. 1995;15:852–860. doi: 10.1128/mcb.15.2.852. [DOI] [PMC free article] [PubMed] [Google Scholar]
- Bromberg JF, Wrzeszczynska MH, Devgan G, Zhao Y, Pestell RG, Albanese C, Darnell JE., Jr Cell. 1999;98:295–303. doi: 10.1016/s0092-8674(00)81959-5. [DOI] [PubMed] [Google Scholar]
- Brysha M, Zhang J, Bertolino P, Corbin J, Alexander W, Nicola N, Hilton D, Starr R. J Biol Chem. 2001;276:22086–22089. doi: 10.1074/jbc.M102737200. [DOI] [PubMed] [Google Scholar]
- Busfield SJ, Klinken SP. Blood. 1992;80:412–419. [PubMed] [Google Scholar]
- Cacalano NA, Sanden D, Johnston JA. Nat Cell Biol. 2001;3:460–465. doi: 10.1038/35074525. [DOI] [PubMed] [Google Scholar]
- Chomczynski P, Sacchi N. Anal Biochem. 1987;162:156–169. doi: 10.1006/abio.1987.9999. [DOI] [PubMed] [Google Scholar]
- Cohney SJ, Sanden D, Cacalano NA, Yoshimura A, Mui A, Migone TS, Johnston JA. Mol Cell Biol. 1999;19:4980–4988. doi: 10.1128/mcb.19.7.4980. [DOI] [PMC free article] [PubMed] [Google Scholar]
- Constantinescu SN, Ghaffari S, Lodish HF. Trends Endocrin Metab. 1999;10:18–23. doi: 10.1016/s1043-2760(98)00101-5. [DOI] [PubMed] [Google Scholar]
- Cooper MC, Levy J, Cantor LN, Marks PA, Rifkind RA. Proc Natl Acad Sci USA. 1974;71:1677–1680. doi: 10.1073/pnas.71.5.1677. [DOI] [PMC free article] [PubMed] [Google Scholar]
- Cory S, Maekawa T, McNeall J, Metcalf D. Cell Growth Differ. 1991;2:165–172. [PubMed] [Google Scholar]
- Cull V, Tilbrook PA, Adenan AS, Chappell D, Ingley E, Sarna MK, Palmer TN, Watowich SS, Klinken SP. Oncogene. 2000;19:953–960. doi: 10.1038/sj.onc.1203370. [DOI] [PubMed] [Google Scholar]
- D’Andrea AD, Yoshimura A, Yousoufian H, Zon LI, Koo J-W, Lodish HF. Mol Cell Biol. 1991;11:1980–1987. doi: 10.1128/mcb.11.4.1980. [DOI] [PMC free article] [PubMed] [Google Scholar]
- De Jong MO, Wagemaker G, Wognum AW. Blood. 1995;86:4076–4085. [PubMed] [Google Scholar]
- De Sepulveda P, Okkenhaug K, La Rose J, Hawley RG, Dubreuil P, Rottapel R. EMBO J. 1999;18:904–915. doi: 10.1093/emboj/18.4.904. [DOI] [PMC free article] [PubMed] [Google Scholar]
- Endo TA, Masuhara M, Yokouchi M, Suzuki R, Sakamoto H, Mitsui K, Matsumoto A, Tanimura S, Ohtsubo M, Misawa H, Miyazaki T, Leonor N, Taniguchi T, Fujita T, Kanakura Y, Komiya S, Yoshimura A. Nature. 1997;387:921–924. doi: 10.1038/43213. [DOI] [PubMed] [Google Scholar]
- Gregorieff A, Pyronnet S, Sonenberg N, Veillette A. J Biol Chem. 2000;275:21596–21604. doi: 10.1074/jbc.M910087199. [DOI] [PubMed] [Google Scholar]
- Hawley RG, Lieu FHL, Fong AZC, Hawley TS. Gene Theraphy. 1994;1:136–138. [PubMed] [Google Scholar]
- Hilton DJ, Richardson RT, Alexander WS, Viney EM, Willson TA, Sprigg NS, Starr R, Nicholson SE, Metcalf D, Nicola NA. Proc Natl Acad Sci USA. 1998;95:114–119. doi: 10.1073/pnas.95.1.114. [DOI] [PMC free article] [PubMed] [Google Scholar]
- Hodges V, Winter P, Lappin T. Br J Haematol. 1999;106:325–334. doi: 10.1046/j.1365-2141.1999.01535.x. [DOI] [PubMed] [Google Scholar]
- Iacopetta BJ, Morgan EH, Yeoh GC. Biochim Biophys Acta. 1982;687:204–210. doi: 10.1016/0005-2736(82)90547-8. [DOI] [PubMed] [Google Scholar]
- Ihle JN. Nature. 1995;377:591–594. doi: 10.1038/377591a0. [DOI] [PubMed] [Google Scholar]
- Ikuta K, Kina T, McNeill I, Uchida N, Peault B, Chein Y, Weissman I. Cell. 1990;62:863–874. doi: 10.1016/0092-8674(90)90262-d. [DOI] [PubMed] [Google Scholar]
- Kamura T, Sato S, Haque D, Liu L, Kaelin WG, Jr, Conaway RC, Conaway JW. Gene Dev. 1998;12:3872–3881. doi: 10.1101/gad.12.24.3872. [DOI] [PMC free article] [PubMed] [Google Scholar]
- Klingmuller U. Eur J Biochem. 1997;249:637–647. doi: 10.1111/j.1432-1033.1997.t01-1-00637.x. [DOI] [PubMed] [Google Scholar]
- Klingmuller U, Lorenz U, Cantley LC, Neel BG, Lodish HF. Cell. 1995;80:729–738. doi: 10.1016/0092-8674(95)90351-8. [DOI] [PubMed] [Google Scholar]
- Klinken SP, Nicola NA. Leukemia. 1990;4:24–28. [PubMed] [Google Scholar]
- Klinken SP, Nicola NA, Johnson GR. Proc Natl Acad Sci USA. 1988;85:8506–8510. doi: 10.1073/pnas.85.22.8506. [DOI] [PMC free article] [PubMed] [Google Scholar]
- Koury MJ, Bondurant MC. Eur J Biochem. 1992;210:649–663. doi: 10.1111/j.1432-1033.1992.tb17466.x. [DOI] [PubMed] [Google Scholar]
- Lacronique V, Boureux A, Delia Valle V, Poirel H, Tran Quang C, Mauchauffe M, Berthou C, Lessard M, Berger R, Ghysdael J, Bernard O. Science. 1997;278:1309–1312. doi: 10.1126/science.278.5341.1309. [DOI] [PubMed] [Google Scholar]
- Landschulz KT, Noyes AN, Rogers O, Boyer SJ. Blood. 1989;73:1476–1486. [PubMed] [Google Scholar]
- Marine J-C, McKay C, Wang D, Topham DJ, Parganas E, Nakajima H, Pendeville H, Yasukawa H, Sasaki A, Yoshimura A, Ihle JN. Cell. 1999;98:617–627. doi: 10.1016/s0092-8674(00)80049-5. [DOI] [PubMed] [Google Scholar]
- Marshall CJ. J Cell Sci Suppl. 1988;10:157–169. doi: 10.1242/jcs.1988.supplement_10.12. [DOI] [PubMed] [Google Scholar]
- Matsumoto A, Masuhara M, Mitsui K, Yokouchi M, Ohtsubo M, Misawa H, Miyajima A, Yoshimura A. Blood. 1997;89:3148–3154. [PubMed] [Google Scholar]
- Metcalf D, Alexander WS, Elefanty AG, Nicola NA, Hilton DJ, Starr R, Mifsud S, Di Rago L. Leukemia. 1999;13:926–934. doi: 10.1038/sj.leu.2401440. [DOI] [PubMed] [Google Scholar]
- Metz T, Harris AW, Adams JM. Cell. 1995;82:29–36. doi: 10.1016/0092-8674(95)90049-7. [DOI] [PubMed] [Google Scholar]
- Miller U, Bieker JJ. Mol Cell Biol. 1993;13:2776–2786. doi: 10.1128/mcb.13.5.2776. [DOI] [PMC free article] [PubMed] [Google Scholar]
- Miura O, Nakamura N, Quelle FW, Witthuhn BA, Ihle JN, Aoki N. Blood. 1994;84:1501–1507. [PubMed] [Google Scholar]
- Naka T, Narazaki M, Hirata M, Matsumoto T, Minamoto S, Aono A, Nishimoto N, Kajita T, Taga T, Yoshizaki K, Akira S, Kishimoto T. Nature. 1997;387:924–929. doi: 10.1038/43219. [DOI] [PubMed] [Google Scholar]
- Ogawa M, Matsuzaki Y, Nishikawa S, Hayashi S, Kunisada T, Sudo T, Kina T, Nakauchi H, Nishikawa S. J Exp Med. 1991;174:63–71. doi: 10.1084/jem.174.1.63. [DOI] [PMC free article] [PubMed] [Google Scholar]
- Ohya K, Kajigaya S, Yamashita Y, Miyazato A, Hatake K, Miura Y, Ikeda U, Shimada K, Ozawa K, Mano H. J Biol Chem. 1997;272:27178–27182. doi: 10.1074/jbc.272.43.27178. [DOI] [PubMed] [Google Scholar]
- Piechaczyk M, Blanchard J, Martin L, Dani C, Panabries F, El Sabrouty S, Jeanteur P. Nucleic Acids Res. 1984;12:6951–6963. doi: 10.1093/nar/12.18.6951. [DOI] [PMC free article] [PubMed] [Google Scholar]
- Pircher TJ, Geiger JN, Zhang DY, Miller CP, Gaines P, Wojchowski DM. J Biol Chem. 2001;276:8995–9002. doi: 10.1074/jbc.M007473200. [DOI] [PubMed] [Google Scholar]
- Rayner JR, Gonda TJ. Mol Cell Biol. 1994;14:880–887. doi: 10.1128/mcb.14.2.880. [DOI] [PMC free article] [PubMed] [Google Scholar]
- Roberts AW, Robb L, Rakar S, Hartley L, Cluse L, Nicola NA, Metcalf D, Hilton DJ, Alexander WS. Proc Natl Acad Sci. 2001;98:9324–9329. doi: 10.1073/pnas.161271798. [DOI] [PMC free article] [PubMed] [Google Scholar]
- Rottapel R, Ilangumaran S, Neale C, La Rose J, Ho JM, Nguyen MH, Barber D, Dubreuil P, de Sepulveda P. Oncogene. 2002;21:4351–4362. doi: 10.1038/sj.onc.1205537. [DOI] [PubMed] [Google Scholar]
- Saito H, Morita Y, Fujimoto M, Narazaki M, Naka T, Kishimoto T. J Immunol. 2000;164:5833–5843. doi: 10.4049/jimmunol.164.11.5833. [DOI] [PubMed] [Google Scholar]
- Sasaki A, Yasukawa H, Shouda T, Kitamura T, Dikic I, Yoshimura A. J Biol Chem. 2000;275:29338–29347. doi: 10.1074/jbc.M003456200. [DOI] [PubMed] [Google Scholar]
- Schluter G, Boinska D, Nieman-Seyde SC. Biochem Biophys Res Commun. 2000;268:255–261. doi: 10.1006/bbrc.2000.2109. [DOI] [PubMed] [Google Scholar]
- Starr R, Willson TA, Viney EM, Murray LJ, Rayner JR, Jenkins BJ, Gonda TJ, Alexander WS, Metcalf D, Nicola NA, Hilton DJ. Nature. 1997;387:917–921. doi: 10.1038/43206. [DOI] [PubMed] [Google Scholar]
- Tilbrook PA, Bittorf T, Busfield SJ, Chappell D, Klinken SP. J Biol Chem. 1996a;271:3453–3459. doi: 10.1074/jbc.271.7.3453. [DOI] [PubMed] [Google Scholar]
- Tilbrook PA, Bittorf T, Callus B, Busfield SJ, Ingley E, Klinken SP. Cell Growth Differ. 1996b;7:511–520. [PubMed] [Google Scholar]
- Tilbrook PA, Colley SM, McCarthy DJ, Marais R, Klinken SP. Arch Biochem Biophys. 2001a;396:128–132. doi: 10.1006/abbi.2001.2577. [DOI] [PubMed] [Google Scholar]
- Tilbrook PA, Ingley E, Williams JH, Hibbs ML, Klinken SP. EMBO J. 1997;16:1610–1619. doi: 10.1093/emboj/16.7.1610. [DOI] [PMC free article] [PubMed] [Google Scholar]
- Tilbrook PA, Klinken SP. Growth Factors. 1999;17:25–35. doi: 10.3109/08977199909001060. [DOI] [PubMed] [Google Scholar]
- Tilbrook PA, Palmer GA, Bittorf T, McCarthy DJ, Wright MJ, Sarna MK, Linnekin D, Cull V, Williams JH, Ingley E, Schneider-Mergener J, Krystal G, Klinken SP. Cancer Res. 2001b;61:2453–2458. [PubMed] [Google Scholar]
- Trowbridge IS, Lesley J, Schulte R. J Cell Physiol. 1982;112:403–410. doi: 10.1002/jcp.1041120314. [DOI] [PubMed] [Google Scholar]
- Uoshima N, Ozawa M, Kimura S, Tanaka K, Wada K, Kobayashi Y, Kondo M. Brit J Haematol. 1995;91:30–36. doi: 10.1111/j.1365-2141.1995.tb05240.x. [DOI] [PubMed] [Google Scholar]
- Vannucchi AM, Paoletti F, Linari S, Cellai C, Caporale R, Ferrini PR, Sanchez M, Migliaccio G, Migliaccio AR. Blood. 2000;95:2559–2568. [PubMed] [Google Scholar]
- Verdier F, Chretien S, Muller O, Varlet P, Yoshimura A, Gisselbrecht S, Lacombe C, Mayeux P. J Biol Chem. 1998a;273:28185–28190. doi: 10.1074/jbc.273.43.28185. [DOI] [PubMed] [Google Scholar]
- Verdier F, Rabionet R, Gouilleux F, Beisenherzhuss C, Varlet P, Muller O, Mayeux P, Lacombe C, Gisselbrecht S, Chretien S. Mol Cell Biol. 1998b;18:5852–5860. doi: 10.1128/mcb.18.10.5852. [DOI] [PMC free article] [PubMed] [Google Scholar]
- Waldmann V, Rabes HM. Pathol Res Prac. 1996;192:883–891. doi: 10.1016/S0344-0338(96)80067-7. [DOI] [PubMed] [Google Scholar]
- Yoshikawa H, Matsubara K, Qian GS, Jackson P, Groopman JD, Manning JE, Harris CC, Herman JG. Nat Genet. 2001;28:29–35. doi: 10.1038/ng0501-29. [DOI] [PubMed] [Google Scholar]
- Yoshimura A, Ohkubo T, Kiguchi T, Jenkins NA, Gilbert DJ, Copeland NG, Hara T, Miyajima A. EMBO J. 1995;14:2816–2826. doi: 10.1002/j.1460-2075.1995.tb07281.x. [DOI] [PMC free article] [PubMed] [Google Scholar]
- Zhang JG, Farley A, Nicholson SE, Willson TA, Zugaro LM, Simpson RJ, Moritz RL, Gary D, Richardson R, Hausmann G, Kile BJ, Kent SBH, Alexander WS, Metcalf D, Hilton DJ, Nicola NA, Baca M. Proc Natl Acad Sci USA. 1999;96:2071–2076. doi: 10.1073/pnas.96.5.2071. [DOI] [PMC free article] [PubMed] [Google Scholar]


