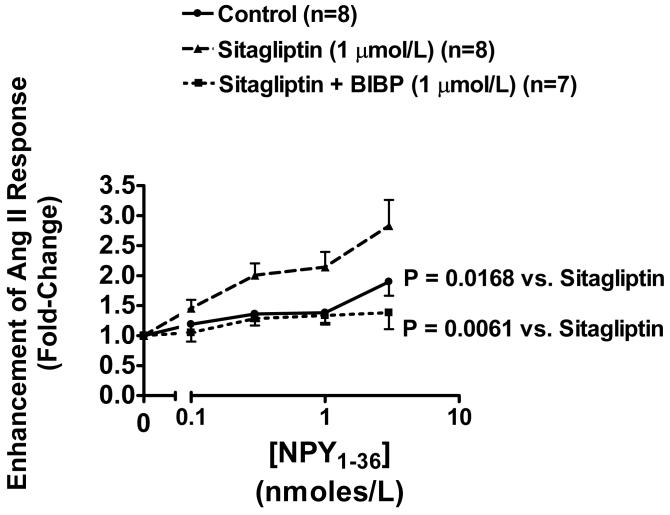
Figure 2.
Line graph illustrates the fold-increase in the renovascular response to Ang II (100 pmol/L) induced by increasing concentrations of NPY1-36. The fold-increase was calculated by dividing the renovascular response to Ang II before administering NPY1-36 into the renovascular response to Ang II in the presence of each concentration of NPY1-36. Experiments were performed in the absence and presence of sitagliptin (1 μmol/L) or sitagliptin plus BIBP3226 (1 μmol/L). Basal perfusion pressure was 48 ± 2 mm Hg was similar among the three groups and was not affected by NPY1-36, sitagliptin or BIBP3226. The basal renovascular response to Ang II was 7 ± 1 mm Hg and was not affected by sitagliptin or sitagliptin plus BIBP3226. The p-value is for the treatment (sitagliptin or sitagliptin plus BIBP3226) term in the repeated measures 2-factor analysis of variance. Values represent means ± SEM for the indicated sample size.

