Abstract
Two major branches of engineering mechanics are fluid mechanics and structural mechanics, with many practical problems involving the effect of the first on the second. An example is the design of an aircraft's wings to bend within reasonable limits without breaking under the action of lift forces exerted by the air flowing over them; another is the maintenance of the structural integrity of a dam designed to hold back a water reservoir which would exert very large forces on it. Similarly, fluid and structural mechanics are involved in the engineering analysis of erectile function: it is the hydraulic action of increased blood flow into the corpora cavernosa that creates the structural rigidity necessary to prevent collapse of the penile column.
Keywords: erectile dysfunction, impotence, penile buckling, per cent smooth muscle, expandability, corporal cavernosal veno-occlusion
1. Introduction
The science of mechanics may be simply defined as the study of the motions of bodies and the forces that cause the motions. Engineering mechanics is concerned with either the dynamic problem of providing forces to produce motion (such as the thrust of a jet engine to propel an aircraft) or the static problem requiring prevention of motion in the presence of (unbalanced) forces (as in the design of a bridge not to collapse under loads it is to carry).1
Penile impotence, or erectile dysfunction (ED), is due primarily to physical rather than psychological factors, a view that was not generally held as recently as 30 years ago (Kinsey et al. 1948; Derogatis & Laban 1998). ED was defined by a US National Institutes of Health panel as the ‘consistent inability to obtain or maintain an erection sufficient for satisfactory sexual performance’ (NIH consensus panel 1993). It can also be defined from an engineering mechanical point of view as the collapsing or buckling of the penile column in the presence of an axial force when attempting or following vaginal intromission. The latter definition offers an objective quantitative criterion which, with the aid of engineering column buckling theory, has the promise of providing a mathematical relationship of penile buckling to its physiological causes. This definition is not meant to diminish the importance of the former subjective definition; ED disease is a quality of life, not a life-threatening concern and the degree of satisfaction, or lack thereof, of an individual and his partner with his physical condition should be the ultimate criterion of what kind of treatment, if any, may be appropriate.
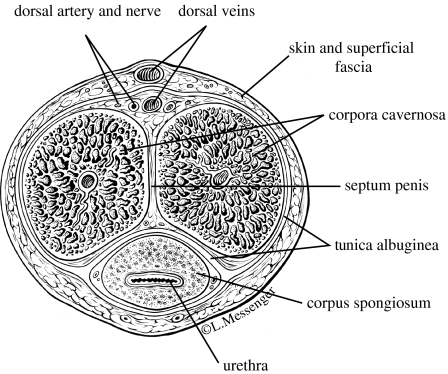
The phenomenon of erection involves actions other than mechanical processes. The brain sends a signal via the spinal cord through the parasympathetic nervous system causing release of nitric oxide, NO, a neurotransmitter which chemically relaxes the smooth muscles in the corpora cavernosa, the two expansion chambers in the penis (Goldstein 1995; Saenz de Tejada et al. 2004). This enables enhanced blood flow into the lacunar spaces of the corpora, a mechanical process, causing expansion of the erectile tissue, with the concomitant constriction of venous outflow resulting in blood containment, penile enlargement and rigidity, similar to the process of forcing air into a balloon. (The mechanics of blood outflow constriction will be discussed in §6: ‘Veno-occlusive function of the corpora cavernosa’.) The third penile chamber, the corpus spongiosum which surrounds the urethra, does not expand (figure 1).
Figure 1.
Cross-section of the penis (Padma-Nathan et al. 1999).
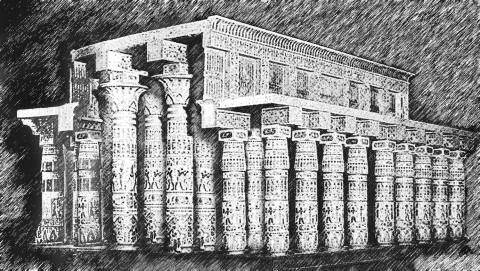
Major advances in the development of classical mechanics were made in the eighteenth and nineteenth centuries following invention of the calculus by Sir Isaac Newton and Gottfried Leibnitz in the last half of the seventeenth century. Serious applications of mechanics to biosystems did not occur until the twentieth century. Modern column buckling theory is based on the pioneering work published in the latter part of the eighteenth century by the Swiss mathematician, Leonhard Euler (1727–1783). Before that, large building structures were supported by many redundant columns, presumably because their designers did not know the minimum number needed. Cases in point are ancient temples such as the Egyptian Hypostyle Hall (approx. 1700–1000 BC; figure 2) and the Greek Parthenon (built 447–432 BC; figure 3). It is somewhat surprising that even though Euler's buckling theory has been used successfully for over two centuries (even prior to the American and French revolutions), there is no evidence of its application to the prediction of penile buckling until the last decade of the twentieth century.
Figure 2.
Model of the Egyptian Hypostyle Hall (ca 1700–1000 BC).
Figure 3.
Model of the Greek Parthenon in Athens (built 447–432 BC).
2. Mathematical foundations of buckling
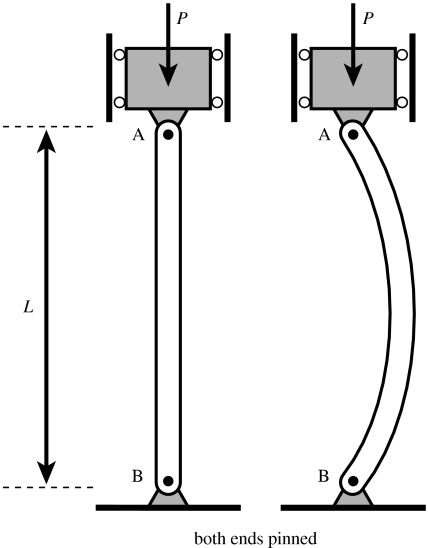
Euler's quite simple formula which predicts the axial force, FBUC, that produces buckling of a column with both ends pinned (figure 4) is given by the following equation (Beer & Johnson 1992):
| (2.1) |
Here, L is the axial column length; E is Young's compressive modulus of elasticity; and I is the second moment of area of the column cross-section about its neutral axis (see appendix B for definitions). This formula was applied relatively recently to a penile model which included the following assumptions:
the penile shaft has a circular cylindrical shape,
the neutral axis lies on the diameter,
the modulus of elasticity, E, is the same in the axial and radial directions, i.e. the tissue is isotropic,
the modulus of elasticity, E, of the pendulous penis is the same as that of the corpora cavernosa,
the same is true of the volume to flaccid volume ratio, V/VF, and
the expansion ratios of length to flaccid length are the same in the axial and radial directions, i.e. L/LF=D/DF.
Figure 4.
Buckling of a column due to an axial force, P, with both ends pinned.
The derivation resulted in the following penile buckling formula (Udelson et al. 1998b):
| (2.2) |
where ΔP is the increase in intracavernosal pressure (ICP) above the flaccid state; D is the diameter; L is the length; ν is the cavernosal Poisson's ratio; VE/VF is the erect to flaccid volume ratio defined as the distensibility; and X is the cavernosal expandability defined as the negative reciprocal of the corporal bulk modulus in the semi-erect state (Udelson et al. 1998a). Expandability, which has the dimensions of inverse pressure, is a measure of the degree of fibrosis in the corporal tissue and reflects the ability of that tissue to expand to its erect volume at relatively low ICPs. (The relationship of X to cavernosal tissue properties is discussed in §5: ‘Expandability as a measure of cavernosal tissue fibrosis’.) The subscript ‘P’ denotes the ‘pendulous penis’, ‘F’ denotes ‘flaccid’ and ‘E’ denotes ‘erect’. All of the terms on the right-hand side of equation (2.2) are dimensionless except for DF2/X. If DF is expressed in cm and X in mmHg−1, multiplying the right-hand side of equation (2.2) by 13.55×10−4 will give the buckling force in kilograms.2 To enable numerical calculations, the following additional assumption was made: Poisson's ratio, ν, which was difficult to measure in vivo, was assumed to have a magnitude of one-quarter for all patients based on the fact that 0<ν<(1/2) for isotropic materials (Beer & Johnson 1992).
Prior to the investigation that resulted in equation (2.2), the most widely studied physical parameter influencing penile rigidity had been ICP (Lue et al. 1984; Wespes & Schulman 1984; Freidenberg et al. 1987; Frohrib et al. 1987).3 Equation (2.2) reflects the intuitive notion that there should be a dependence of buckling force on cavernosal tissue properties and penile geometry in addition to the ICP. For example, the presence of the aspect ratio term, D/L, in the equation seems reasonable if one considers that a toothpick can be broken with a smaller axial force than a thicker rod of identical length which is made with the same wood.
Equation (2.3) is a theoretically derived expression for the penile volume ratio, V/VF, as a function of X, ΔP and the distensibility VE/VF (Udelson et al. 1998a),
| (2.3) |
Every adult male is assumed to have unique and virtually constant values of distensibility, VE/VF, and expandability, X. However, both may vary over time; the latter, for example, might vary owing to ageing (Wespes et al. 1991; Tarcan et al. 1998; Gefen et al. 2001; Linder-Ganz et al. 2006) or other factors that might cause cavernosal tissue fibrosis such as a radical prostatectomy surgical procedure (Zippe et al. 1999).
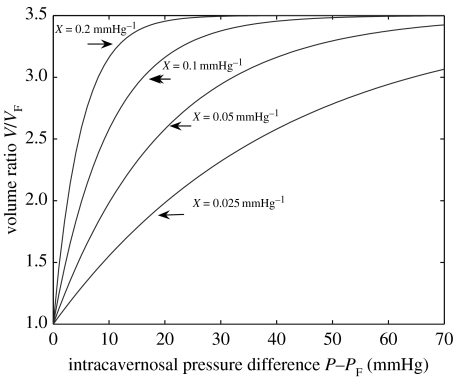
Figure 5 shows theoretical plots of V/VF versus ΔP (equation (2.3)) for five hypothetical values of the expandability parameter, X, but with the same value of distensibility, VE/VF, here arbitrarily chosen to be 3.5. Full penile erection, V=VE, is achieved asymptotically as ICP increases. The areas to the left of the curves in the figure are a measure of the work necessary to achieve full erection.4 Thus, for men with similar penile geometries (same distensibilities), those with higher expandabilities will achieve full erection at lower ICPs, with less work energy required to produce the expansion.
Figure 5.
Theoretical variation of volume ratio, V/VF, versus ΔP for arbitrarily chosen values of expandability, X, with distensibility, VE/VF equal to 3.5.
3. Obtaining patient data
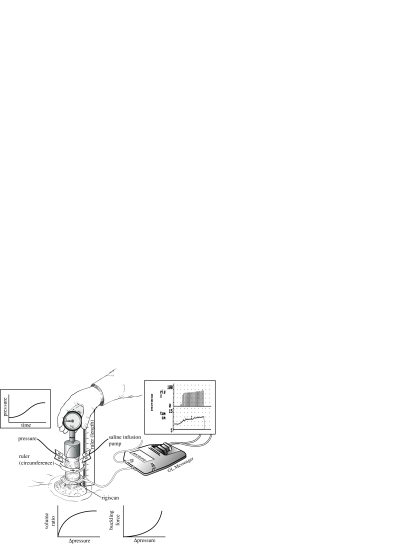
Two studies over a 5-year period involving 21 and 36 men (totally 57) who presented with ED problems were reported (Udelson et al. 1998a,b, 1999). The means, standard deviations and ranges of important parameters measured in the first study (1998) are given in table 1 (Udelson et al. 1998b).5 The routine clinical diagnostic procedure performed on these patients was a Dynamic Infusion Cavernosometry and Cavernosography (DICC; Goldstein 1995). The essential aspects of the DICC, important to the engineering analysis, are the gradual infusion of saline solution into the corpora cavernosa resulting in penile expansion from the flaccid to erect states with increasing ICP, and the measurement of the following parameters at 10 mmHg ICP increments:
intracavernosal pressure,
pendulous penile length and circumference (at mid-shaft) by ruler, and
axial compressive force causing the onset of buckling (FBUC).
Table 1.
Data for the 21 patients.
| mean±s.d. | range | |
|---|---|---|
| cavernosal expandability X (mmHg−1) | 0.0870±0.0345a | (0.0388–0.1875) |
| tunica distensibility VE/VF | 2.89±0.757 | (1.7–5.0) |
| penile aspect ratio (D/L)P | 0.302±0.033 | (0.26–0.382) |
| flaccid penile diameter (DF)P (cm) | 2.77±0.288 | (2.23–3.34) |
Calculated for 17 of the 21 patients with cavernosal expandability determined by the value which gave the best least squares fit of the measured penile volume–intracavernosal pressure data in each patient and calculated for 4 of the 21 patients with cavernosal expandability determined by the best fit of the buckling force curve to the measured buckling force data.
Two needles are inserted into the corpora in this procedure, one for the pump infusion of saline solution and the other for transducer measurement of ICP. Figure 6 shows a schematic of the methodology used (Udelson et al. 1999). Axial penile compressive forces were applied to the glans penis parallel to the axis of the penile shaft using a standard weight scale with a wide protective cap. The FBUC recorded was the force observed to cause curvature of the penile shaft such that a small additional force would lead to buckling, determined to the nearest 0.1 kg.
Figure 6.
Schematic of the methodology used during a DICC.
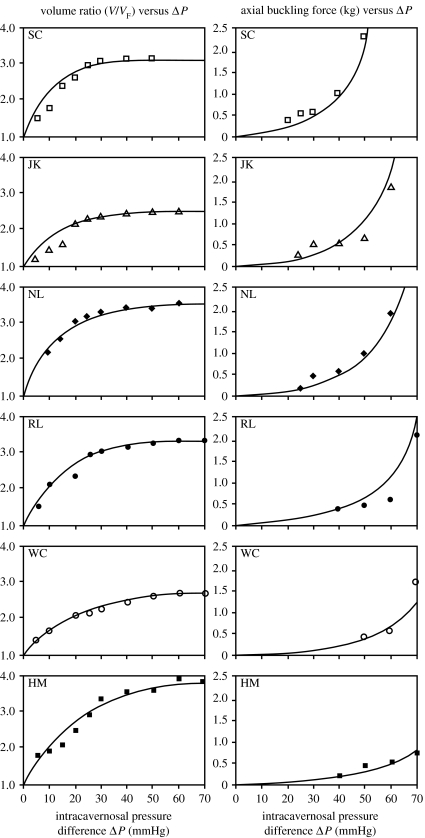
Data for six of the patients studied are presented in the two vertical graphs of figure 7 (Udelson et al. 1999). The dots show values of V/VF versus ΔP and FBUC versus ΔP, based on the measurements of the parameters listed above. The solid lines in figure 7 for V/VF versus ΔP are plots of the theoretical equation (2.3), where values of expandability, X, were chosen to provide a best fit of the equation to the data points, using the least squares method (Potter & Goldberg 1987). This was the means by which the value of X was determined for each patient. The solid lines in the figure for FBUC versus ΔP are plots of theoretical equation (2.2), in which the value of aspect ratio, D/L, for each patient was chosen to be the average of the measurements taken at each 10 mmHg pressure interval. (There was insignificant variation in D/L with pressure, consistent with assumption (vi), stated earlier.)
Figure 7.
Measured data and theoretical curves of V/VF and FBUC versus ΔP for six patients representing a wide spectrum of FBUC magnitudes.
These six patients were chosen to represent a wide spectrum of buckling force magnitudes as a function of ΔP. Data obtained are given in table 2. Note that (comparing tables 1 and 2) patient SC, who exhibited the highest buckling forces for given ΔP's, had only average X and D/L. However, he had a flaccid diameter, DF, in excess of one standard deviation above the average, accounting for his above average resistance to buckling (see equation (2.2)). Note also that patient NL had higher resistance to buckling than patient RL for given ΔP's, although having a (slightly) smaller value of X, i.e. almost the same erectile tissue characteristics. However, he had a significantly higher penile aspect ratio, D/L (approx. 1 s.d.), and somewhat higher flaccid diameter, DF (approx. 1/2 s.d.), i.e. more favourable geometrical characteristics.
Table 2.
Parameters for six typical patients who represent a wide spectrum of axial buckling force magnitudes (0.32–2.02 kg).
| patient | theoretical axial buckinga force (kg) | cavernosal expandability, X (mmHg−1) | tunical distensibility VE/VF | penile aspect ratio (D/L) AV | flaccid penile diameter, (DF)P (cm) |
|---|---|---|---|---|---|
| SC | 2.02 | 0.082 | 3.10 | 0.307 | 3.09 |
| JK | 1.12 | 0.074 | 2.50 | 0.310 | 2.71 |
| NL | 0.87 | 0.063 | 3.58 | 0.326 | 2.71 |
| RL | 0.65 | 0.065 | 3.37 | 0.291 | 2.55 |
| WC | 0.42 | 0.052 | 2.66 | 0.283 | 2.71 |
| HM | 0.32 | 0.045 | 3.92 | 0.294 | 2.48 |
Calculated at ΔP=50 mmHg.
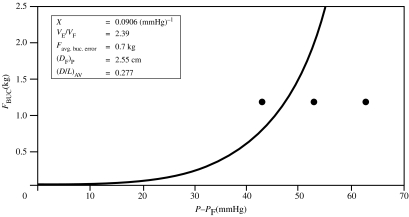
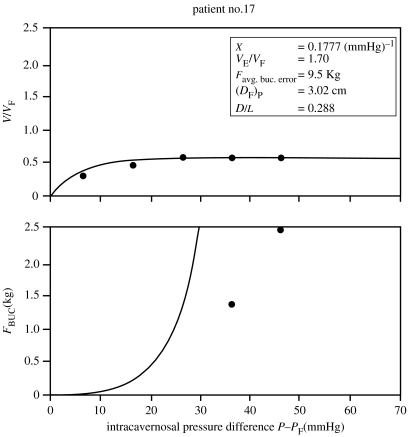
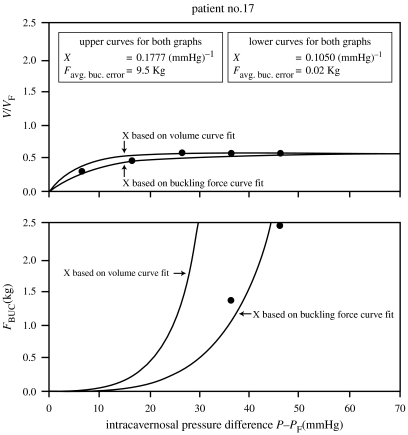
The agreement of measured buckling forces with the theoretically predicted values in figure 7 was typical for approximately 80% of patients in the studies. One example of poor agreement is shown in figure 8; the discrepancy here is unexplained although this patient had Peyronie's disease which is manifested by curvature of the penile shaft (Hakim et al. 1996; Carriere et al. 1998; Gefen et al. 2002), and there may have been difficulty in determining the onset of buckling. Another example of cases showing poorer agreement between the measured and theoretical values of FBUC is shown in figure 9 (Udelson et al. 1998b). Figure 10 shows the measured data points for the same patient, but with two theoretical curves for the V/VF and FBUC graphs: one curve in each graph is based on a value of X which gave the best fit of V/VF versus ΔP to the data (as in figure 9), and the other is based on a value of X which gave the best fit of FBUC versus ΔP to the data. This type of anomaly tended to occur for patients with lower distensibilities (VE/VF), and it is thought that more frequent measurements of V/VF versus ΔP would render more accurate values of X in fitting the V/VF curves to the data. One proposal is to continuously and automatically, rather than discretely and manually, record the geometrical and force data, especially in the range of ΔP, where V/VF has its steepest rate of increase. (This proposal is discussed in §8: ‘Proposed automated DICC procedure’.)
Figure 8.
Measured FBUC versus ΔP and theoretical curve for patient with Peyronie's disease.
Figure 9.
Example of a patient for whom measured and theoretical FBUC shows poorer agreement when X is calculated conventionally.
Figure 10.
Measured data FBUC versus ΔP for patient in figure 9 with two theoretical curves: one with X determined conventionally (as in figure 9) by fitting data to V/VF versus ΔP curve and the other by fitting data to FBUC versus ΔP curve.
4. Some possible causes of ED: dating and matrimonial services
For a patient who has low resistance to buckling, as shown by his FBUC versus ΔP graph (figure 7), the cause of his ED is probably due primarily to a low X, an indicator of corporal tissue fibrosis; in this case, some type of penile implant may be recommended. However, if the graph shows high resistance to buckling, this may be a false positive indicator that ED is absent. It should be remembered that these graphs are generated during a DICC procedure by artificially forced infusion of saline solution into the corpora. An example in which a false positive reading might occur is when there is psychogenic impotence, i.e. the individual may have difficulty in becoming sexually aroused, with the brain consequently failing to send a signal to the corpora. Or else there could be neurogenic impotence such as in the case of spinal chord injury, where the brain is willing but unable to send a signal.
A different type of impotence occurs if a patient is ‘leaky’, i.e. his corpora cannot be filled even with artificial infusion due to a tear in the tunica albuginea, which is the casing that encloses each of the corpora cavernosa (figure 1). Another cause of impotence is cavernosal artery insufficiency (Persson et al. 1989; Aboseif et al. 1990; Tarcan et al. 1998). The latter problem is analogous to coronary artery disease and can often be fixed in a similar fashion by arterial revascularization (bypass) surgery. Diminished blood flow to the corpora can lead to loss of erectile tissue smooth muscle, just as coronary artery disease can lead to heart muscle damage. In these cases of ‘failure to fill’, it is usually impossible to produce any FBUC curve at all in a DICC procedure.
Now, suppose that psychological and physiological problems, such as in the examples discussed above, do not exist and that the curves generated in figure 7 by a DICC can be replicated by naturally caused blood engorgement of the penis as a result of sexual arousal. Then can a patient be declared potent or impotent by checking his resistance to buckling at his highest attainable ICP? The answer may still be no because it depends on the axial resistive force presented by his partner that is necessary to overcome in order to achieve vaginal intromission. This resistive force varies in women and is a function of such factors as vaginal size and lubrication. Thus, an individual male may exhibit ED with one partner but not with another.
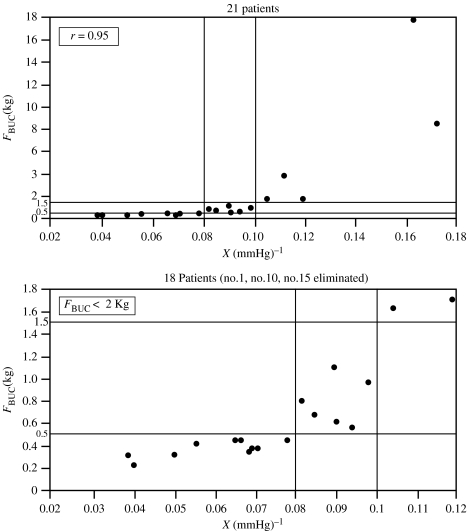
Experiments were conducted on female volunteers (Karacan et al. 1985) to measure the forces needed for vaginal penetration using a hand-held gauge attached to round-tipped penis-shaped Plexiglas rods of various diameters, with and without lubrication. The result was that penetration could be achieved in all cases if the exerted force was approximately 1.5 kg or larger, but could not be achieved in any case if the exerted force was approximately 0.5 kg or less. This implies that men whose penile buckling force is between 0.5 and 1.5 kg at their highest attainable ICP would be successful with some partners but not with others.
For the 21 patients studied (Udelson et al. 1998a,b), assuming a ΔP equal to 40 mmHg, figure 11 shows a scatter diagram of their buckling forces versus their expandabilities (Udelson et al. 1998c). According to Karacan's criteria, 5 of these men could achieve vaginal intromission with any partner, 10 could not achieve it with any partner and 6 could or could not, depending on the partner. If these numbers appear to be disappointing, it should be noted that the individuals in this study were patients who presented with ED problems and that the assumption of maximum ΔP equal to 40 mmHg is somewhat below the normal absolute ICP of 60–90 mmHg (Udelson et al. 1998a) for healthy men.6
Figure 11.
FBUC versus X for 21 patients at ΔP=40 mmHg.
Dating and matrimonial services which attempt to match couples on the basis of compatible interests, beliefs, ages, as well as social and educational backgrounds, often rely on written questionnaires. In the future, standard matching procedures will perhaps include clinical DICC examinations for males and Karacan buckling force threshold tests for females. It may be ED or not ED that is the (important) question. (Refer to appendix A for a disclaimer regarding this paragraph.)
5. Expandability as a measure of cavernosal tissue fibrosis
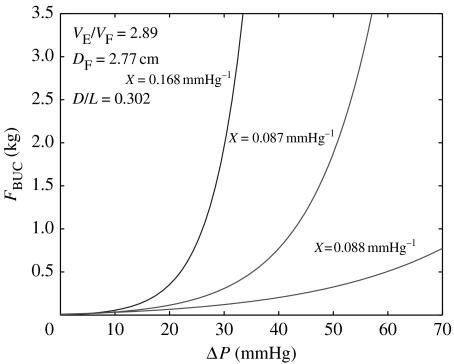
Theoretical equation (2.2) indicates that buckling force, FBUC, is a function of ICP, penile geometry and cavernosal expandability. For men with similar geometries and ICP, higher values of expandability produce higher resistance to buckling. Figure 12 shows plots of equation (2.2) for three hypothetical individuals, all having the same geometries (here assumed to be the average values of distensibility (VE/VF=2.89)P, aspect ratio (D/L=0.302)P and flaccid diameter (DF=2.77 cm)P given in table 1, but with different values of expandability, X, assumed to be the highest (X=0.168), average (X=0.0870) and lowest values (X=0.0388 mmHg−1) given in table 1).
Figure 12.
Theoretical curves of FBUC versus ΔP for three hypothetical patients, all with the same average values of distensibility, VE/VF, aspect ratio, D/L, and flaccid diameter, DF, but having the highest, average and lowest values of expandability, X.
Since it seems intuitively clear that FBUC depends on geometry, ICP and erectile tissue characteristics, it appears that X is a measure of ability for the tissue to expand. According to Karacan's criteria (see §4), the hypothetical patient in figure 12 having the lowest expandability would experience ED with any partner (FBUC<0.5 kg), unless he achieved a ΔP more than 60 mmHg, and only limited success if he were able to attain higher ICP. On the other hand, the hypothetical patient having the highest expandability would achieve vaginal intromission with any partner (FBUC>1.5 kg), if he developed an ICP of only 30 mmHg.
Increase in cavernosal fibrosis is manifested by a decrease in the amount of smooth muscle and concomitant increase in collagen connective tissue. The existing traditional method of assessing the expansive quality of erectile tissue requires a biopsy of cavernosal tissue in order to obtain its per cent smooth muscle (PSM) content by histomorphometric analysis (Conti & Virag 1989; Wespes et al. 1991; Andersson et al. 1995). Smooth muscle content is a good predictor of corporal fibrosis and, therefore, the veno-occlusive mechanism (Nehra et al. 1996). Expansion leads to veno-occlusion, which is the process of reducing the rate of blood flow out of the corpora cavernosa, resulting in blood accumulation and rigidity. It should be clear that veno-occlusion is necessary for erectile function. (Its mechanism will be discussed in §6: ‘Veno-occlusive function of the corpora cavernosa’.)
A description of the quite invasive procedure to obtain corporal biopsies which are performed with a biopsy gun was reported (Malovouvas et al. 1994): ‘The biopsy needle is introduced … through the tunical albuginea into the corpus cavernosum. With one hand the penis is kept stretched and with the other hand the needle is fired from an anterior to a posterior trajectory. More than one pass of the needle can be made to obtain adequate tissue’. Complications include bleeding, infection, failure to obtain tissue, corporal fibrosis and arterial injury.
Measurement of expandability during a DICC has the prospect of providing an alternative, less invasive method of assessing cavernosal tissue quality. Dynamic cavernosometry does not involve any intracavernosal invasion other than placement of two 20-gauge butterfly needles to record pressure and infuse heparinized saline (Hatzichristou et al. 1995).
The relationship of PSM to X was demonstrated in experiments on New Zealand white rabbits (Nehra et al. 1998). Twenty rabbits (six to seven months old) were divided into three groups: a control group (n=7) was placed on a regular diet alone; a hypercholesterolaemic group (n=5) received a 0.5% cholesterol diet alone; and an atherosclerotic group (n=8) underwent both ingestion of a 0.5% cholesterol diet and shutting off of arterial blood to induce penile ischaemia, producing atherosclerotic vascular disease.7 After 16 weeks, volume–pressure curves were generated on the corpora cavernosa (which had been removed from the animals) by infusing saline solution and measuring the resulting pressures and volumes; X was determined by the same least squares method of fitting equation (2.3) to the data as in a human DICC procedure. Volume was estimated in two ways: by penile geometrical ruler measurements (as in a DICC) as well as measurement of the saline infused into the cavernosa.8 In addition, per cent smooth content was determined by histomorphometric analysis of the biopsied cavernosal tissue.
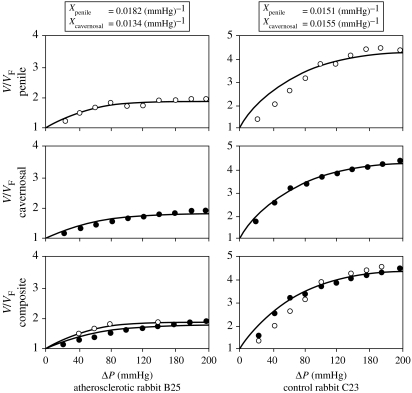
Two volume–pressure curves (one for each of the volume measurement methods) were generated producing two values of expandability for each rabbit. Examples of the curves for two animals are shown in figure 13. In one case, the curves essentially agree, in the other, they do not. Disagreement of the penile geometric volume curve with the cavernosal infused volume curve (and the resulting disagreement in X), where it occurred, was presumed to be due to irregularity of penile geometrical measurements by ruler and the assumption of a circular cylindrical penile model, which is less valid for rabbits than for humans (see figure 14). The average measured distensibilities, expandabilities (two values) and per cent smooth muscle content for each of the three groups of rabbits, together with their standard deviations, are given in table 3.9
Figure 13.
Theoretical and measured data points of volume ratio, V/VF, versus ΔP for (a) atherosclerotic and (b) control animals. (Expandability Xcavernosalinfused (filled circles) and Xpenilegeometric (open circles) are shown.)
Figure 14.
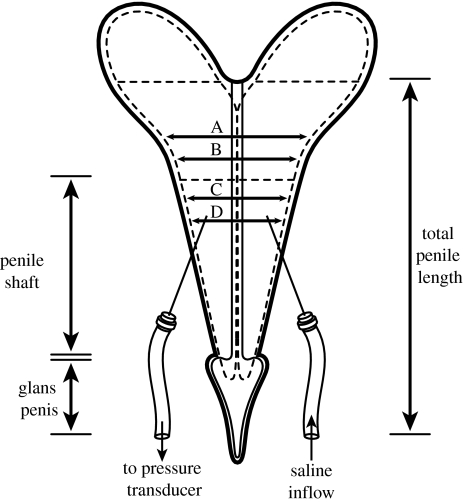
Schematic of rabbit penis showing locations of needle insertion and methodology of geometric measurements using penile shaft diameters at four different locations (A, B, C and D).
Table 3.
Distensibility, expandability by geometric and infusion measurements, and per cent smooth muscle content in three rabbit groups. (Data are expressed as mean±s.d.)
| groups | tunical distensibility | cavernosal expandability Xpen.geom. (mmHg−1) | expandability Xcav.infuse. (mmHg−1) | per cent trabecular smooth muscle |
|---|---|---|---|---|
| control (n=7) | 4.04 (±0.62) | 0.01450 (±2.94×10⁻³) | 0.0165±3.04×10⁻³ | 45.4±1.6 |
| hypercholesterolemic (n=5) | 2.57(±1.04) | 0.01243 (±3.55×10⁻³) | 0.0116±1.63×10⁻³ | 39.1±0.85 |
| atherosclerotic (n=8) | 1.92(±0.38) | 0.0161 (±4.51×10⁻³) | 0.0119±1.26×10⁻³ | 33.9±0.56 |
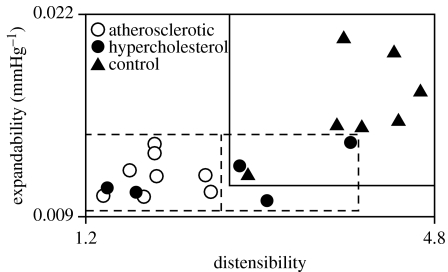
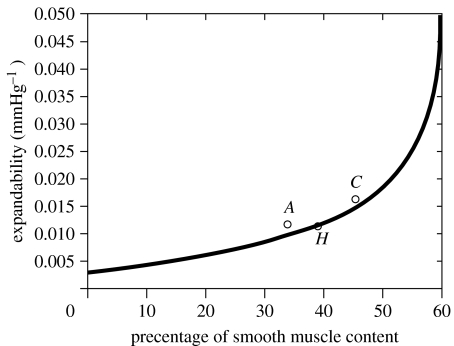
In the following, expandability obtained by the measured infused volume method is used since it is assumed to be a more accurate value for the rabbit penis. Figure 15 is a scatter diagram of the expandabilities versus distensibilities for all 20 rabbits. The control animals had the highest values of expandability. There was no significant difference between the hypercholesterolaemic and atherosclerotic groups. The three circles in figure 16 show the averages of the volume–pressure curve-fitted expandabilities for each of the three groups of rabbits plotted against the averages of the histomorphometric measured per cent smooth muscle content. The solid line in figure 16 is a plot of a theoretical formula (Luo et al. in press) relating X to PSM, the derivation of which is discussed below.
Figure 15.
Scattergram plot of expandability, X, versus distensibility, VE/VF, for the three groups of rabbits.
Figure 16.
Theoretical three-dimensional model (solid line) predicting relationship between expandability, X, and per cent smooth muscle content, PSM. Data points (circles) represent means of experimentally determined X and PSM of rabbits for control (C), hypercholesterolaemic (H) and atherosclerotic (A) groups.
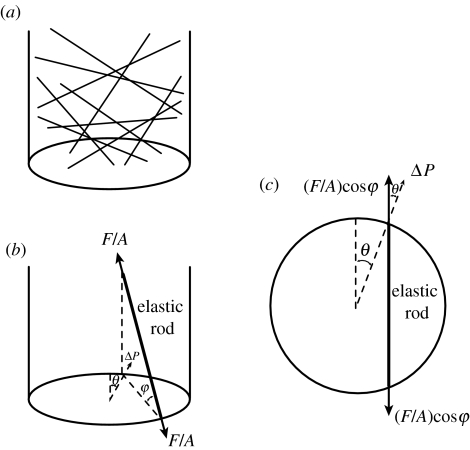
The theoretical relationship between expandability and per cent smooth muscle was derived based on a refined three-dimensional model, using the principles of engineering mechanics of materials.10 The corpus cavernosum was considered to be a circular cylinder that increases in volume when fluid it contains exerts a net outward pressure on the cylindrical walls. The resistance to expansion caused by the erectile tissue and tunical wall was represented by N straight uniformly distributed elastic rods, connecting the interior walls in random fashion, as shown in figure 17a. The model used the well-known Hooke's law for the rods (a recognized simplification of the more complicated real-world conditions; Beer & Johnson 1992)
| (5.1) |
where F is the stretching force on a rod which has cross-sectional area A, length l, increase in length Δl and tensile Young's modulus E. The magnitude of net pressure force, ΔP, on the walls creating the corporal expansion was based on the average of the tensile force components normal to the wall exerted on the randomly oriented and uniformly distributed rods. (Figure 17b,c show diagrams of force/pressure relationships used in the derivation.)
Figure 17.
Three-dimensional model of corpus cavernosum. (a) Erectile tissue is represented by N straight elastic rods connecting the interior walls in random fashion. (b) Force analysis on a rod: F, stretching force on rod; A, rod cross-sectional area; ϕ, angle of rod with respect to a horizontal plane; θ, angle with respect to a vertical plane. (c) Projection of a rod on a plane perpendicular to the cylindrical axis.
It was assumed that n of the N elastic rods (n<N) had the same value of Young's modulus, E and N−n of the rods were partially elastic, all having an identical larger modulus equal to α×E (α>l).11 Equation (5.2), the final result of the model analysis, gives the relationship between expandability and per cent smooth muscle, where n/N is considered analogous to PSM (Luo et al. in press),
| (5.2) |
The solid line in figure 16 is a plot of equation (5.2) (X versus n/N (PSM)), for the data points (circles) representing the average measurements for the three groups of rabbits (Nehra et al. 1998). The values of the parameters in the equation were chosen as follows: pressure rise, ΔP, which represents the rise in gauge pressure from zero to the semi-erect state, was taken to be 100 mmHg (the mean value of the rabbit testing range from the flaccid to (approximate average) erect state, 0<ΔP<200 mmHg); distensibility, VE/VF, was taken to be 2.82 which was the mean value for all of the rabbits. (Expandability theory (Udelson et al. 1998a) assumes that V/VF for the corpora can be approximated by the penile V/VF.) The only unknown numbers in the equation were E and α; these were chosen to have the magnitudes that gave the best fit of equation (5.2) to the three data points. This resulted in the following numerical values12:
for the elastic rods in the present model at the semi-erect state (since X is defined in terms of β at the SE state). (E is variable (Kelly 1999) and increases in magnitude as β increases (Udelson et al. 1998b), which, in turn, increases with volume (Udelson et al. 1998a).) Flaccid E is close to ESE (EF∼(1/2)ESE for average VE/VF), but fully erect E is infinitely greater than ESE. The model's rods were intended to represent the combined overall resistance to expansion due to all components including cavernosal tissue and tunica.
Now, the following values of Young's modulus, E, have been suggested (Gefen et al. 1999)
The latter value was based on the assumption that the corpus cavernosum has tissue microstructure similar to that of the rabbit lung parenchyma. It is noted that the imputed value of E for the elastic rods in the rabbit model (0.01 MPa) is in the same order of magnitude as E suggested by Gefen for the rabbit corpus cavernosum. This implies that resistance to penile expansion might be due primarily to the cavernosal tissue rather than the tunica. It further suggests that the tunica, which is less compliant (higher E), is not taut in the flaccid state and (at least) in the early stages of expansion.
Figure 16 reflects the fact that there is a negligible difference in the measured experimental values of X for the two diseased groups of rabbits, hypercholesterolaemic (H) and atherosclerotic (A) (circles), but a relatively large difference in values of PSM content. This behaviour appears to be corroborated by the theory, equation (6.3) (solid line), which shows X to have decreasing sensitivity to changes in PSM at its smaller values. (Figure 16 indicates that a change in per cent smooth muscle content at its smaller values (approx. 20–25%) generates a small change in cavernosal expandability. For higher values (approx. 40–45%), an equivalent change in smooth muscle generates larger changes in cavernosal expandability, i.e. the curve is relatively flat for small values of per cent smooth muscle content, but increases in slope as PSM increases.)
The import of the above is the suggestion that measurement of X rather than PSM may be a more accurate indicator of corporal tissue quality and veno-occlusive function (in addition to being less invasive), e.g. the two diseased groups of rabbits have significantly different PSM but the same X, and it is only the latter that appears in the theoretical equation (2.2), which predicts the conditions producing penile buckling.
6. Veno-occlusive function of the corpora cavernosa
Veno-occlusion is the process by which blood flow out of the corpora cavernosa is largely (but not completely) shut down, enabling the blood flowing in to accumulate, creating penile expansion and rigidity. The primary site of the occlusion has been postulated to be within the subtunical venules, which are the small corporal veins under the tunical wall. The fundamental mechanics of occlusion had been presumed to be the compressive forces exerted by the expanding corpora against the less compliant tunica, essentially ‘squashing’ the subtunical venules (Benson et al. 1980; Anderson et al. 1984; Fournier et al. 1987; Lue & Tanagho 1987; Breza et al. 1989; Chaudhoke & Lue 1989; Aboseif et al. 1990; Banya et al. 1990). Certain phenomena have not been completely explained by this mechanism, such as: (i) actual occlusion is not total, and (ii) it appears that the tunica may not be taut (i.e. not completely stretched) at least in the early stages of expansion, as suggested in §5 of this review, thereby not providing a firm surface on which compressive force exerted by the expanding corpora could act.
It has recently been proposed (Udelson et al. 2000) that veno-occlusion is due at least partially to the elongation of the corporal venules, which occurs as the whole corpora cavernosa expand and stretch. With this hypothesis, maximal venule elongation can be predicted to range from 1.2 to 1.7 times their flaccid lengths (the cube root of the range of distensibilities shown in table 1; §3). Irrespective of other postulated veno-occlusive mechanisms, corporal expansion would be expected to increase venule outflow resistance as a result of increased venule length and decreased luminal diameter. Flow resistance for laminar (i.e. non-turbulent) flow of a Newtonian fluid13 in a round tube is proportional to the tube length and inversely proportional to the fourth power of its internal diameter as given by the following equation (Olson & Wright 1990):
| (6.1) |
where μ is the fluid (dynamic) viscosity; L is the tube length; and D is the internal diameter.14
The decrease in diameter with elongation is based on the well-known property of materials that extrusion in one linear dimension results in contraction in orthogonal directions. For a solid circular cylinder which is stretched in the axial direction, the ratio of (absolute) relative decrease in diameter to relative increase in length (radial strain to axial strain) is called Poisson's ratio, ν (previously discussed in connection with equation (2.2)),
| (6.2) |
where D is the diameter of the unstretched solid cylinder and L is the unstretched length (ν also depends on the material properties of the cylinder).
For a venule which stretches during erection, the concern is with the decrease in diameter of the hollow space within its inner diameter. A different ratio, called the luminal constrictability, N, may be said to apply. N was defined as the ratio of (absolute) relative decrease in diameter of the hollow space to relative increase in length (Udelson et al. 2000):
| (6.3) |
where D is the diameter of the hollow space within the unstretched cylinder and L is the unstretched length. It is expected that N is a function of ν as well as the ratio of the outer to inner wall tube diameters (an argument was made (in the reference for equation (6.3)) that N>ν).
A series of stretching experiments were conducted to obtain an estimate of numerical values of N for non-biological as well as biological tubes. The non-biological tubes chosen were rubber vessels of varying diameters and wall thicknesses; the biological specimens were abdominal vena cava harvested from New Zealand white rabbits (see §9)>N, which remained essentially constant for each specimen tested, had a mean value of 0.33 (s.d. 0.09) for the non-biological tubes and 2.34 (s.d. 0.15) for the biological ones.
The volume rate of flow, Q, through a venule may be expressed by the fluid mechanical analogy of Ohm's law (Olson & Wright 1990),
| (6.4) |
where ΔP is the pressure drop along the length of the venule and R is the flow resistance, here assumed to be given by equation (6.1).15
The analysis resulted in the following expression for the volume rate of flow, Q, through a stretched venule (Udelson et al. 2000):
| (6.5) |
where Ru is the resistance of the unstretched venule.16
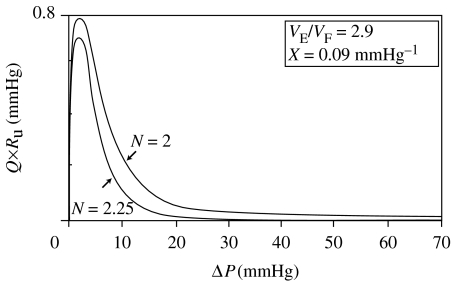
Figure 18 presents plots of equation (6.5) for the product of volume flow rate, Q, and the unstretched venule resistance, Ru, using the average human distensibility and expandability given by table 1. Two curves, for N=2.00 and N=2.25 (both conservatively less than the measured average of 2.34 for the rabbit vena cava), are shown. The predicted flow rate initially increases and then decreases with increasing ICP. The explanation is that pressure is the dominant driving force at lower pressures, just above the flaccid values. (Although inner diameter is narrowing with initial stretching, the increase in pressure overwhelms the increase of resistance due to the narrowing.) Subsequently, however, after peaking the volume, the rate of flow decreases at higher pressures, when the increase in resistance due to lumen narrowing becomes greater than the increase in pressure.
Figure 18.
Theoretical Q×Ru versus ΔP for luminal constrictibilities N=2 and N=2.25, assuming mean expandability, X, and distensibility, VE/VF. The higher the value of N, the more effective is the stretch-associated flow resistance.
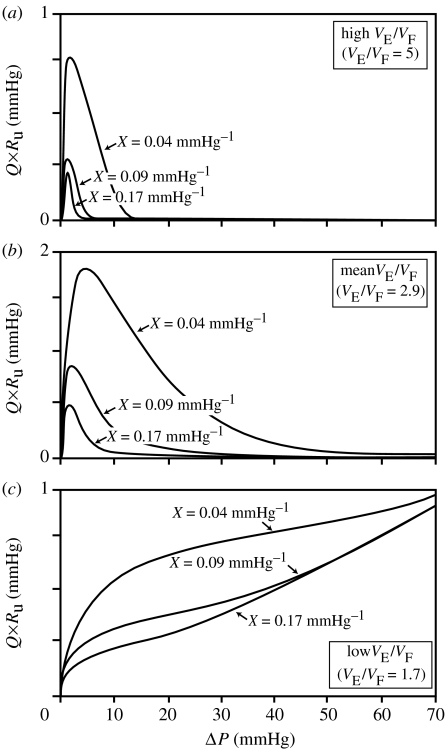
Assuming N=2, figure 19 shows plots of Q×Ru versus ΔP (equation (6.5)) for the high, average and low values of distensibility (VE/VF) and expandability (X) given in table 1. It appears that the stretch and compressive mechanisms of corporal veno-occlusion may be complementary. For high distensibility, stretch is theoretically most effective while compression is logically least effective. If only compressive forces were involved in veno-occlusion physiology, a highly distensible tunica would be expected to be associated with poor veno-occlusive function as a highly compliant wall would pose an ineffective backdrop for compression. Using stretch-associated forces, the more distensible the tunica, the greater the length changes of the subtunical venule and the narrower is its lumen resulting in higher outflow resistance. However, for low distensibility, the opposite appears to be true; the stretch mechanism is theoretically least effective, while the compressive mechanism is logically most effective (Udelson et al. 2000).
Figure 19.
Theoretical Q×Ru versus ΔP for luminal constrictibility N=2 for (a) high, (b) mean and (c) low values of distensibility, VE/VF, at high, mean and low values of expandability, X.
7. Penis–clitoris analogies
Certain studies of male ED have implications for the female clitoris (Tarcan et al. 1999; Vlachiotis et al. 2004). The clitoris, like the penis, is a cylindrical erectile organ which has a glans (or head), a body and two crura. As in the penis, there are two corpora cavernosa (with length approx. 2.5 cm) but no corpus spongiosum. The corpora cavernosa are also enclosed in a fibrous tunica albuginea. Pelvic nerve stimulation results in clitoral smooth muscle relaxation with increased arterial blood inflow resulting in venous occlusion, a rise in ICP and clitoral tumescence (Goldstein & Berman 1998). As in penile erection, nitric oxide (NO) is considered to be critical in clitoral smooth muscle relaxation leading to increased arterial inflow and clitoral engorgement (Zavara et al. 1995).
8. Proposed automated DICC procedure
The DICC procedure, discussed earlier (§3), which was used in male patient studies, required measurement of penile length and diameter. These were done manually at each 10 mmHg increase in ICP using a flexible ruler, when bringing the penis from the flaccid to erect state by infusion of saline. This procedure is not only time consuming but also leads to errors in approximately 20% of the cases when calculating expandability, X (as demonstrated in figure 9).
X is determined by the least squares method of fitting the V/VF versus ΔP clinical measurements to the theoretical equation (2.3). Since this calculation is very sensitive to data obtained at low values of ΔP when volume is increasing most rapidly, the clear need to make more frequent measurements at smaller increments of ΔP led to the suggestion that it is done continuously and automatically.
A study was conducted to determine whether penile volume could be obtained automatically using a circular strain gauge17 affixed to the penis (like a rubber elastic band) to measure the penile circumference at mid-shaft (thereby giving diameter). Since penile length is more complicated to measure automatically, its value would instead be imputed from the circumferential strain gauge data based on the general assumption of equal penile linear expansion, L/LF, in all directions (§2). The process would require manual measurement of penile length in the flaccid state before beginning the DICC. The automatic procedure was appraised to give acceptable and reliable results (R. Terry 2000, unpublished data), and a commercially available strain gauge has been successfully tested on patients (D. Udelson 2004, unpublished data).
Other ways of determining geometrical dimensions include ultrasound and MRI technologies. The former is now routinely used for penile studies (Gefen et al. 2006). Whatever automatic method of penile measurement is used, one can envision future DICC procedures being done with the geometrical data being measured automatically and fed continuously into a computer along with ICP (which is now already recorded automatically). A simple computer program could then produce and display a value of expandability, X. Better still, a graph, similar to those in the second column of figure 7, could be generated instantly which would show each patient's buckling resistance capabilities as a function of ICP, taking geometry as well as erectile tissue characteristics (X) into account. The clinician would then be able to make an assessment at a glance of the patient's potential erectile function capability, with much the same ease that one now reads an electrocardiogram.
9. Institutional approval of animal testing
The Institutional Review Board of the Boston University Medical School approved the experiments involving rabbits reported in the articles by Nehra et al. (1998) and Udelson et al. (2000).
Appendix A.
The comments regarding dating and DICC matching services were not meant to be taken in a totally serious vein. They were intended to dramatize, in somewhat facetious manner, the point made earlier that a male may have organic (i.e. non-psychogenic) ED with some, but not all, partners. The hope was to provoke other researchers into thinking seriously about whether there may be a need for predetermining sexual compatibility and, if so, what those methodologies should be (refer the last paragraph of §4).
Appendix B. Definitions
Aspect ratio, D/L. Diameter to length ratio of the pendulous penis. (Owing to the assumption that linear expansion is the same in all directions, the penile aspect ratio is taken to be the same at all ICPs for a given patient.)
Buckling. The curving of an otherwise straight column leading to deformation when subjected to a sufficiently large axial compressive load.
Bulk modulus (stiffness) β. Rate of pressure change (−dP) to relative change in volume (dV/V) varies with change in pressure (β for the corpora cavernosa is a measure of the difficulty of erectile tissue to expand with increasing ICP).
Corpora cavernosa (n) (plural). The two expansion chambers of the penis containing the erectile tissue (often simply referred to as the corpora); corpus cavernosum (n) (singular); corporal or cavernosal (adjective; used interchangeably).
Distensibility, VE/VF. Relative volume of the fully erect to completely flaccid pendulous penis (assumed to be equal to the ratio of erect to flaccid corporal volumes).
Expandability, X. Defined as the negative reciprocal of the cavernosal bulk modulus in the semi-erect state, i.e. X=−1/βSE. (A measure of the overall ability of the corpora cavernosa to expand to maximum volume at relatively low ICP. Higher values of X imply less work energy to achieve full erection. It is believed to reflect the percentage of erectile tissue which is not fibrotic.)
Intracavernosal pressure, ICP. Pressure exerted by blood in the corpora cavernosa.
Intracavernosal pressure increase, ΔP. The rise in cavernosal pressure above the flaccid pressure. (Flaccid pressure is assumed to be equal to the central venous pressure.)
Isotropic (adjective). Having a physical property which has the same value in all directions.
Lacunar spaces. Microscopic spaces of the cavernosal erectile tissue where blood is stored during erection.
Luminal constrictability, N. The relative decrease in diameter of the hollow space in a tube divided by the relative increase in the tube length due to stretching (see equation (6.3)).
Neutral axis. The line on a sectional area of a solid which, as a result of bending, divides elements of the area that are compressed from those that are stretched. (At the neutral axis, the strains are zero.)
Newtonian fluid. A fluid for which the shear stress is directly proportional to the rate of shear strain. (If F is the friction, or shear force at a wall, shear stress τ=F/A=μ×du/dy, where μ is the constant of proportionality, defined as the dynamic viscosity, and du/dy is the velocity gradient normal to the wall.)
Pendulous penis. The portion of the penis outside of the body.
Penile buckling force, FBUC. The magnitude of an axial compressive load which results in penile buckling.
Per cent smooth muscle, PSM. The fraction of erectile tissue which is not fibrotic. (It is the relaxation of smooth muscle during the erection process which permits blood to fill the (so-called) ‘lacunar’ spaces, thereby causing expansion.)
Poisson's ratio, ν. The relative decrease in linear dimensions of a material when it is stretched in an orthogonal direction, divided by the relative increase in length in the stretched direction (see equation (6.2)).
Second moment of area about an axis, I. , y being the perpendicular distance of the element of area dA from the axis. (The area and axis lie in the same plane.)
Semi-erect state, SE. Defined as the condition when the cavernosal volume is one-half the erect volume.
Strain, normal (due to a force acting perpendicular to an area), ΔL/L. Relative change in length due to tensile or compressive forces.
Strain gauge. An elastic material whose electrical resistance, R, changes when it is stretched, enabling length to be obtained by the measurement of R.
Stress, F/A. Ratio of force divided by the area over which it acts. The force can act at any angle with respect to the area (pressure is strain due to a normal force).
Tunica albuginea. The fibrous tissue that surrounds each of the two corpora cavernosa.
Veno-occlusion. Corporal (or cavernosal) veno-occlusion is the process of shutting off the flow of blood out of the corpora cavernosa resulting from occlusion of the exit venules (small veins).
Young's modulus of elasticity, E. The ratio of normal stress over strain (see equation (5.1); the stress can be due to compressive or tensile forces).
Footnotes
Cases of the latter type are usually considered to fall in the domain of civil engineering, with those of the former type generally belonging to the fields of mechanical or aerospace engineering. (Bio- or biomedical engineering is a hybrid discipline which can study mechanical, electrical or chemical phenomena.)
The specific gravity of Hg is 13.55.
In 1992, experiments using water-filled cylinders of different sizes were reported to ‘demonstrate that erection is not dependent only on ICP’ (Puech-Leao et al. 1992).
Figure 5 is basically an inverted thermodynamic pressure–volume diagram.
Values of these parameters for the second study (1999) were not significantly different from the first (1998).
P=absolute ICP−flaccid ICP. The average flaccid ICP is approximately 10 mmHg.
The same rabbits were being used in a bladder disease study which required these procedures to be performed. (See §9: ‘Institutional approval of animal testing’.)
The latter method of measuring volume is not feasible during a human DICC procedure, since the volume increase there is due to both saline infusion and the natural inflow of blood through the cavernosal arteries, which would be difficult to measure.
In comparing the human data in table 1 with the rabbit data in table 3, it is significant to note that, although rabbit penile sizes are considerably smaller than those of humans, the range of their distensibilities, a geometrical dimensionless ratio, is similar. (It is also interesting that the distensibility mean of 2.89 for the 21 humans is virtually the same as the mean of 2.82 for the 20 rabbits; however, the nearly perfect agreement is accidental since the rabbit samples were not randomly chosen.)
A different curve based on a rudimentary two-dimensional model (result only) had been presented in a previous publication (Nehra et al. 1998).
Larger Young's modulus implies less elasticity. (Hooke's law, equation (5.1) shows that the larger the value of E, the larger the force must be for the rod to stretch a given relative distance, Δl/l.)
Megapascal (MPa)=106 N m−2.
See appendix B for definition.
Blood, although non-Newtonian, has been shown to behave like a Newtonian fluid at high shear rates associated with very small diameter blood vessels (Strandness & Sumner 1975). The assumption of laminar flow appears to be safe since the inside hollow subtunical venule diameter (D∼0.1 mm), combined with other factors, produces small Reynolds number, Re (Re is a dimensionless parameter which is a predictor of laminar (lower Re) versus turbulent (higher Re) flow).
Equation (6.1) assumes a circular lumen of the subtunical venule. This assumption might be compromised if, for example, compression of the venule is a significant concomitant mechanism contributing to occlusion. In that case, the resistance in equation (6.1) might be replaced with that for an elliptical cross-section (Udelson et al. 2000).
The flaccid state is approximated when ΔP→0 in equation (6.5), with the result Q→ΔP/Ru, as expected.
See appendix B for definition.
References
- Aboseif S, Wetterauer U, Breza J, Bernard F, Bosch R, Steif C, Lue T. The effect of venous incompetence and arterial insufficiency on erectile function. J. Urol. 1990;144:790. doi: 10.1016/s0022-5347(17)39593-9. [DOI] [PubMed] [Google Scholar]
- Andersson K.-E, Wagner G. Physiology of erection. Physiol. Rev. 1995;75:191. doi: 10.1152/physrev.1995.75.1.191. [DOI] [PubMed] [Google Scholar]
- Anderson P, Bloom S, Mellander S. Hemodynamics of pelvic nerve induced penile erection in the dog. J. Physiol. 1984;350:209. doi: 10.1113/jphysiol.1984.sp015197. [DOI] [PMC free article] [PubMed] [Google Scholar]
- Banya Y, Kurosawa T, Goto Y, Aoki H, Kubo T. Arrangement and shape of cavernous sinuses in the human corpus cavernosum penis in relation to the restriction mechanism of venous outflow. J. Clin. Electron Microsc. 1990;23:865–866. [Google Scholar]
- Beer, F. P. & Johnson, E. R. 1992 Mechanics of materials, vol. 635, pp. 78–79, 2nd edn. New York, NY: McGraw-Hill Publishers.
- Benson G, McConnell J, Lipschults L. Neuromorphology and neuropharmacology of the human penis. J. Clin. Invest. 1980;65:506. doi: 10.1172/JCI109694. [DOI] [PMC free article] [PubMed] [Google Scholar]
- Breza J, Aboseif S, Orvis B. Detailed anatomy of penile neurovascular structures: surgical significance. J. Urol. 1989;141:437. doi: 10.1016/s0022-5347(17)40789-0. [DOI] [PubMed] [Google Scholar]
- Carriere M, Serraino D, Palmiotto F, Nucci G, Sasso F. A case- control study on risk factors for Peyronnie's disease. J. Clin. Epidemiol. 1998;51:511–515. doi: 10.1016/S0895-4356(98)00015-8. [DOI] [PubMed] [Google Scholar]
- Chaudhoke P, Lue T. Mathematical model of penile hemodynamics. Int. J. Impot. Res. 1989;1:137. [Google Scholar]
- Conti G, Virag R. Human penile erection and organic impotence: Normal histology and histopathology. Urol. Int. 1989;44:303. doi: 10.1159/000281527. [DOI] [PubMed] [Google Scholar]
- Derogatis L, Laban M. Psychological assessment measures of human sexual functioning in clinical trials. Int. J. Impot. Res. 1998;10(Suppl. 2):S13–S20. [PubMed] [Google Scholar]
- Fournier G, Juenemann K, Lue T. Mechanism of venous occlusion during canine penile erection and anatomic demon- stration. J. Urol. 1987;137:163. doi: 10.1016/s0022-5347(17)43911-5. [DOI] [PubMed] [Google Scholar]
- Freidenberg D, Berger R, Chew D, Ireton R, Ansel J, Shwartz A. Quantitation of corporeal venous outflow Resistance in man by corporeal pressure flow evaluation. J. Urol. 1987;138:533–537. doi: 10.1016/s0022-5347(17)43251-4. [DOI] [PubMed] [Google Scholar]
- Frohrib D, Goldstein I, Payton T, Padma-Nathan H, Krane R. Characterization of penile erectile states using external computer-based monitoring. J.Biomech. Eng. 1987;109:110–111. doi: 10.1115/1.3138651. [DOI] [PubMed] [Google Scholar]
- Gefen A, Chen J, Elad D. Stresses in the normal and diabetic penis following implantation of an inflatable prostheses. Med. Biol. Eng. Comput. 1999;37:625–631. doi: 10.1007/BF02513358. [DOI] [PubMed] [Google Scholar]
- Gefen A, Chen J, Elad D. Computational tools in rehabilitation of erectile dysfunction. Med. Eng. Phys. 2001;23:69–82. doi: 10.1016/S1350-4533(01)00027-3. [DOI] [PubMed] [Google Scholar]
- Gefen A, Elad D, Chen J. Biomechanical aspects of Peyronie's disease in development stages and following reconstructive Surgeries. Int. J. Impot. Res. 2002;14:389–395. doi: 10.1038/sj.ijir.3900866. [DOI] [PubMed] [Google Scholar]
- Gefen A, Chen J, Elad D. State of knowledge in structural mechanics of penile erection, and some areas of ignorance. J. Biomech. 2006;39(Suppl. 1):S345. doi: 10.1016/S0021-9290(06)84368-X. [DOI] [Google Scholar]
- Goldstein, I. 1995 The potent male, pp.17,40,102. Regenesis Cycle Publishing.
- Goldstein I, Berman J. Vasculogenic female sexual dysfunction: vaginal engorgement and clitoral erectile insufficiency syndromes. Int. J. Impot. Res. 1998;10(Suppl. 2):S84–S90. [PubMed] [Google Scholar]
- Hakim L, Munarriz R, Kulaksizoglu H, Nehra A, Udelson D, Goldstein I. Vacuum erection associated impotence and Peyronie's disease. J. Urol. 1996;155:535. [PubMed] [Google Scholar]
- Hatzichristou D, Saenz de Tejada I, Kupferman S, Namburi S, Pescatori E, Udelson D, Goldstein I. In vivo assessment of trabecular smooth muscle tone, its application in pharmaco-cavernosometry and analysis of intracavernous pressure determinants. J. Urol. 1995;153:1126–1135. doi: 10.1016/S0022-5347(01)67530-X. [DOI] [PubMed] [Google Scholar]
- Karacan I, Moore C, Sahmay S. Measurement of pressure necessary for vaginal penetration. Sleep Res. 1985;14:269. [Google Scholar]
- Kelly D. Expansion of the tunica albuginea during penile inflation in the nine-banded armadillo. J. Exp. Biol. 1999;202:253–265. doi: 10.1242/jeb.202.3.253. [DOI] [PubMed] [Google Scholar]
- Kinsey A, Pomeroy W, Martin C. W. B. Saunders Publishers; Philadelphia, PA: 1948. Sexual behavior in the human male. [DOI] [PMC free article] [PubMed] [Google Scholar]
- Linder-Ganz E, Gefen A, Chen J, Elad D.A. A three-dimensional model of the penis for analysis of tissue stresses during erection. J. Biomech. 2006;39(Suppl. 1):S346. doi: 10.1016/S0021-9290(06)84372-1. [DOI] [PubMed] [Google Scholar]
- Lue T, Takamura T, Umraiya M, Schmidt R. Hemodynamics of canine corpora cavernosa during erection. Urology. 1984;24:347–352. doi: 10.1016/0090-4295(84)90208-5. [DOI] [PubMed] [Google Scholar]
- Lue T, Tanagho E. Physiology of erection and pharmacologic management of impotence. J. Urol. 1987;137:829. doi: 10.1016/s0022-5347(17)44267-4. [DOI] [PubMed] [Google Scholar]
- Luo, H., Goldstein, I. & Udelson, D. In press. A three dimensional theoretical model of the relationship between cavernosal expandability and percent cavernosal smooth muscle. J. Sex. Med. [DOI] [PubMed]
- Malovrouvas D, Petraki C, Constantinidis E, Petraki K, Antoniadis G, Constantinidis C, Kranidis A. The contribution of cavernous body biopsy in the diagnosis and treatment of male impotence. Histol. Histopathol. 1994;9:427–431. [PubMed] [Google Scholar]
- Nehra A, Goldstein I, Nugent M, Huang Y, de las Morenas A, Krane R, Udelson D, de Tejada I, Moreland R. Mechanisms of venous leakage: a prospective clinicopathologic correlation of corporal structure and function. J. Urol. 1996;156:1320–1329. doi: 10.1016/S0022-5347(01)65578-2. [DOI] [PubMed] [Google Scholar]
- Nehra A, Azadzoi K, Moreland R, Pabby A, Siroky M, Krane R, Goldstein I, Udelson D. Cavernosal expandability is an erectile tissue mechanical property which predicts trabecular histology in an animal model of vasculogenic erectile dysfunction. J. Urol. 1998;159:2229–2236. doi: 10.1016/S0022-5347(01)63311-1. [DOI] [PubMed] [Google Scholar]
- NIH consensus development panel on impotence. J. Am. Med. Assoc. 1993;270:83–90. doi: 10.1001/jama.270.1.83. [DOI] [PubMed] [Google Scholar]
- Olson R, Wright S. 5th edn. Harper and Row; New York, NY: 1990. Essentials of engineering fluid mechanics. [Google Scholar]
- Padma-Nathan H. Professional Communications Publishers; New York, NY: 1999. Medical management of erectile dysfunction: a primary care manual. [Google Scholar]
- Persson C, Diederichs W, Lue T, Benedict Yen T, Fishman I, McLin P, Tanagho A. Correlation of altered penile ultrastructure with clinical arterial evaluation. J. Urol. 1989;142:1462–1468. doi: 10.1016/s0022-5347(17)39127-9. [DOI] [PubMed] [Google Scholar]
- Puech-Leao P, Akira S, Chao S. Penile architecture and intra-cavernosal pressure: a simulation. Int. J. Impot. Res. 1992;4(Suppl. 2):43. [Google Scholar]
- Potter & Goldberg, 1987 Mathematical methods, pp. 266–268. Englewood Cliffs, NJ: Prentice-Hall.
- Saenz de Tejada I, Angulo J, Cellek S, Gonzalez-Cadavio N, Heaton J, Pickard R, Simonsen U. Physiology of erectile Function. J. Sex. Med. 2004;1:254–265. doi: 10.1111/j.1743-6109.04038.x. [DOI] [PubMed] [Google Scholar]
- Strandness D, Sumner D. Hemodynamics for surgeons. vol. 81. Greene and Stratton Publishers; New York, NY: 1975. [Google Scholar]
- Tarcan T, Azadzoi K, Siroky M, Goldstein I, Krane R. Age-related erectile and voiding dysfunction: the role of arterial insufficiency. Br. J. Urol. 1998;82(Suppl. 1):26–33. doi: 10.1046/j.1464-410x.1998.0820s1026.x. [DOI] [PubMed] [Google Scholar]
- Tarcan T, Park K, Goldstein I, Maio G, Fassina A, Krane R, Azadzoi K. Histomorhometric analysis of age-related structural changes in human clitoral cavernosal tissue. J. Urol. 1999;161:940–944. doi: 10.1016/S0022-5347(01)61825-1. [DOI] [PubMed] [Google Scholar]
- Udelson D, Nehra A, Hatzichristou D, Azadzoi K, Moreland R, Krane R, Saenz de Tejada I, Goldstein I. Engineering analysis of penile hemodynamic and structural–dynamic relationships: part I—clinical implications of penile tissue mechanical properties. Int. J. Impot. Res. 1998a;10:15–24. doi: 10.1038/sj.ijir.3900310. [DOI] [PubMed] [Google Scholar]
- Udelson D, Nehra A, Hatzichristou D, Azadzoi K, Moreland R, Krane R, Saenz de Tejada I, Goldstein I. Engineering analysis of penile hemodynamic and structural–dynamic relationships: part II—clinical implications of penile buckling. Int. J. Impot. Res. 1998b;10:25–35. doi: 10.1038/sj.ijir.3900311. [DOI] [PubMed] [Google Scholar]
- Udelson D, Nehra A, Hatzichristou D, Azadzoi K, Moreland R, Krane R, Saenz de Tejada I, Goldstein I. engineering analysis of penile hemodynamic and structural–dynamic relationships: part III—clinical considerations of penile hemodynamic and rigidity erectile responses. Int. J. Impot. Res. 1998c;10:89–90. doi: 10.1038/sj.ijir.3900312. [DOI] [PubMed] [Google Scholar]
- Udelson D, Park K, Sadeghi-Najed H, Salimpour P, Krane R, Goldstein I. Axial penile buckling forces vs. Rigiscan™ radial rigidity as a function of intracavernosal pressure: why Rigiscan does not predict functional erections in individual Patients. Int. J. Impot. Res. 1999;11:327–339. doi: 10.1038/sj.ijir.3900443. [DOI] [PubMed] [Google Scholar]
- Udelson D, L'Esperance J, Morales A, Patel R, Goldstein I. The mechanics of corporal veno-occlusion in penile erection: a theory on the effect of stretch-associated luminal constrictability on outflow resistance. Int. J. Impot. Res. 2000;12:315–327. doi: 10.1038/sj.ijir.3900628. [DOI] [PubMed] [Google Scholar]
- Vlachiotis J, Petsis D, Grigorakis A, Tsimpoujkis G, Perlepes G, Tsintavis A. Female sexual dysfunction after radical cystectomy. J. Sex. Med. 2004;2(Suppl. 1):11. [Google Scholar]
- Wespes E, Schulman C. Parameters of erection. Br. J. Urol. 1984;56:416–417. doi: 10.1111/j.1464-410x.1984.tb05834.x. [DOI] [PubMed] [Google Scholar]
- Wespes E, Goes P, Schiffmann S, Depierreux M, Vanderhaeghen J, Schulman C. Computerized analysis of smooth muscle fibers in potent and impotent patients. J. Urol. 1991;146:1015–1017. doi: 10.1016/s0022-5347(17)37990-9. [DOI] [PubMed] [Google Scholar]
- Zavara P, Sioufi R, Schipper H, Begin L, Brock G. Nitric oxide mediated erectile activity is a testosterone dependent event: a rat erection model. Int. J. Impot. Res. 1995;7:209–219. [PubMed] [Google Scholar]
- Zippe C, Kedia A, Kedia K, Nelson D, Agerwal A. Treatment of erectile dysfunction after radical prostatetectomy with syldenafil citrate. J. Urol. 1999;161 doi: 10.1016/s0090-4295(98)00443-9. [DOI] [PubMed] [Google Scholar]


