

Abstract
Percutaneous revascularization of peripheral artery chronic total occlusion (CTO) is challenging under X-ray guidance without direct image feedback, due to poor visualization of the obstructed segment and underappreciation of vessel tortuosity. Operators are required to steer interventional devices relatively “blindly,” and therefore procedural failure or perforation may occur. Alternatively, MRI may allow complete visualization of both patent and occluded arterial segments. We designed and implemented a 3D high-resolution, T1-weighted (T1-W) turbo spin-echo (TSE) MRI sequence with inner-volume (IV) imaging to enable detailed peripheral artery CTO imaging. Using this sequence, high-resolution volumes of interest (VOIs) around the vessel were achieved within 5-10 min. This imaging approach may be used for rapid pre- and postprocedural evaluations, and as a 3D roadmap that can be overlaid during real-time X-, MR-, or XMR-guided catheterization. Experiments were successfully performed on a carotid CTO model in swine ex vivo, and in peripheral arteries in normal volunteers and patients in vivo. Delineation of the vascular architecture, including contrast differences between the patent and occluded artery segments, and lesion morphology heterogeneity were visualized.
Keywords: atherosclerosis, turbo spin-echo, plaque, magnetic resonance imaging, peripheral vascular disease, angiography, interventional
Atherosclerotic peripheral artery disease (PAD) is a widely prevalent disorder that affects millions world-wide and is associated with significant morbidity and mortality (1,2). Patients with lower-extremity PAD may suffer intermittent claudication or critical limb ischemia due to stenotic or occlusive arterial plaques. Minimally invasive X-ray-guided, catheter-based revascularization procedures, such as percutaneous intravascular angioplasty and stent implantation, can relieve arterial obstruction and improve muscle perfusion in selected patients (3,4). A detailed understanding of the geometry of the patent, stenotic, and occluded arterial segments is crucial to ensure procedural success and freedom from complications such as vascular perforation. Here we present a high-resolution 3D magnetic resonance imaging (MRI) method that provides detailed visualization of the entire artery in a range of anatomic and atherosclerotic configurations within 5-10 min.
Traditional arteriography (radiocontrast X-ray, contrast-enhanced (CE)-MRA, and time-of-flight (TOF)-MRA) requires luminal patency and blood flow. In patients with chronic total occlusions (CTOs), the absence of a lumen to hold the contrast agents makes these vessels completely invisible from the point of total occlusion to the point where the collateral-mediated circulation begins to feed the vessel. Figure 1 shows an example of an X-ray angiogram in a patient with a peripheral CTO. Note the missing segment (nearly 6 cm long) in the left common iliac artery at its origin at the aortic bifurcation. The absence of image guidance, which typically is coupled with long lesion lengths, increased vessel tortuosity, and vessel shrinkage due to negative remodeling, can make it challenging to maneuver through the occluded vessels without rupturing or dissecting the vessel walls. A minority of the atherosclerotic occlusions have sufficient diffuse calcification to allow X-ray visualization in at least part of the occluded vascular trajectory. In the absence of such clues, clinicians need other techniques to plan a recanalization trajectory. In this study we present a high-resolution 3D MRI technique with contrast properties that enable differentiation between the arterial walls, adjacent structures, intraluminal blood, and the CTO lesion, thus providing good visualization of the vascular borders, vessel tortuosity, and the location and length of the lesion within the lumen.
FIG. 1.
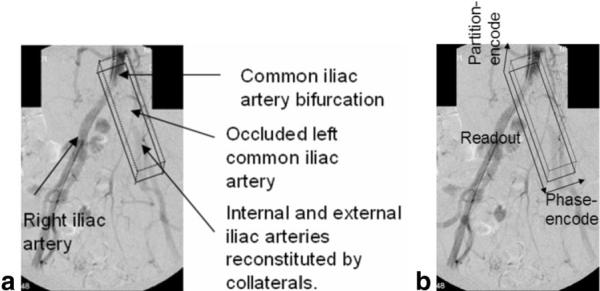
a: X-ray angiogram of a patient with a totally occluded left common iliac artery at its origin at the aortic bifurcation. The black box overlaid on the image indicates the orientation of the IV. b: The readout, phase-encode, and partition directions are indicated by arrows.
The implementation of MRI for high-resolution imaging of arterial vessel walls and plaque is becoming well established. TSE imaging has been validated as an excellent method for imaging plaque morphology and composition (5-8), and plaque function (9-13). In this paper we show that inner-volume (IV) selection (14,15) can be added to a T1-weighted (T1-W) 3D high-resolution turbo spin-echo (TSE) pulse sequence to reduce scan times nearly eightfold while maintaining the excellent TSE contrast between the constituent tissues in the plaque and without compromising image resolution. The pulse sequence was successfully tested on phantoms, ex vivo carotid artery specimens of a pig with an induced CTO model through balloon injury, peripheral patent vessels in normal volunteers (N = 3), and patients with existing CTOs (N = 5). The results demonstrate good distinction between patent, stenotic, and occluded vessel segments, and high-resolution visualization of plaque heterogeneity in CTO segments.
Materials and Methods
Pulse Sequence
All experiments were performed on a 1.5T Siemens Sonata scanner (Siemens Medical Systems, Erlangen, Germany) equipped with gradient coils capable of imaging at 40 mT/m with maximum slew rates of 200 mT/m-ms. The IV imaging scheme (14,15) was incorporated into a commercially available 3D TSE pulse sequence. For each TR, a slice-selective 90° excitation pulse was first used to excite the spins within a user-defined slab along the partition-encode (z) direction. This was then followed by a series of 180° refocusing pulses designed to be slice-selective along the phase-encode (y) direction, refocusing only those spins that lay within the “IV” of the intersection of the two orthogonally selected slabs. With the use of the IV technique, the phase-encode FOV is decreased, the k-space sampling step size is increased in the phase-encode direction, and the relative number of samples required to achieve the high resolution is subsequently reduced. The pulse sequence diagram is illustrated in Fig. 2. For convenience, we use the term IV-TSE to refer this pulse sequence.
FIG. 2.
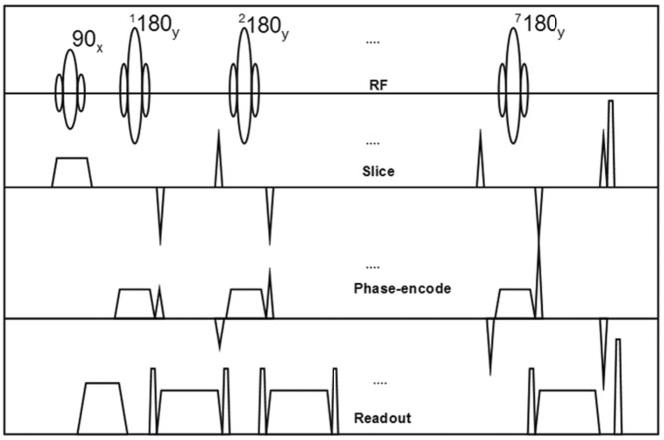
Pulse sequence diagram depicting the IV-TSE sequence.
The bandwidth and slice-selection gradient amplitudes for the excitation and refocusing pulses were made identical to obtain an IV in the shape of a square prism. The square prism was oriented with the long axis in the readout direction along the length of the vessel (see black box in Fig. 1b) to minimize the scan times and accentuate black-blood suppression of the fast-moving blood spins by orienting the large readout gradients along the major axis of the flow.
Sinc-shaped excitation and refocusing pulses with two side lobes and a bandwidth of 390 Hz were used to provide a good compromise between acceptable slice profiles and low RF energy deposition rates. The slice profile obtained in a uniform cross-sectional slice of a phantom (see white line in Fig. 3a) is depicted in Fig. 3b. The prescribed slice thickness was 24 mm (see black solid vertical lines in Fig. 3b). From this figure it is evident that the two transitional drop-off regions in the slice profile account for an additional 50% of the total slab thickness. To compensate for these regions and prevent foldover artifacts, the FOV in the phase- and partition-encode directions was set to be equal to 150% of the user-prescribed slab thickness (see black dot-dashed vertical lines in Fig. 3b).
FIG. 3.
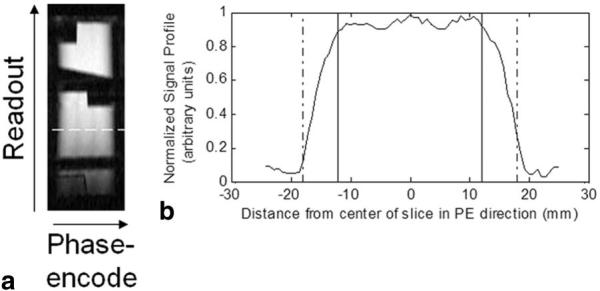
a: Phantom image acquired using the IV-TSE sequence. b: Slice profile along the phase-encoding direction for the cross-sectional slice indicated by the dashed white line in a. The prescribed slab thickness was 24 mm (see solid vertical lines in b). The actual FOV acquired was 36 mm (see dot-dashed vertical lines in b).
The k-space was sampled in a Cartesian grid with the partition- and phase-encode directions programmed as the “outer” and “inner” loops, respectively. The inner loop was acquired using an interleaved center-out phase-encode trajectory, and the outer loop was acquired using a bottom-up trajectory. Using this scheme, the phase-encode gradient was modified from one refocusing echo to the next, while the partition-encode gradient was incremented every N/TF Carr Purcell Meiboom Gill (CPMG) train, where N is the number of phase-encode lines and TF is the turbo factor.
The center of k-space was sampled at the user-selected echo time (TE). Seven echoes (i.e., TF = 7) were sampled each TR to achieve a good compromise between scan-time reductions and minimal T2 blurring of thin features perpendicular to the phase-encode direction (16). To obtain T1-W contrast, the signal at the center of k-space was sampled during the first or second echo, and adjacent segments in k-space were sampled during the adjacent echoes. The short TRs characteristic of a T1-W sequence resulted in clinically acceptable scan times of typically 5-7 min for a single average. The typical contrast parameters used were TE = 8-17 ms, TR = 300 ms (ex vivo study), 500 ms (ungated in vivo studies), and 1 R-R interval (all other in vivo studies). No gating was used for the ex vivo study. Nongated scans were performed in two in vivo studies (one normal volunteer and one patient) in order to achieve lower scan times. However, mild edge blurring motivated the use of gating for the remainder of the in vivo experiments. The longer TR in the gated scans also improved the SNR in the resultant images with no substantial tissue contrast changes.
To suppress residual FID signals from saturated spins outside the IV or from spins that were not completely inverted due to local B1 inhomogeneities, we used free induction decay (FID) suppression gradients on either side of the read gradients, and restricted our shimming volume to a region tightly defined around the IV. To further ensure equal phase on any residual signal contributions from stimulated echoes and prevent any stimulated echo-related artifacts, the phase- and partition-encode gradients were rewound before each refocusing pulse.
Experiments
Ex Vivo Study
An ex vivo imaging study was performed on necropsy specimens from a pig, followed by histopathological comparison to determine whether the contrast obtained at high resolution was adequate to image the vascular architecture and capture the heterogeneity in the plaque composition. The animal protocols were approved by the National Heart, Lung and Blood Institute Animal Care and Use Committee, and conducted in a swine model under inhalation anesthesia and mechanical ventilation. CTO was induced by balloon injury in the left carotid artery of the swine (atherogenic diet-fed swine model described in Ref. 17). The occlusion in the left carotid artery extended from the point of bifurcation to roughly 7 cm distally. Necropsy specimens of the brachiocephalic artery and bilateral carotid arteries were obtained 6-8 weeks after the CTO was induced. The arteries were suspended in a plastic bottle filled with perfluoropolyether Fomblin oil (Fomblin PFPE, Solvay Solexis, Inc.). The low dielectric effect and low MR signal of Fomblin oil eliminated any susceptibility artifacts at the tissue boundaries and provided good tissue-background signal contrast.
An IV (192 mm × 60 mm × 60 mm) was prescribed from scout scans to ensure that the IV encompassed the arterial specimen, after which the IV-TSE scan was executed. The key imaging parameters used were TE/TR = 9 ms/300 ms, read FOV = 192 mm, resolution = 0.5 mm × 0.5 mm × 0.5 mm, slab thickness = 30 mm, averages = 2, scan time = 1004 s, and a head coil. The images were zero-padded in the Fourier domain and reconstructed to obtain an in-plane resolution of 125 μm × 125 μm. The data were then postprocessed using custom-designed MATLAB software tools developed with a convenient graphical user interface to display the volumes and cross-sectional slices in any of the three orientations.
After imaging was completed, the sample was fixed in formalin and sent to a histology laboratory (Histoserv Inc., Germantown, MD, USA) for section-staining procedures to classify lesion composition on axial slices. The specimen was embedded in paraffin, and from one end of the vessel a pair of contiguous axial sections (4 μm thick) were sliced every 3 mm throughout the length of the specimen. A total of 40 pairs of paraffin-embedded axial sections were obtained, and each was dyed by Verhoeff-vanGieson (VVG) and Masson’s Trichrome (MT) stains, respectively, to detect collagen, elastin, and thrombus. The stained sections were subsequently mounted on slides, which were imaged under a stereomicroscope (Leica MZ FLIII) using a 4× magnification setting, and digitally photographed using a Nikon DXM-1200 digital camera mounted on the trinocular port of the microscope at an in-plane resolution of 13.5 μm ×13.5 μm.
For each of the 40 axial pairs of stained photographs, we first located the closest corresponding axial MR image by matching the distance from the end of the vessel. Next, the histological photographs were scaled to approximately match the size of the MR images, and visual landmarks were used to rotate these photographs to match the orientation on the MR images. Finally, we visually compared the MR images with the two stained photographs at each of the 40 locations to evaluate the resolution and contrast properties of the IV-TSE sequence.
In Vivo Studies
In vivo studies were performed on three normal volunteers and five patients with known PAD. The normal volunteer studies were conducted to evaluate the quality of the in vivo volume selection using the IV-TSE sequence, and to assess the in vivo contrast properties and the black-blood suppression achieved in patent arteries. Patients with pre-existing lower-extremity CTOs were imaged to 1) assess the ability of the sequence to differentiate between patent and occluded portions of the artery and evaluate plaque heterogeneity in vivo, and 2) to differentiate between the plaque and the vessel wall in the totally occluded segments. All in vivo studies were approved by the Institutional Review Board of the National Health, Lung and Blood Institute, and informed consent was obtained from all subjects.
The patient underwent CE MR angiography (MRA), 3D TOF-MRA, and a 2D high-resolution TSE sequence, and a sparse set of four to five slices oriented axially to the vessel of interest was obtained. CE-MRA was performed a few days before the IV-TSE examination. These sets of images were utilized to prescribe the IV for the IV-TSE scan. The key imaging parameters used during the studies were as follows: TF = 7, TE = 8-17 ms, TR = 500 ms (if not gated) and 1 R-R (if gated), read FOV = 200-250 mm, isotropic resolution = 0.7-0.8 mm3, slab thickness = 20-30 mm, averages = 1-2, and scan time = ∼350 (one average) to 600 (two averages) s. A body coil (iliac arteries) and peripheral leg coil (femoral and popliteal arteries) were used. For two patient in vivo iliac artery imaging studies, two averages were used to improve the SNR of the images due to the distance of the coil from the arteries. This still provided a fourfold speed-up in acquisition times com pared to a full-FOV acquisition using a standard TSE pulse sequence. The images were inspected online on the host computer, and the raw data were transferred to a local workstation for postprocessing using custom-developed MATLAB image analysis software tools.
Specifically, software tools were developed in MATLAB to generate 1) user-specified simultaneous multiplanar views, 2) curved slice reconstructions, and 3) circular grid-based surface reconstructions of the vessel wall from user-defined vessel wall boundaries on axial slices.
Results
Ex Vivo Study
The IV-TSE sequence successfully defined the vascular borders and imaged the spatial and compositional heterogeneity of the lesions. A reconstructed sagittal slice from the imaged volume is displayed in Fig. 4a. The heterogeneity in the plaque composition in the left carotid artery is evident from the grayscale variations observed in this image. Three representative axial slices at locations marked by blue lines in Fig. 4a are compared with the histology-stained photographs in Fig. 4b. The three slices were selected at locations just before, at, and just after the carotid artery bifurcation point, respectively. For each axial slice the IV-TSE images are displayed in the first column, the VVG-stained sections are displayed in the second column, and the MT-stained sections are shown in the third column in Fig. 4b.
FIG. 4.
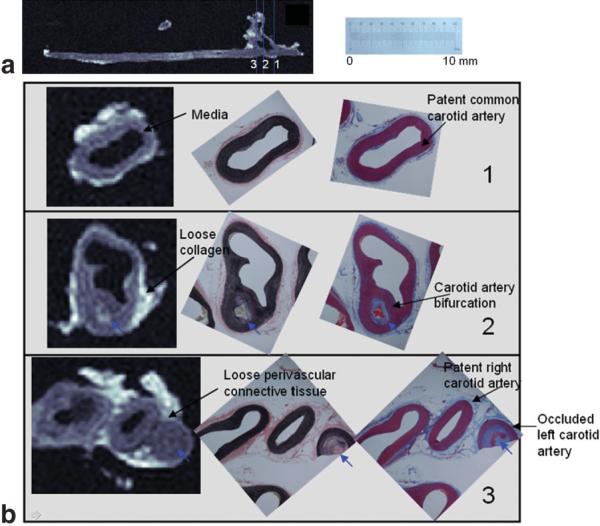
a: Sagittal slice of the chronically occluded carotid artery from a porcine model. b: Comparison of the IV-MR images with histology-stained images (VVG and MT) in three representative axial slices pre-bifurcation, at the bifurcation, and just post-bifurcation. The positions of these slices are indicated by blue lines in a. The scale corresponds to the histology-stained photographs. Note the common carotid bifurcating into the patent right carotid artery and the occluded left carotid artery in b-3. Note also the whitish appearance of the loose collagenous matrix (b-2), the light grayish appearance of the collagenous adventitia (b-3), and the dark gray appearance of the media (b-1). Plaque features are reproduced in the IV-TSE images (small blue arrows).
The shape and structure of the arterial slices appeared similar to the histology-stained images on visual inspection, with consistent tissue contrast. For example, the thick vessel wall media appears dark gray in the IV-TSE images, dark purple on MT images, and dark brown on VVG images (Fig. 4b-1), while loose collagenous material appears nearly white on the IV-TSE images, light blue on MT, and light pink on VVG (Fig. 4b-2). Circularly arranged loose perivascular connective tissue appeared lighter gray-isotonic gray in the IV-TSE images, light blue in MT images, and pink in VVG images (Fig. 4b-3).
The intraluminal lesions had variable image intensity characteristics related to their compositional and structural variations (blue arrows in Fig. 4b). Structural variations, such as the bifurcation of the common carotid artery into the occluded left carotid artery and the patent right carotid artery, can be observed in Fig. 4b-2,3. Compositional variations (indicated by the blue arrows in Fig. 4b-2) can also be differentiated by the image contrast.
Six representative axial slices at different locations in the left occluded carotid artery indicated by the blue lines in Fig. 5a are compared with histology photographs in Fig. 5b. Compositional variations consistent with calcification (blue arrows on Fig. 5b-1,2) appear dark gray to black on the IV-TSE images. The intimal hyperplasia shown in Fig. 5b-4,5 reveals a collagen-infiltrated media (pinkish brown and bluish purple) with a dense collagen-filled lumen. The corresponding IV-TSE images show an isotonic gray vessel wall and lumen with little visible demarcation between the two. Structural variations, such as medial rupture, were also reproduced within the resolution limitations of the sequence (blue arrow in Fig. 5b-3).
FIG. 5.
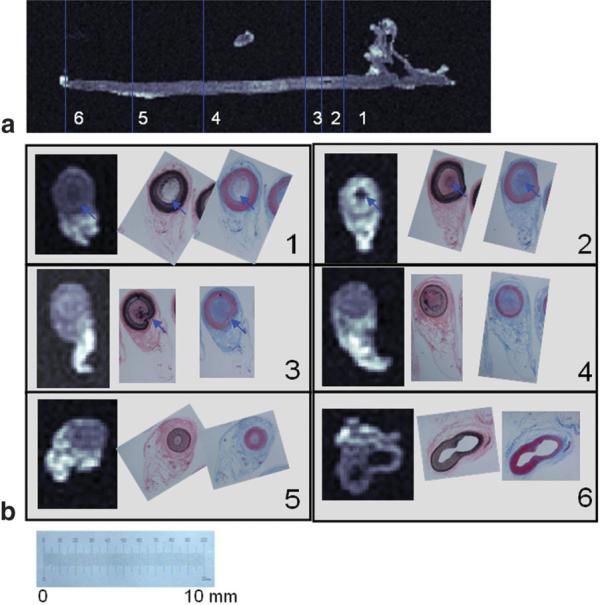
a: Sagittal slice of the occluded left carotid artery. b: Comparison of the IV-MR images with histology-stained images (VVG and MT) in six representative axial slices throughout the length of a chronically occluded carotid artery from a porcine model. The positions of these slices are indicated by blue lines in a. The scale corresponds to the histology-stained photographs. Note the dark gray to black appearance of plaque calcification (blue arrows in b-1,2). Medial rupture is also reproduced within the resolution limitations of the sequence (blue arrows in b-3).
The ex vivo study demonstrates a good correlation between the IV-TSE images and histology-stained sections, and confirms that the image contrast obtained is sufficient to image the vascular architecture and capture the intravascular plaque heterogeneity.
In Vivo Normal Volunteer Studies
Figure 6a depicts a sagittal slice reconstructed through the superficial femoral artery (SFA) in a normal volunteer. The phase-encode axis is oriented along the vertical direction in the image. Signal drop-off can be observed at the two vertical edges, depicting good volume selectivity of the sequence with no visible artifacts. The black-blood suppression achieved is clearly visible in this image. Good signal contrast between the lumen and the vessel wall was achieved, with the vessel-wall tissue signal being on average four times higher than the lumen blood signal.
FIG. 6.

IV-TSE images obtained from normal volunteers. a: A sagittal slice of a SFA in a normal volunteer. b: A sagittal slice and (c) five axial slices at positions marked by the white lines in (a) from a popliteal artery in a normal volunteer. Note the good black-blood suppression in both arteries. Note also incomplete suppression of the slow-moving blood in the popliteal vein in b and c. The vessel wall boundary is marked by the dotted line overlaid in images a and b.
Figure 6b depicts a coronal slice of a popliteal artery from a second normal volunteer. There is good distinction among the vessel wall, the lumen, and adjacent structures. Five axial slices whose positions are marked by white lines in Fig. 6b are also displayed in Fig. 6c. The vascular borders are clearly visualized from the axial reconstructions. Note the good black-blood suppression in the popliteal arteries in Fig. 6b and c. However, this is not the case in the popliteal veins, where one can observe partial suppression of the slow-moving blood.
The normal-volunteer results demonstrate good arterial black-blood suppression, good delineation of the vascular structure, and an artifact-free volume selection.
In Vivo Patient Studies
In this section we present the results obtained from four patients with severe peripheral vascular disease.
Patient 1
The X-ray angiogram of the first patient imaged is shown in Fig. 1 and depicts the length of the occlusion in the patient’s left iliac artery just after the bifurcation. A small volume of interest (VOI) approximately indicated by the black box in Fig. 1 was imaged. An imaged coronal slice (see Fig. 7a) demonstrates a clear distinction between the patent portion of the vessel and the occluded segment. A series of 18 axial sections of this imaged volume (spaced 1.6 mm apart) are shown in Fig. 7b. The positions of the first and last slices are indicated by white lines in Fig. 7a. These slices were 3.2 mm thick (four contiguous slices were averaged along the readout direction using a sliding window scheme to improve the SNR while still obtaining one image every 0.8 mm), and the in-plane resolution was 0.8 mm × 0.8 mm. These axial slices clearly show the presence of an obstructed lumen beginning at around the fifth slice and extending for around 2 cm. The compositional variability in the imaged plaque is captured by the heterogeneity in signal intensity in the images. A mostly dark grayish film (possible intimal hyperplasia or dense fibrous plaque) is observed in the lumen in slices 4-6. In slices 7-13 we begin to notice whitish gray lesions (possible collagen or fat) in the lumen. It is clear from the images that good vessel-wall and plaque visualization is possible.
FIG. 7.
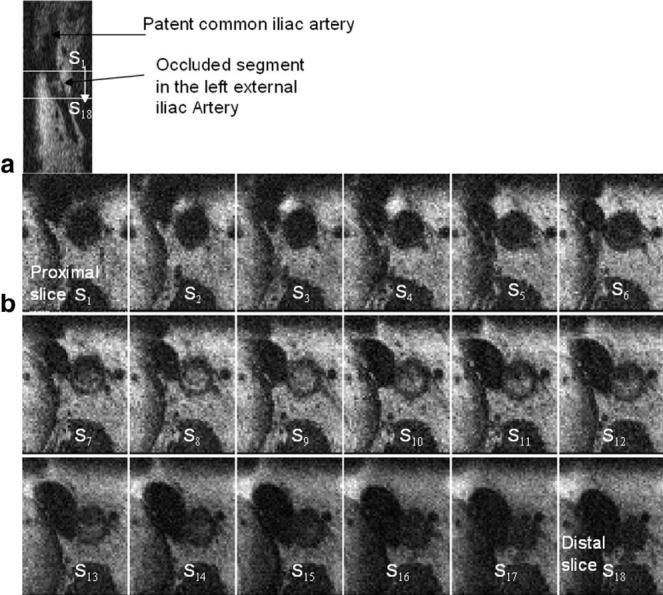
a: A sagittal slice in the same orientation as Fig. 1a, depicting the bifurcation and the intraluminal lesion. b: A series of 18 axial images from a patient with a CTO in the left iliac artery just distal to the bifurcation (see X-ray image of this patient in Fig. 1). Note the lumen occlusion beginning at axial slices 5 and 6, and extending up to slice 16. The in-plane resolution is 0.8 mm × 0.8 mm. The positions of the proximal (S1) and distal (S18) slices are marked on the sagittal slice in a by white lines.
Patient 2
The MR angiogram in a patient with severe bilateral SFA occlusion obtained from a maximum intensity projection (MIP) of the 3D CE-MR image acquisition is shown in Fig. 8a. Note the proximal occlusion of the SFAs reconstituted lower down by extensive collaterals originating from the profunda femoris artery. An IV was localized to encompass the left SFA, and an IV-TSE scan was performed. A series of 25 reconstructed axial images spaced 4 mm apart are shown in Fig. 8b. The positions of the first and last slices are marked by the black dotted lines in Fig. 8a. Note the details in structural variation in the plaque across the slices. The boundaries of the vessel wall are well defined in most axial slices. Features such as medial hypertrophy, finger-like plaque extensions from different points in the wall, and plaque bridges are seen obstructing the lumen (see Fig. 8b).
FIG. 8.
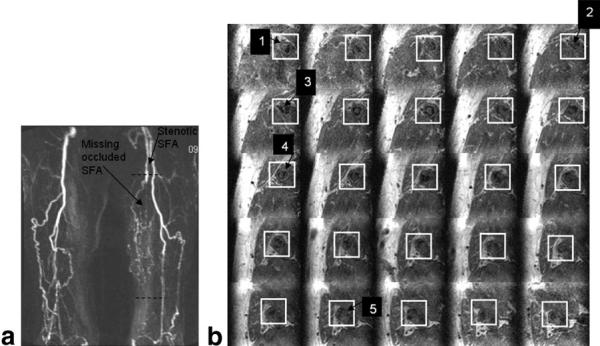
a: MR angiogram of a patient with chronic PAD in both legs. Specifically, note the completely occluded left SFA below the first dashed black line, and the presence of increased collateral circulation to partially compensate for the low perfusion. b: A series of 25 axial slices of the left leg spaced every 4 mm. The positions of the first and last images in the series are shown by the two dashed black lines in Fig. 7a. The white boxes highlight the position of the left SFA. The images clearly depict spatial variations in the plaque structure, such as medial hypertrophy (arrow 1), fibrous plaque bridges (arrow 2), and finger-like structures extending from one end of the wall (arrow 3). Compositional variations (arrows 4 and 5) are also apparent in these images.
Patient 3
A patient with Lériche syndrome who had a bulky CTO originating in the distal abdominal aorta and involving both common iliac arteries was imaged. The MR angiogram obtained from an MIP of the 3D CE-MR image data clearly shows the patent portion of the aorta and the reconstituted common iliacs filling through collaterals from the inferior mesenteric artery (see Fig. 9a). The occluded segments are absent. We imaged a volume approximately in the position of the box shown in Fig. 9a using the IV-TSE sequence. A reconstructed curved slice passing through the centers of the axial arterial slices is shown in Fig. 9b. The dotted black lines overlaid on it highlight the vessel wall boundaries. Note the angiogram-like appearance of the image with good visualization of both the patent and occluded regions. Heterogeneity in the plaque structure through the length of the vessel can be appreciated in this image.
FIG. 9.
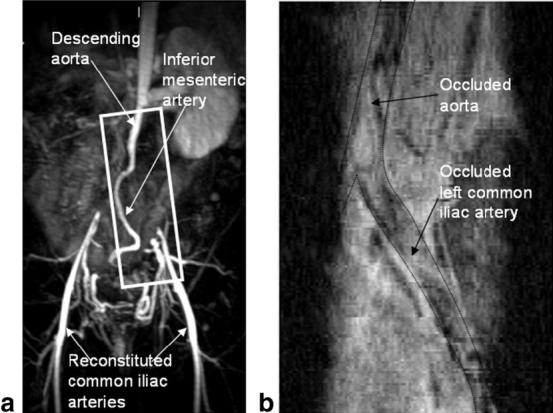
a: MR angiogram of the iliac artery structure obtained from a MIP of a 3D TOF imaging sequence. Note the CTOs in the descending aorta and the common iliac arteries around the bifurcation. The common iliacs are reconstituted further along. b: A reconstructed curved slice passing through the center of the aorta and left common iliac artery from the IV-TSE imaged volume is shown. The white box in a depicts the approximate position of the imaged FOV. The black line overlaid on the image depicts the borders of the artery. The occluded and patent segments of the artery are clearly visible in this curved slice image, giving it an angiogram-like appearance.
Patient 4
A patient with a flush occluded right SFA reconstituted at the Hunter’s canal was imaged. Figure 10 compares four representative high-resolution 2D full-FOV TSE axial images (in-plane resolution = 0.5 mm × 0.5 mm, slice thickness = 3 mm) with four axial slices obtained using the 3D IV-TSE sequence at the closest corresponding locations in this patient. The white boxes on the high-resolution images indicate the approximate position and size of the FOV of the IV images. Note the good correlations in the image details, which corroborate the fidelity of the images obtained using the IV-TSE sequence. These results demonstrate that the loss in SNR due to the reduction in the FOV does not seem to compromise the visual diagnostic quality of these images. However, we do observe differences in flow suppression between 2D and 3D acquisitions, which sometimes make it difficult to discern arteries from neighboring veins in the absence of larger-FOV images to provide the correct anatomical context.
FIG. 10.
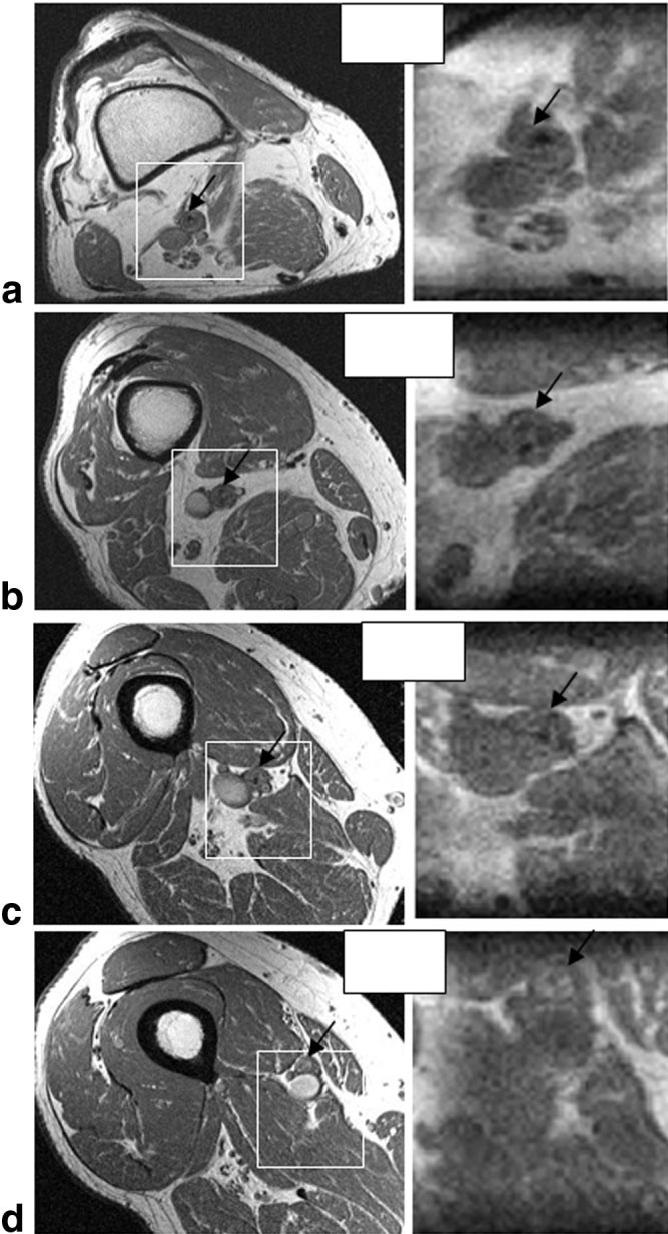
A comparison of four representative high-resolution (0.5 mm × 0.5 mm) full-FOV axial slices obtained from a 2D T1-WTSE sequence (left column) with reconstructed slices obtained from a reduced FOV IV-TSE volume (right column) at the closest corresponding locations in a patient with a CTO in the SFA. The white boxes indicate the approximate position and size of the IV FOV, and the black arrows in all the images point to the SFA. Note the good correlation in the images.
Patient 5
Finally, a patient with CTO in the left external iliac artery was imaged. The MR angiogram obtained from an MIP of the 3D TOF MR image data clearly shows the missing segment in the left external iliac artery reconstituted by filling through collaterals (see Fig. 11a). Figure 11b depicts a series of 24 reconstructed axial images spaced 3.5 mm apart. The positions of the first and last slices are indicated by white lines in Fig. 11a. Note the progression of the completely occluded lumen in the first 12 images to a partially open lumen in the last 12 images. The boundaries of the vessel wall are well defined and details of the structural variation in the plaque are visualized clearly.
FIG. 11.
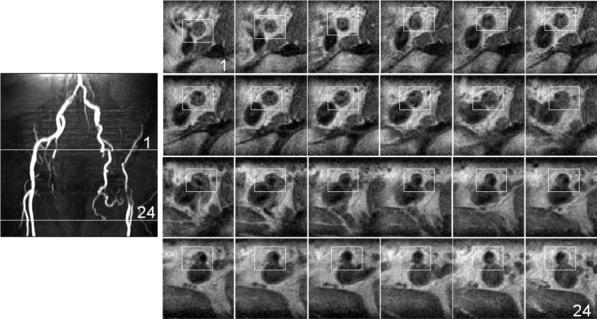
a: MR angiogram of the iliac artery structure obtained from an MIP of a 3D TOF imaging sequence. b: A series of 24 axial slices reconstructed from the IV TSE acquisition of the left external iliac artery. The positions of the first and last images in the series are shown by the two solid white lines in a. Note the gradual progression of the completely occluded lumen to the partially open lumen across the images.
The patient results consistently demonstrate the ability of the proposed method to identify occluded regions and vessel borders, as confirmed independently by two interventional cardiologists (R.J.L. and A.N.R.). These images can be overlaid as a 3D roadmap to aid in guidewire navigation during interventional procedures.
Discussion
Percutaneous peripheral artery CTO recanalization can be very challenging under conventional X-ray guidance. This study demonstrates the applicability of a T1-W IV-TSE MRI pulse sequence in 3D high-resolution imaging of CTOs in peripheral vessels within imaging times of 5-10 min. This represents a nearly eightfold reduction in scan time when compared with full-FOV imaging at an equivalent resolution. The results shown in Fig. 10 demonstrate the ability of the proposed method to achieve TSE contrast at high resolution within shorter scan times. The IV-TSE sequence is an ideal choice for our application because of its flexible contrast properties, low sensitivity to off-resonance and susceptibility artifacts, and inherent black-blood suppression (18,19). Our results demonstrate contrast differences between patent and occluded segments, delineation of the vascular architecture throughout the vessel, and good intensity variations that captured the heterogeneity of the plaque structures using 1.5-T clinical MR scanners.
Previous studies were able to image plaque morphology and composition (5-8), and plaque function (9-13). In the present work, the image contrast and resolution obtained in the ex vivo studies captures the spatial and compositional heterogeneity of the lesion in the left carotid artery in a manner comparable to previous ex vivo studies conducted with higher-field-strength magnets (6,20,21). T1 weighting was selected for its shorter TRs and more clinically feasible scan times. In addition, a T1-W sequence can be used in conjunction with contrast agents for specific contrast enhancement in the future (22,23). While accurate predictions of the lesion composition from the T1-W IV-TSE images alone is not feasible in the absence of histopathological comparison, imaging the lesion heterogeneity may provide useful information to the interventionist to help select appropriate equipment to guide successful recanalization and angioplasty. Alternatively, multiple scans with different contrast weightings could be used to predict lesion composition (5,10,24).
A recent study successfully demonstrated catheter navigation and CTO recanalization wholly under real-time MRI guidance (17), which has been recognized as an important development in the field (25). Advances in registration techniques using the hybrid XMR imaging systems (26,27) now also make it possible to overlay MR images on real-time X-ray images during catheterization procedures. With aggressive catheter-based recanalization procedures increasingly being offered to patients, including those with extensive PAD and unfavorable anatomy, wholly MRI- or XMR-guided catheterizations may approach clinical application in the near future. We hope that the images obtained with our technique will aid in the planning of a recanalization trajectory during such real-time MRI/XMR-guided procedures by delineating the outer contours of the occluded segments from the end of the patent inflow segment, through the occlusion, and into the patent out-flow segment. In addition, information regarding the spatial and compositional heterogeneity of the plaque obtained from these images could improve preprocedural planning and device selection. We also believe that this technique offers a rapid means of performing a postprocedural evaluation.
Black-blood suppression was achieved in patent peripheral arterial vessels in normal volunteers. It has been suggested that several factors affect the inherent black-blood suppression in 3D TSE sequences, including intravoxel dephasing due to the application of flow-uncompensated field gradients, TEs, volume orientation, flow patterns, flow velocity, vessel lumen size, and k-space encoding strategies (28,29). In this study, since the IV was oriented with its readout direction along the direction of the major axis of flow, the large readout gradients and longer TE times increased the dephasing of the blood spins within any given voxel. Second, the small lumen radii in the peripheral arteries resulted in relatively homogenous high blood velocities and hence artifact-free dark lumen. In the presence of a CTO, the increased turbulent flow increased the spread of velocities and further aided black-blood suppression. Third, the FID suppression gradients also contributed to increased intravoxel dephasing effects. Finally, the spatial-misregistration errors in the phase-encode direction and incomplete refocusing of the flowing blood spins due to the nature of the TSE acquisition also increased black-blood suppression.
The patient studies demonstrate a good distinction between the patent and occluded portions of the arteries, and captured lesion heterogeneity in vivo. As a result of inconsistent heart rates, and to shorten the scan times, the normal-volunteer images in Fig. 6a and the patient images in Fig. 7 were not cardiac-gated. This resulted in some blurring of the vessel walls but did not deteriorate the diagnostic usefulness of these images.
All of the in vivo images depicted excellent volume selectivity with no visible artifacts. However, like any reduced-FOV imaging technique, the IV imaging technique decreases the SNR of the image as compared to a full-FOV image. The decrease in SNR can be roughly calculated as (1 - √P2/P1) × 100%, where P1 is the phase-encode FOV using a conventional 3D TSE sequence, and P2 is the FWHM of the IV slab profile in the phase-encode direction. This typically translated to a 30-40% decrease in SNR in our experiments. We found that the best SNR was achieved in the ex vivo study in which the coil was close to the arterial specimen. The in vivo SNRs in the patient iliac studies were lower than those acquired in the femoral or popliteal imaging studies because the distance of the coils from the VOI was larger. In the future, specially designed surface coils could potentially improve the SNR considerably. One could also use intravascular coils in conjunction with surface coils to obtain higher signal in the atherosclerotic arteries by introducing the coils in adjacent veins (30).
Conclusions
In conclusion, we have demonstrated that a T1-W 3D TSE sequence with IV imaging provides a means of imaging CTO lesions in peripheral vessels for practical percutaneous revascularization within 5-10 min. This may improve preprocedural planning and device selection, and postprocedural evaluation of CTO recanalization. The results may also be used as a 3D roadmap overlaid during X-, MR-, or X-MR-guided interventional procedures.
Acknowledgments
The authors thank Victor J. Wright, Annette M. Stine, and William Schenke for their invaluable help with this project.
Footnotes
This article is a US Government work and, as such, is in the public domain in the United States of America.
References
- 1.Hirsch AT, Criqui MH, Treat-Jacobson D, Regensteiner JG, Creager MA, Olin JW, Krook SH, Hunningshake DB, Comerota AJ, Walsh ME, Mc-Dermott MM, HIatt WR. Peripheral arterial disease detection, awareness, and treatment in primary care. J Am Med Assoc. 2001;286:1317–1324. doi: 10.1001/jama.286.11.1317. [DOI] [PubMed] [Google Scholar]
- 2.Criqui MH, Langer RD, Fronek A, Feigelson HS. Mortality over a period of 10 years in patients with peripheral arterial disease. N Engl J Med. 1992;326:381–386. doi: 10.1056/NEJM199202063260605. [DOI] [PubMed] [Google Scholar]
- 3.Constantini V, Lenti M. Treatment of acute occlusion of peripheral arteries. Thromb Res. 2002;106:V285–V294. doi: 10.1016/s0049-3848(02)00104-4. [DOI] [PubMed] [Google Scholar]
- 4.Kandazari DE. The challenges of chronic total coronary occlusions: an old problem in a new perspective. J Interv Cardiol. 2004;17:259–267. doi: 10.1111/j.1540-8183.2004.04029.x. [DOI] [PubMed] [Google Scholar]
- 5.Yuan C, Kerwin WS. MRI of atheroslerosis. J Magn Reson Imaging. 2004;19:710–719. doi: 10.1002/jmri.20070. [DOI] [PubMed] [Google Scholar]
- 6.Itskovich VV, Samber DD, Mani V, Aguinaldo JGS, Fallon JT, Tang CY, Fuster V, Fayad ZA. Quantification of human atherosclerotic plaques using spatially enhanced cluster analysis of multicontrast-weighted magnetic resonance images. Magn Reson Med. 2004;52:515–523. doi: 10.1002/mrm.20154. [DOI] [PubMed] [Google Scholar]
- 7.Saam T, Ferguson MN, Yarnykh VL, Takaya N, Xu D, Polissar NL, Hatsukami TS, Yuan C. Quantitative evaluation of carotid plaque composition by in vivo MRI. Arterioscler Thromb Vasc Biol. 2005;25:234–239. doi: 10.1161/01.ATV.0000149867.61851.31. [DOI] [PubMed] [Google Scholar]
- 8.Luo Y, Poilissar N, Han C, Yarnykh V, Kerwin WS, Hatsukami TS, Yuan C. Accuracy and uniqueness of three in vivo measurements of atherosclerotic carotid plaque morphology with black blood MRI. Magn Reson Med. 2003;50:75–82. doi: 10.1002/mrm.10503. [DOI] [PubMed] [Google Scholar]
- 9.Chu B, Ferguson MS, Underhill H, Takaya N, Cai J, Kliot M, Yuan C, Hatsukami TS. Images in cardiovascular medicine. Detection of carotid atherosclerotic plaque ulceration, calcification, and thrombosis by multicontrast weighted magnetic resonance imaging. Circulation. 2005;112:e3–e4. doi: 10.1161/CIRCULATIONAHA.104.494419. [DOI] [PubMed] [Google Scholar]
- 10.Chu B, Kampschulte A, Hatsukami TS, Yuan C. Hemorrhage in the atherosclerotic carotid plaque: a high-resolution MRI study. Stroke. 2004;35:1079–1084. doi: 10.1161/01.STR.0000125856.25309.86. [DOI] [PubMed] [Google Scholar]
- 11.Chu B, Yuan C, Takaya N, Shewchuk JR, Clowes AW, Hatsukami TS. Images in cardiovascular medicine. Serial high-spatial resolution, multisequence magnetic resonance imaging studies identify fibrous cap rupture and penetrating ulcer into carotid atherosclerotic plaque. Circulation. 2006;113:e660–e661. doi: 10.1161/CIRCULATIONAHA.105.567255. [DOI] [PubMed] [Google Scholar]
- 12.Sirol MFZ, Itskovich VV, Mani V, Aquinaldo JG, Fallon JT, Misselwitz B, Weinmann HJ, Fuster V, Toussiant JF, Fayad ZA. Lipid-rich atherosclerotic plaques detected by gadfluorine-enhanced in vivo magnetic resonance imaging. Circulation. 2004;109:2890–2896. doi: 10.1161/01.CIR.0000129310.17277.E7. [DOI] [PubMed] [Google Scholar]
- 13.Fayad ZA, Fuster V. Clinical imaging of the high-risk or vulnerable atherosclerotic plaque. Circ Res. 2001;89:305–316. doi: 10.1161/hh1601.095596. [DOI] [PubMed] [Google Scholar]
- 14.Feinberg D, Hoenninger JC, Crooks LE, Kaufman L, Watts JC, Arakawa M. Inner volume MR imaging: technical concepts and their application. Radiology. 1985;156:743–747. doi: 10.1148/radiology.156.3.4023236. [DOI] [PubMed] [Google Scholar]
- 15.Crowe LA, Gatehouse P, Yang GZ, Mohiaddin RH, Verghese A, Charrier C, Keegan J, Firmin DN. Volume-selective 3D turbo spin echo imaging for vascula wall imaging and distensibility measurement. J Magn Reson Imaging. 2003;17:572–580. doi: 10.1002/jmri.10294. [DOI] [PubMed] [Google Scholar]
- 16.Kholmovski EG, Parker DL, Alexander AL. A generalized k-sampling scheme for 3D fast spin echo. J Magn Reson Imaging. 2000;11:549–558. doi: 10.1002/(sici)1522-2586(200005)11:5<549::aid-jmri11>3.0.co;2-g. [DOI] [PubMed] [Google Scholar]
- 17.Raval AN, Karmarkar PV, Guttman MA, Sampath S, DeSilva R, Aviles RJ, Xu M, Wright VJ, Schenke WH, Kocaturk O, Dick AJ, Raman VK, Atalar E, McVeigh ER, Lederman RJ. Real-time magnetic resonance imaging-guided endovascular recanalization of chronic total arterial occlusion in a swine model. Circulation. 2006;113:1101–1107. doi: 10.1161/CIRCULATIONAHA.105.586727. [DOI] [PMC free article] [PubMed] [Google Scholar]
- 18.Hennig J, Nauerth A, Friedburg H. RARE imaging: a fast imaging method for clinical MR. Magn Reson Med. 1986;3:823–833. doi: 10.1002/mrm.1910030602. [DOI] [PubMed] [Google Scholar]
- 19.Yuan C, Schmiedl UP, Weinberger E, Krueck WR, Rand SD. Three-dimensional fast spin-echo imaging: pulse sequence and in vivo image evaluation. J Magn Reson Imaging. 1993;3:894–899. doi: 10.1002/jmri.1880030617. [DOI] [PubMed] [Google Scholar]
- 20.McAteer MA, Schneider JE, Clarke K, Neubauer S, Channon KM, Choudhury RP. Quantification and 3D reconstruction of atherosclerotic plaque components in apolipoprotein E knockout mice using ex vivo high-resolution MRI. Arterioscler Thromb Vasc Biol. 2004;24:2384–2390. doi: 10.1161/01.ATV.0000146811.19029.fb. [DOI] [PubMed] [Google Scholar]
- 21.Zheng J, Naqa IE, Rowold FE, Pilgram TK, Woodward PK, Saffitz JE, Tang D. Quantitative assessment of coronary artery plaque vulnerability by high-resolution magnetic resonance imaging and computational biomechanics: a pilot study ex vivo. Magn Reson Med. 2005;54:1360–1368. doi: 10.1002/mrm.20724. [DOI] [PMC free article] [PubMed] [Google Scholar]
- 22.Botnar RM, Buecker A, Manning WJ, Spuentrup E, et al. In vivo magnetic resonance imaging of coronary thrombosis using a fibrin-binding molecular magnetic resonance contrast agent. Circulation. 2004;110:1463–1466. doi: 10.1161/01.CIR.0000134960.31304.87. [DOI] [PubMed] [Google Scholar]
- 23.Flacke S, Fischer S, Wickline SA, Lanza GM, et al. Novel MRI contrast agent for molecular imaging of fibrin: implications for detecting vulnerable plaques. Circulation. 2001;104:1280–1285. doi: 10.1161/hc3601.094303. [DOI] [PubMed] [Google Scholar]
- 24.Mitsumori LM, Hatsukami TS, Cai J, Yuan C, et al. In vivo accuracy of multisequence MR imaging for identifying unstable fibrous caps in advanced human carotid plaques. J Magn Reson Imaging. 2003;17:410–420. doi: 10.1002/jmri.10264. [DOI] [PubMed] [Google Scholar]
- 25.Baim DS, Kwong RY. Is magnetic resonance image guidance the key to opening chronic total occlusions? Circulation. 2006;113:1053–1055. doi: 10.1161/CIRCULATIONAHA.105.609263. [DOI] [PubMed] [Google Scholar]
- 26.Yu H, Fahng R, Pelc NJ. Co-registration of x-ray and MR fields of view in a hybrid XMR system. J Magn Reson Imaging. 2005;22:291–301. doi: 10.1002/jmri.20376. [DOI] [PubMed] [Google Scholar]
- 27.Rhode KS, Sermesant M, Razavi R, Hill DL, et al. A system for real-time XMR guided cardiovascular intervention. IEEE Trans Med Imaging. 2005;24:1428–1440. doi: 10.1109/TMI.2005.856731. [DOI] [PubMed] [Google Scholar]
- 28.Jara H, Yu BC, Caruthers SD, Melhem ER, Yucel EK. Voxel sensitivity function description of flow-induced signal loss in MR imaging: implications for black-blood MR angiography with turbo spin-echo sequences. Magn Reson Med. 1999;41:575–590. doi: 10.1002/(sici)1522-2594(199903)41:3<575::aid-mrm22>3.0.co;2-w. [DOI] [PubMed] [Google Scholar]
- 29.Alexander AL, Buswell HR, Chapman BE, Tsuruda JS, Parker DL. Intracranial black-blood MR angiography with high resolution 3D fast spin echo. Magn Reson Med. 1998;40:298–310. doi: 10.1002/mrm.1910400216. [DOI] [PubMed] [Google Scholar]
- 30.Hofmann LV, Liddell RP, Eng J, Wasserman BA, Arepally A, Lee DS, Bluemke DA. Human peripheral arteries: feasibility of transvenous intravascular MR imaging of the arterial wall. Radiology. 2005;235:617–622. doi: 10.1148/radiol.2352040340. [DOI] [PubMed] [Google Scholar]