Abstract
Blood flow in large vessels can be noninvasively evaluated with phase-contrast (PC) MRI by encoding the spin velocity to the image phase. Conventional phase-difference processing of the flow-encoded image data yields velocity images. Complex-difference processing is an alternative to phase-difference methods, and has the advantage of eliminating signal from stationary spins. In this study, two acquisitions with differential flow encoding are subtracted to yield a single projection that contains signal from only those spins moving in the direction of the flow-encoding gradients. The increase in acquisition efficiency allows real-time flow imaging with a temporal window as short as two acquisition lengths (60 ms). Validation of the complex-difference method by comparison with conventional gated-segmented PC-MRI in a flow phantom yielded a correlation of r > 0.99. Peak arterial flow rates in the popliteal artery and desending aorta measured in vivo with the complex-difference method were 0.92 ± 0.06 of the values measured with conventional PC imaging. Real-time in vivo volumetric flow imaging of transient flow events is also presented.
Keywords: MRI, phase-contrast, complex-difference, real-time, flow
Quantitative measurement of blood volume flow rates in large vessels with gated-segmented, phase-contrast (PC) MRI is an established technique whereby through-plane velocities are measured in an imaging plane oriented perpendicular to the flow direction (1,2). Blood flow rates within a vessel of interest are measured by integration of the voxel velocities from within the vessel lumen. In order to acquire images with temporal and spatial resolution that are sufficient for quantitative flow measurements, the segmented experiments typically span many (presumably identical) cardiac cycles. Conventional gated-segmented PC-MRI techniques are thus inappropriate for quantitative velocity imaging if the target flow is transient in nature, or if noncardiac motion occurs during the experiment. For example, motion from breathing or exercise during a segmented experiment will generate blur and ghost image artifacts. Cardiac arrhythmias are transient phenomena of critical importance; however, they cannot be characterized by segmented blood flow studies because of heartbeat-to-heartbeat variations in flow patterns.
In this study we present a real-time velocity imaging method that is appropriate for quantitatively measuring blood flow in large vessels. A significant improvement in temporal resolution, as compared to conventional PC-MRI, is achieved by selective imaging of moving spins using complex-difference processing of the flow-encoded data. Subtraction of unwanted signal arising from stationary background tissue is a commonly applied technique when moving spins are targeted within the vascular system, and has previously been described for use in angiographic (3,4) and flow (5-8) imaging. In order to provide temporal resolution that is sufficient for real-time arterial blood flow imaging, we process the through-plane PC data using only a single projection direction (5,6). Two single acquisitions, with differential flow encoding, are subtracted to produce a projection of the moving spins with an intensity that is proportional to the blood flow rate. In the present work, methods of absolute flow quantification are derived, and practical techniques to ensure suppression of unwanted background signals are described. Conventional gated-segmented PC-MRI, which we will define here as a PC experiment with phase-difference processing, is used to validate the flow rates measured with the complex-difference projection technique both in a flow phantom and under conditions of normal flow in vivo in the abdominal aorta and the popliteal artery of normal volunteers. The real-time complex-difference projection method is also used to measure flow rates in vivo in normal volunteers during conditions of transient flow.
THEORY
The integrated signal from the projection of magnetization along an ideal line can be expressed as
| [1] |
where κ(y) is a geometric term that accounts for the spatial dependence of the radiofrequency (RF) receiver-coil sensitivity, and M+(y) is the excited transverse magnetization along the line, M+(y) = |M+(y)|exp(iθ(y)). The projection direction, y, is perpendicular to the slice-selection and read-encoding directions, as shown in Fig. 1. The amplitude of the transverse magnetization at each location along the projection, |M+(y)|, is proportional to the spin density, ρ(y), and is weighted by pulse sequence parameters such as TE, TR, flip angle, and spin relaxivities (T1, T2, ). The phase of the transverse magnetization, θ(y), can be expressed as the sum of the background phase, φb (from radiofrequency (RF) coils, off-resonance effects, gradient eddy currents, and Maxwell terms) and ϕv, the velocityencoded phase.
FIG. 1.
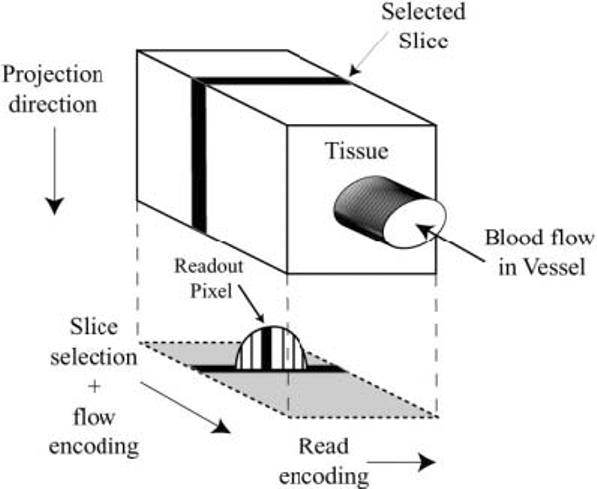
A cartoon displays the read-encoding, slice/flow-encoding, and projection directions for the complex-difference flow imaging experiment. The projected signal is from the moving blood inside the vessel while signal from the tissue is subtracted out.
| [2] |
In Eq. [2] M1 is the magnetic field gradient first moment used to encode the spin velocity, v(y), and γ is the gyromagnetic ratio. For the purposes of this study, flow encoding is limited to the slice-selection direction, ϕv = γM1zvz(y). The gradient first-moment term is commonly substituted with the corresponding velocity-encoding strength, Venc, using the definition γΔM1Venc = π, where ΔM1 = 2M1z, so that ϕv = πvz(y)/2Venc. The factor of 2 is due to the subtraction of the integrated signal intensity from two differentially flow-encoded projection experiments with equal and opposite first moments, ±M1z, which yields a differential signal intensity of
| [3a] |
which can be expressed as
| [3b] |
The following approximations can be used to simplify Eq. [3b]:
For vz(y) << Venc. .
If the vessel blood pool is uniformly excited and has a uniform spin density, then κ(y)|M+(y)| = κ|M+|.
If the background phase does not vary significantly across the vessel of interest, and there are no overlapping vessels in the projection, exp(iφb(y)) = exp(iφb).
The error from approximation 1 can be controlled with the appropriate choice of Venc given the peak velocities expected in the vessels of interest. For all exeriments in this study we chose a Venc that is three times the peak velocity to give rise to a <5% underestimation error while still yielding 50% of the available signal. Approximation 2 is valid for excitation with volume coils, such as conventional body or head coils, but may not hold for linear antenna or smaller surface coils. With regard to approximation 3, it was shown previously that background image phase, φb, tends to comprise primarily low spatial frequencies (9), and thus should not vary significnatly over vessel cross sections. The direct overlap of arteries can be avoided by the appropriate choice of projection angle with the use of scout images. Incorporating the three approximations above, Eq. [3b] can be rewritten as
| [4] |
Equation [4] expresses the proportionality of the complex-difference signal, Δs, for a projection along an ideal line at a location x, to the integrated velocity through the projection line. From this expression we can write the infinitesimal flow rate, ΔF, through the projection line in terms of the complex-difference signal intensity.
| [5] |
The integrated flow rate for a given voxel, through a plane that is perpendicular to z, is the mean value of ΔF across the voxel in the readout dimension,
| [6a] |
It is important to note that both the velocity (and thus Δs) and the available transverse magnetization, M+, are functions of both y and x. Incorporating approximation 2 from above (i.e., that the vessel blood pool is uniformly excited and has a uniform spin density), we will assume M+ is a constant across the vessel. We cannot resolve the distribution of velocities across the pixel in the readout dimension, but what we measure reflects the mean velocity, and hence the mean differential signal intensity. We can thus rewrite the flow equation in terms of the mean values across a pixel,
| [6b] |
In practice, one measures the total signal intensity in a voxel that is weighted by both the readout dimension, Δx, as shown in Eq. [6b], and slice dimension, Δz. This intensity is equivalent to the mean value of Δs in the voxel weighted by the voxel dimensions.
| [7] |
Combining Eqs. [5]-[7], the voxel flow rate is related to the voxel signal intensity by
| [8] |
The scaling factor, κ|M+|, can be calculated with a calibration experiment that maintains the signal yield of the complex-difference experiment. From Eq. [1] we can write that the absolute value of the signal intensity for a single image voxel, scalibration, is equal to κ|M+|ΔxΔyΔz if the spin density and excitation are uniform over the voxel volume. The calibration image must contain voxels within the lumen of interest without tissue contamination in order for the blood calibration signal to be measured correctly. In terms of the blood signal intensity from the calibration experiment, we can express the flow rate, from Eq. [8], as
| [9] |
This expression is used for all complex-difference flow rates measured in this study. The background phase term, exp(iφb), is subtracted from the phase of measured complex-difference signal to yield a real value for the flow, F.
The pulse sequence signal yield can be reduced when the spins are excited by multiple RF pulses, which causes saturation of the longitudinal magnetization, Mz. Polzin et al. (8) derived an expression for the saturation factor, α, for the reduction in Mz for spins moving with a velocity, vz, through a slice of thickness, d, excited by N RF pulses with an excitation interval of TR.
| [10] |
In Eq. [10], A = cos(flip angle)E and B = 1 − E, where E = exp(− TR/T1), and rem is the remainder of the ratio, d/vzTR. The saturation factor reaches unity, α = 1, for spins traveling at vz ≥ d/TR. This equation is used to select flip angles, slice thickness, and excitation intervals that minimize potential saturation of the blood signal in both the complex-difference and calibration experiments.
MATERIALS AND METHODS
All MR measurements were performed on a Siemens 1.5 T Sonata scanner (Siemens Medical Sytems, Erlangen, Germany) using a flexible single-element surface coil for signal reception. Figure 2 displays the pulse sequence used for all complex-difference and calibration experiments. A balanced flow-encoding scheme with equal and opposite first moments, ±M1z, was used for all complex-difference experiments, while the calibration experiment incorporated flow compensation, M1z = 0. To ensure that pulse sequence signal yield was maintained between the two experiments, their key elements were identical (TE, flip angle, readout bandwidth, and slice thickness). A longer TR was used for the spin-density experiment, as compared to the complex-difference experiment, to ensure that the blood pool spins were not saturated during the diastolic flow phases. A shorter TR can be tolerated with the complex-difference experiments because they are time-resolved, and potential spin saturation from very low flow rates will be limited to cardiac phases that have a minor contribution to the total or peak flow rates. The flow-encoding gradients, shown in Fig. 2, were designed to minimize the difference in eddy currents and Maxwell terms between the two encoding steps. In particular, time shifting of the flow-encoding gradients, as opposed to variations in gradient amplitudes, was used to control the first moment while still maintaining equal and opposite first moments, ±M1z. Maintaining identical flow-encoding gradient shapes between experiments also minimized potential differences in tissue phase from mismatched gradient areas. The Venc was set to be at least three times larger than the maximum velocity in the targeted vessel in order to keep the small-angle approximation error < 5% at this peak velocity ({sin(ι) – ι}/sin(ι) < 5%). Note that this small-angle approximation error is calculated with respect to a single flow-encoding step, which has an effective Venc that is double the difference experiment. The RF pulse phase was held constant in all complex-difference experiments. A slab saturation pulse (Fig. 2) provided the option to saturate venous or arterial blood flow, as the application demanded. Additionally, the direction of the projection was selected to avoid overlap of vessels along the projection. The spin-density image was used as a vessel map to aid in the selection of the projection direction.
FIG. 2.
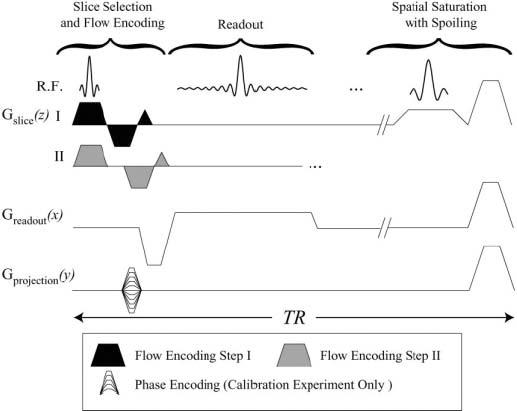
The real-time complex-difference pulse sequence. The two differential flow-encoding steps with first moments, ±M1z, labeled I and II, are interleaved in sequential excitations. An optional slab-selective saturation pulse can be played out every TR. The same pulse sequence elements, with the inclusion of phase-encoding gradients, are used for the collection of a calibration spin-density image.
The projected complex-difference signal intensity from a vessel of interest was scaled to units of flow in milliliters per second using the calibration image intensity (see Eq. [9]), using voxel intensities from within the lumen of interest. The calibration experiment phase-encoding resolution was selected to ensure that several voxels could be resolved within the vessel lumen. Spin-density images were acquired in a breath-hold for studies in the aorta. For all complex-difference experiments, the sequence parameters included a slice thickness of 2.0 mm, a TR of 30 ms, and a flip angle of 30°. For these parameters the saturation factor, α in Eq. [10], is unity for velocities ≥ 6.67 cm/s, with values of [0.99, 0.97, 0.95, 0.92, 0.85, 0.70] for velocities from 6 cm/s to 1 cm/s, in 1 cm/s steps, using T1(blood) = 1450 ms. For the calibration experiments, a longer TR of 60 ms resulted in a saturation factor of unity for velocities ≥ 3.33 cm/s.
For flow validation experiments, volumetric rates were measured in a constant flow rate tube phantom (10-mm inner diameter) using both conventional PC-MRI and the complex-difference projection method. Conventional PC parameters were: Venc = 1000 mm/s, slice thickness = 4.0 mm, FOV = 192 × matrix = 192 mm, 192 × 192, receiver bandwidth = ±36 kHz, TE/TR = 3.4 ms/6.5 ms, and flip angle = 30°. Complex-difference parameters were: Venc = 1000–3000 mm/s, slice thickness = 2.0 mm, readout FOV = 192 mm, 192 readout points, receiver bandwidth =±28 kHz, TE/TR = 4.6 ms/60 ms, and flip angle = 30°. Flow rates ranging from 6 ml/s to 50 ml/s were compared. The solution in the tube system was water doped with Gd-DTPA (Magnevist, Berlex) (0.05 mmol/L) to approximate the T1 of blood at 1.5 T (1450 ms).
Complex-difference flow validation studies were also performed in vivo, in five normal volunteers. All volunteer studies were done under an IRB-approved protocol. Again, flow rates measured with the complex-difference method were compared with conventional gated-segmented PCMRI in order to validate the former. Time-resolved flow rates were measured in the popliteal artery, at the level of the knee, as well as in the abdominal aorta, below the level of the renal arteries. Conventional gated-segmented PC experiments at the level of the knee incorporated the same imaging parameters used in the phantom studies, and with a temporal resolution of 30 ms, with the acquisition of two views per segment. A larger FOV and reduced spatial and temporal resolution were used for the aorta PC experiments due to the requirement for breath-holding, with Venc = 2000 mm/s, FOV = 360 mm × 270 ms, matrix = 192 × 96, and with four views per segment, for a temporal resolution of 60 ms. The parameters for the popliteal complex-difference experiments were: Venc = 1800 mm/s, slice thickness = 2.0 mm, readout FOV = 192 mm, 192 readout points, receiver bandwidth = ±28 kHz, TE/TR = 4.6 ms/30 ms, and flip angle = 30°. For the aorta experiments, the readout FOV was increased to 320 mm and the Venc was increased to 3600 mm/s.
Finally, the complex-difference projection method was used to measure blood flow rates under conditions of transient blood flow:
Flow rates in the popliteal artery were measured during the release of an occlusive thigh cuff that was inflated to supersystolic pressures for 5 min in order to induce ischemia. It is well known that blood flow to the ischemic region significantly increases when the cuff is released. This is termed reactive hyper-emia, and is characterized by a rapid recovery to normal blood flow in healthy normals. The Venc was set to 3000 mm/s for these experiments.
Flow rates in the abdominal aorta and inferior vena cava, below the level of the renal arteries, were measured during a Valsalva maneuver. Volunteers maintained a forced-expiration thoracic pressure (bearing down) without exhaling for 10–20 s. The Venc was set to 4500 mm/s for these experiments, and the readout FOV was increased to 360 mm. A flexible surface coil, placed on the abdomen, was used for signal reception.
For all complex-difference experiments, the interleaved series of differentially flow-encoded projections were interpolated to every TR prior to complex-difference processing using a sinc-Gaussian interpolation kernel. Regions of interest from the conventional PC images were selected interactively by the user, with adjustments made for each cardiac phase to account for vessel motion throughout the cardiac cycle.
RESULTS
In validation studies, we compared flow rates in a constant-rate flow phantom measured with conventional PCMRI to rates measured with the complex-difference projection method. Six steady flow rates ranging from 6 to 50 ml/s were compared and a linear correlation analysis yielded an r > .99 between the two methods, with a slope of 0.954 and y-intercept of 0.12 ml/s.
Calibration of Complex-Difference Projections
A spin-density image at the level of the knee, shown in Fig. 3a, highlights the popliteal artery and the popliteal and greater saphenous veins. The inset in the spin-density image in Fig. 3a shows a cross section of the spin-density signal intensity (scalibration) across the artery. Note the square profile across the vessel lumen. This signal intensity is used to calibrate the complex-difference data to units of flow in milliliters per second, using Eq. [9]. Figure 3b displays a real-time series of complex-difference projections for the same axial slice location. The projection direction is indicated in Fig. 3a (up/down). For this experiment the venous signal, which is clearly visible on the spin-density image in Fig. 3a, is saturated by the slab-selective spoiler, which was applied inferior to the slice location. Figure 3c displays the complex-difference signal intensity (from Fig. 3b) integrated across the artery in the readout direction. The integrated signal intensity from a sample location next to the artery is also displayed. Note that the background signal is reduced to well below the amplitude of the complex-difference signal intensity. Measurement of background signal intensity before and after complex subtraction indicated a suppression factor of >100-fold for all experiments in this study, for slices in both the knee and the abdomen. It was determined empirically that optimal background suppression was achieved with a constant RF pulse phase, while any phase variation between sequential pulses gave rise to an increase in the background signal. The inset in Fig. 3b shows the level of the background signal for a projection at a single time-point from the data in Fig. 3b, at a phase of peak flow.
FIG. 3.
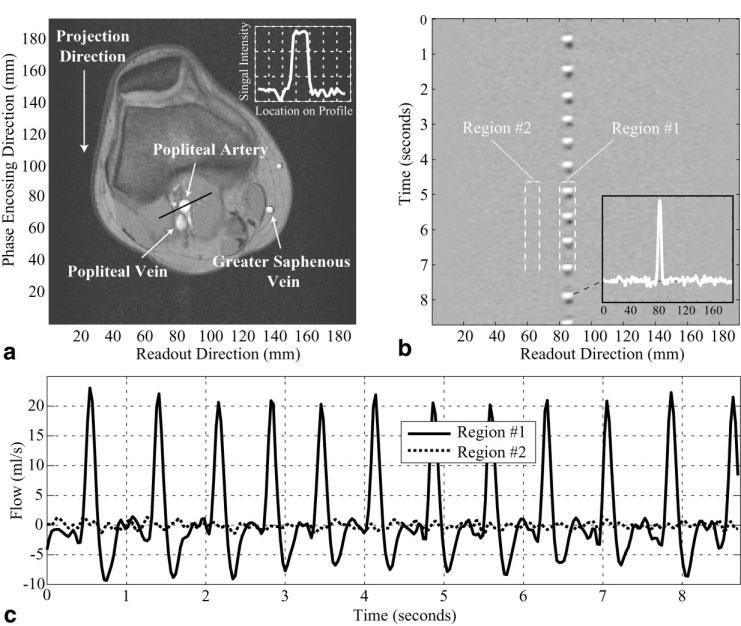
a: A spin-density-weighted image at the level of the knee is used to measure the spin-density signal intensity in the popliteal artery. The inset shows a cross section of the spin-density signal intensity (scalibration) across the artery. A real-time series of complex-difference projections for the slice in a is shown in b, with a temporal resolution of 30 ms. Each horizontal line in b is the complex-difference signal intensity across the readout direction. c: The complex-difference signal intensity (from b) integrated across the artery in the readout direction, from 80 mm to 88 mm. The integrated signal intensity from a location next to the artery, from 60 mm to 68 mm, is also plotted in c. The signal intensity units are calibrated to milliliters per second using Eq. [9].
In Vivo: Validation
Figure 4a displays the total flow rate in the popliteal artery of the normal volunteer shown in Fig. 3, measured with a conventional gated-segmented PC experiment. The real-time complex-difference flow rates for several sample cardiac cycles, from Fig. 3c, are plotted with the conventional PC results to allow for direct comparison of the methods. The plots were temporally matched with the times of peak flow, and subsequently offset in time to place a low-flow phase at t = 0. Validation experiments were repeated in five normal volunteers, yielding similar results in all studies. A similar comparison was made for flow in the aorta, below the level of the renal artery, for the same five normal volunteers. The results from a single volunteer are shown in Fig. 4b. Peak flow rates measured with the two methods were compared for all experiments, with the complex-difference results underestimating the flow by a factor of 0.92 ± 0.06. The mean peak value from the complex difference method, which is typically over 16 heartbeats, was used to generate a representative peak flow rate for that vessel in that volunteer. In total, 20 measurement locations were used to derive the above underestimation value, with four locations from each of the five normal volunteers.
FIG. 4.
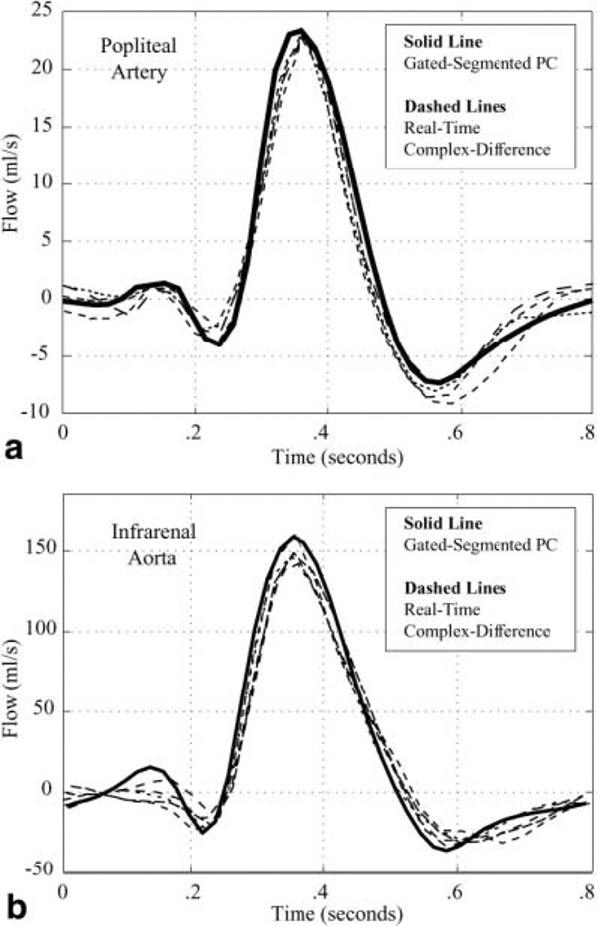
a: The blood flow rate in the popliteal artery of a normal volunteer is measured with conventional gated-segment PC-MRI (solid line). Several heartbeats of blood flow in the same artery are measured with the real-time complex-difference method (dashed lines) for a direct comparison of the two techniques. A single complete cardiac cycle is displayed. b: The blood flow rate in the infrarenal aorta of a normal volunteer is measured with conventional gated-segment PC-MRI (solid line). Several heartbeats of blood flow in the same artery are measured with the real-time complex-difference method (dashed lines) for a direct comparison of the two techniques. A single complete cardiac cycle is displayed.
In Vivo: Transient Flow
The blood flow rate in the popliteal artery of a normal volunteer was measured with the real-time complex-difference method during a period of arrested flow and subsequent increased flow during a period of reactive hyperemia (Fig. 5). Note that the sharp onset of flow with the release of the occlusive thigh cuff is well characterized with the complex-difference method. The resting mean flow rate for this volunteer was ∼1 ml/s and the peak hyperemic flow rate was ∼16 ml/s, which indicates a flow reserve of ∼16. Flow reserves ranging from 10 to 20 have previously been reported for skeletal muscle in response to exercise or reactive hyperemia (10,11). Note that in addition to allowing the mean flow rates to be measured, the time-resolved waveforms clearly illustrate the complex evolution of the flow within each heartbeat, allowing both peak flow and minimum flow rates to be identified.
FIG. 5.
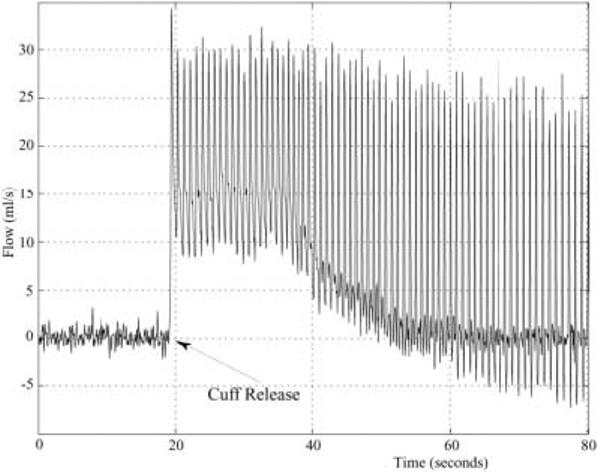
Blood flow in the popliteal artery of a normal volunteer is measured with the real-time complex-difference method during the release of an occlusive thigh cuff. The thigh cuff was inflated to supersystolic pressures (220 mmHg) for 5 min to induce reactive hyperemia.
Blood flow in the abdominal aorta of a normal volunteer was measured with the real-time complex-difference method throughout a Valsalva maneuver (see Fig. 6 for flow results). Figure 6a shows the aortic blood flow rates during restful breathing, the bear-down phase of the Valsalva maneuver, and the subsequent recovery. The venous blood flow was not saturated in this experiment, which allowed blood flow in the inferior vena cava to be simultaneously measured (Fig. 6b). Note the variation of venous return during the restful free-breathing, the complete stoppage of venous return during the bear-down phase, and the subsequent exaggerated venous flow on release. Simultaneously, the stroke volume continuously drops while the venous return is stopped in the bear-down phase, and the heart rate increases from the resting rate of 70 BPM to 90 BPM (Fig. 6a).
FIG. 6.
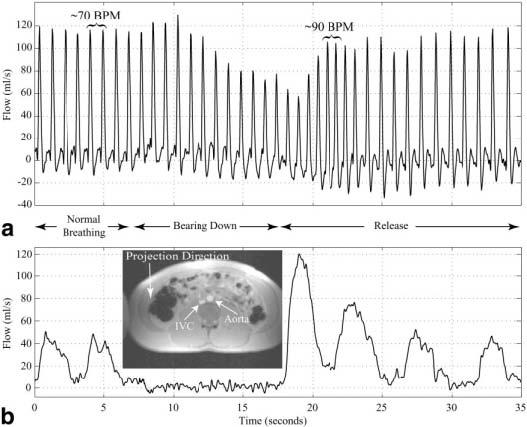
a: Blood flow in the infrarenal aorta of a normal volunteer is measured throughout a Valsalva maneuver, starting with normal breathing and during the time of forced expiration (bearing down). The timing of the paradigm is shown between the figures. b: The blood flow in the inferior vena cava is measured simultaneously with the aortic flow shown in a. The inset in b shows the spin-density image collected prior to the Valsalva experiment.
DISCUSSION
We have illustrated that real-time volumetric arterial blood flow rates can be measured with PC-MRI using complex-difference processing of differentially flow-encoded image data. In vivo volumetric blood flow measurements with true temporal resolutions of two acquisition intervals (2 * TR = 60 ms) were presented. Calibration of the complex-difference signal intensity to volumetric flow rates in milliliters per second was achieved by normalization with a spin-density image. Both phantom and in vivo studies illustrate excellent agreement between volumetric flow rates measured with conventional gated-segmented PCMRI and the real-time complex-difference method. In vivo studies also illustrate the applicability of the complex-difference method for imaging transient flow. Significant changes in flow were measured without susceptibility to artifacts from breathing or bulk motion. Heartbeat-to-heartbeat variations in heart rate, and peak and mean flow were displayed. The TR of 30 ms was sufficiently long to minimize saturation of blood-pool spins when used in combination with a flip angle of 30°, while it provided sufficient temporal resolution for the characterization of complex arterial waveforms. The introduction of T1-shortening contrast agents is known to increase contrast between vascular space and the surrounding tissue, and could be used to allow shorter TRs, larger flip angles, or thicker slices to provide higher temporal resolution or increased signal-to-noise ratio (SNR) without increased saturation. As has been previously noted (4,7,8), complex-difference processing of PC data has the advantage of eliminating partial volume effects from voxels that contain both blood and tissue. The complex-difference methods presented in this study are an extension of this concept, where one voxel dimension is extended throughout the sample along the projection direction. While phase-difference methods are also subtractive in nature, they cannot be used to distinguish blood pool and tissue spins within a given voxel with only two flow-encoding steps. Phase-difference methods are thus inappropriate for quantitative flow imaging when the majority of the voxel volume is comprised of tissue, which is certainly the case with the projection technique used in this study. In previous studies, selective excitation of the spins within a target vessel was achieved with RF pulses that limited the excitation in multiple dimensions within cylindrical shapes (12). Such methods are not appropriate for volumetric flow imaging under transient conditions because of the need for high-precision localization in three dimensions, which must vary over time to track motion from breathing, exercise, or inflatable cuffs.
Two potential pitfalls of the present real-time complex-difference methods are 1) underestimation of flow, due to saturation of the blood signal or intravoxel dephasing; and 2) contamination of the complex-difference signal from unwanted background spins, including those from overlapping vessels. The pulse sequence parameters determine the degree of underestimation or contamination for given flow conditions and a given sample. For example, shorter TRs and larger flip angles have the advantage of increased saturation of the unwanted background signal, but the choice of their values must be balanced against potential saturation of the targeted blood signal. In this study a TR of 30 ms was used to provide adequate temporal resolution of arterial blood flow patterns, with minor blood saturation effects when used in combination with a flip angle of 30° and 2.0-mm slice thickness. The large Venc used for the complex-difference studies, to approximate linearity between velocity and complex-difference signal intensity, also ensures that there is insignificant intravoxel dephasing from the motion-encoding gradients. Carefully selected flow-encoding gradient shapes ensure that eddy current, Maxwell term, and gradient-area mismatch effects (all of which can result in incomplete subtraction of stationary background signals) are minimized. Finally, it was found that a contrast RF pulse phase minimizes the contribution from the stationary background tissue.
The small systematic underestimation of flow rates with the complex-difference method, as compared to conventional PC-MRI, was similar for flow in the popliteal artery and aorta, which indicates that the error scales approximately with the flow rate. The signal from venous or arterial flow was selectively eliminated, when desired, with a slice-selective saturation pulse applied every TR. Contamination from overlapping arteries can be avoided by appropriate selection of the projection direction, which can be selected based on the spin-density calibration image. Because the major arteries and veins near the heart have complex paths and a large number of overlapping vessels, the single projection direction complex-difference method most likely is not appropriate for measuring blood flow rates in these vessels. In the future, a real-time complex-difference flow imaging method that incorporates multiple projections, acquired with efficient methods such as echotrain or spiral readouts, will allow more complex geometries to be studied. The relatively long TRs used to minimize saturation effects (≥30 ms) will provide sufficient time for the acquisition of several lines of k-space or long spiral readouts.
Footnotes
This article is a US Government work and, as such, is in the public domain in the United States of America.
REFERENCES
- 1.Nayler GL, Firmin DN, Longmore DB. Blood flow imaging by cine magnetic resonance. J Comput Assist Tomogr. 1986;10:715–722. doi: 10.1097/00004728-198609000-00001. [DOI] [PubMed] [Google Scholar]
- 2.Pelc NJ, Herfkens RJ, Shimakawa A, Enzmann DR. Phase contrast cine magnetic resonance imaging. Magn Reson Q. 1991;7:229–254. [PubMed] [Google Scholar]
- 3.Meuli RA, Wedeen VJ, Geller SC, Edelman RR, Frank LR, Brady TJ, Rosen BR. MR gated subtraction angiography: evaluation of lower extremities. Radiology. 1986;159:411–418. doi: 10.1148/radiology.159.2.3961174. [DOI] [PubMed] [Google Scholar]
- 4.Dumoulin CL, Hart HR., Jr Magnetic resonance angiography. Radiology. 1986;161:717–720. doi: 10.1148/radiology.161.3.3786721. [DOI] [PubMed] [Google Scholar]
- 5.Wedeen VJ, Rosen BR, Buxton R, Brady TJ. Projective MRI angiography and quantitative flow-volume densitometry. Magn Reson Med. 1986;3:226–241. doi: 10.1002/mrm.1910030206. [DOI] [PubMed] [Google Scholar]
- 6.Korosec FR, Mistretta CA, Turski PA. ECG-optimized phase contrast line-scanned MR angiography. Magn Reson Med. 1992;24:221–235. doi: 10.1002/mrm.1910240204. [DOI] [PubMed] [Google Scholar]
- 7.Bernstein MA, Ikezaki Y. Comparison of phase-difference and complex-difference processing in phase-contrast MR angiography. J Magn Reson Imaging. 1991;1:725–729. doi: 10.1002/jmri.1880010620. [DOI] [PubMed] [Google Scholar]
- 8.Polzin JA, Alley MT, Korosec FR, Grist TM, Wang Y, Mistretta CA. A complex-difference phase-contrast technique for measurement of volume flow rates. J Magn Reson Imaging. 1995;5:129–137. doi: 10.1002/jmri.1880050202. [DOI] [PubMed] [Google Scholar]
- 9.MacFall JR, Pelc NJ, Vavrek RM. Correction of spatially dependent phase shifts for partial Fourier imaging. Magn Reson Imaging. 1988;6:143–155. doi: 10.1016/0730-725x(88)90444-4. [DOI] [PubMed] [Google Scholar]
- 10.Nygren AT, Greitz D, Kaijser L. Skeletal muscle perfusion during exercise using Gd-DTPA bolus detection. J Cardiovasc Magn Reson. 2000;2:263–270. doi: 10.3109/10976640009148690. [DOI] [PubMed] [Google Scholar]
- 11.Raynaud JS, Duteil S, Vaughan JT, Hennel F, Wary C, Leroy-Willig A, Carlier PG. Determination of skeletal muscle perfusion using arterial spin labeling NMRI: validation by comparison with venous occlusion plethysmography. Magn Reson Med. 2001;46:305–311. doi: 10.1002/mrm.1192. [DOI] [PubMed] [Google Scholar]
- 12.Hardy CJ, Bolster BD, McVeigh ER, Adams WJ, Zerhouni EA. A one-dimensional velocity technique for NMR measurement of aortic distensibility. Magn Reson Med. 1994;31:513–520. doi: 10.1002/mrm.1910310507. [DOI] [PMC free article] [PubMed] [Google Scholar]


