Abstract
Receiver coil response is a major cause of nonuniformities in magnetic resonance images. The spatial dependence of the sensitivity and phase of single-saddle receiver coils has been investigated quantitatively by calculating the H1 field and comparing the results with measurements of a uniform phantom. Agreement between the measurements and calculations is excellent. A method is developed which corrects for both the nonuniform sensitivity and the phase shifts introduced by receiver coils.
I. Introduction
The quality of magnetic resonance (MR) images is highly dependent upon the coil used to receive the radio frequency (rf) signal emitted from the patient. Investigation of coil performance for various clinical tasks at specific field strengths has lead to some novel designs1-6 and further analysis of existing designs.7-10
The coil designer is faced with a number of constraints. The receiver coil must have a high quality factor Q to produce a good signal-to-noise ratio (SNR), yet its tuning should preferably remain insensitive to patient loading. The geometry of the coil should maximize the H1 field in the patient while minimizing the electric field.11 If separate coils are used for transmission and reception, the directions of the respective fields are best kept orthogonal in order to avoid exciting the receiver coil with the transmitter field. Coil conductors are usually kept short such that the coil operates well below self-resonance. Obviously the coil must be designed to fit patients of various sizes comfortably. With such a list of constraints it is not surprising that coils seldom achieve a uniform sensitivity over the entire field being imaged. Two examples of coil geometry exhibiting nonuniform sensitivity are the single-saddle coil and the circular surface coil.
Nonuniform sensitivity presents a problem in image interpretation because the signal intensity of a tissue can depend on the tissue’s location. Some coils also introduce a spatial dependence into the phase of the signal received. This interferes with phase-sensitive reconstruction for inversion spinecho (ISE) sequences—a technique recommended for optimal contrast-to-noise ration (CNR) in some situations.12-16 Furthermore, some methods of flow imaging17,18 and chemical shift imaging19 require measurement of absolute phase angles and are thus susceptible to errors introduced by spatially dependent phase shifts from the coil. Other methods compensate for this effect.20 Although nonuniform sensitivity is generally a problem in MR imaging, it can be exploited to isolate the signal from specific regions of a sample using specially designed rf pulses.21-24
In this paper, both the nonuniform sensitivity and the spatial dependence of the phase in MRI are investigated theoretically for a single-saddle coil at 6.25 MHz. The calculations are confirmed with experimental measurements of a large phantom, and the results are used with a correction algorithm to improve the performance of a 0.15-T MR imager. At this field strength, there is negligible phase shift from rf penetration; at higher field strengths these effects should also be taken into account. It is assumed throughout that the orientation of the receiver coil is well defined.
II. Theory
For two-dimensional spin-warp imaging, neglecting slice selection, the time domain signal F(n, t), for each phase encoding gradient n and time t measured from the center of each echo, is given by25,26
| (1) |
where k(x) = γGx, x, k(y) = γΔGytyy, R is the region containing the sample, γ is the gyromagnetic ratio for protons (42.58 MHz/T), Gx is the frequency encoding gradient, ΔGy is the incremental strength of the phase encoding gradient, and ty is the duration of the phase encoding gradient. The two-dimensional Fourier transform of the time domain signal F(n, t) yields Fourier coefficients I(x, y) as the image. I(x, y) is a set of vectors in the complex plane which may be written as
| (2) |
The function r(x, y) is the magnitude of the image vector. It is proportional to the transverse magnetization of the sample and the sensitivity of the receiver coil at the point (x, y) in the imaging plane. The transverse magnetization is affected by many factors including slice selection,27 rf pulse parameters, T1, T2, and the density of protons.12-16 The phase term can be separated into two factors for the purposes of this paper and Eq. (2) can be rewritten as
| (3) |
where φi (x, y) is the intrinsic phase, determined by the sign of Mz at the time of the 90° pulse, and φe (x, y) is the “phase error.” By definition, φi can only be 0° or 180°. For a simple spin-echo (SE) technique, Mz is always positive and thus φi = 0° at all points in the image. For an ISE sequence, Mz may be positive or negative at the time of the 90° pulse and therefore φi may be 0° or 180°. The phase error φe comes from a phase modulation of the signal which is independent of time, but dependent on the spatial coordinates. Potential contributions to φe (x, y) are complex passband rf receiver filters, noncentered echoes, poor gradient compensation, static field inhomogeneities, and phase shifts from the rf receiver coil. The first four factors are described briefly in Appendix A. In this paper, we consider only the phase shifts introduced by the rf coils. The phase error φe will shift the image vectors away from the real axis and disperse them throughout the complex plane. If, as is usually done, the image is displayed as r(x, y) through magnitude reconstruction, the phase is ignored at the cost of losing the intrinsic phase, φi (x, y).
A current in a coil generates a three-dimensional magnetic field which can be projected on an arbitrary x-y plane producing a two-dimensional vector field,
| (4) |
where α(x, y) is the phase angle in the x-y plane. We can arbitrarily set α(0, 0) = 0° and measure all other phases relative to this; i.e., α(x, y). is the angle between the two vectors H1(x, y) and H1(0, 0). This angle is independent of the direction of current flow. Figure 1 shows this relation schematically.
Fig. 1.
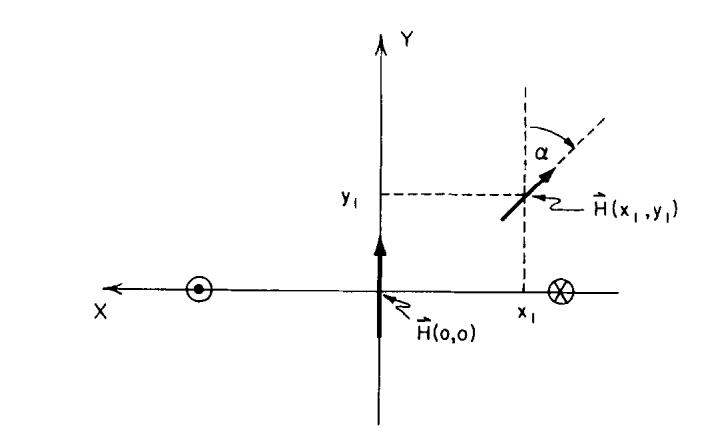
Two H1 vectors in the vector field produced by a current through a single-saddle coil. The straight elements of the coil puncture the plane at the positions marked by the circles. The direction of the current flow is shown.
When excited with an H1 field, the relative phases of the transverse magnetization vectors M(x, y) will be given by α(x, y). If the same coil is used for transmission and reception, the principle of reciprocity implies that these magnetization vectors will induce an “in-phase” current in the coil.28,29 When separate transmitter and receiver coils are used, the current induced in the receiver coil by the magnetization vectors M(x, y) will be phase shifted by an amount,
| (5) |
where αt is the relative phase of the transmitter coil field, and αr is the relative phase of the receiver coil field. This phase shift αc is the contribution of the coils to the phase error φe (x, y). Note that if the transmitter coil does not introduce a phase dispersion [i.e., αt (x, y) = 0°, for all x, y], then αc (x, y) = - αr (x, y). This will be the case when a large transmitter coil with a uniform H1 field is used in conjunction with a smaller receiver coil such as a single-saddle or circular surface coil.
The geometry of the coil configuration used for this investigation is shown in Fig. 2. The large double-saddle coil shown in Fig. 2(a) was used for transmission. The H1 field of this type of coil has been derived analytically by Hanssum7,8 and Hoult,9 and they have examined its uniformity with respect to its dimensions. The dimensions of the coil used were lt = 74 cm, rt = 31 cm, φt = 115°, close to the optimum for a double-saddle coil.7,9 The dimensions of the coil used for reception in this experiment were l = 19.9 cm, ra = 12.5 cm, φa = 80°, rc = 4.8 cm, and φc = 90°, as shown in Fig. 2(b). Within the volume of this receiver coil, the transmitter coil H1 field can be considered to be uniform. Although the coils described are those used on the 0.15-T Technicare imager, they are only an example.
Fig. 2.
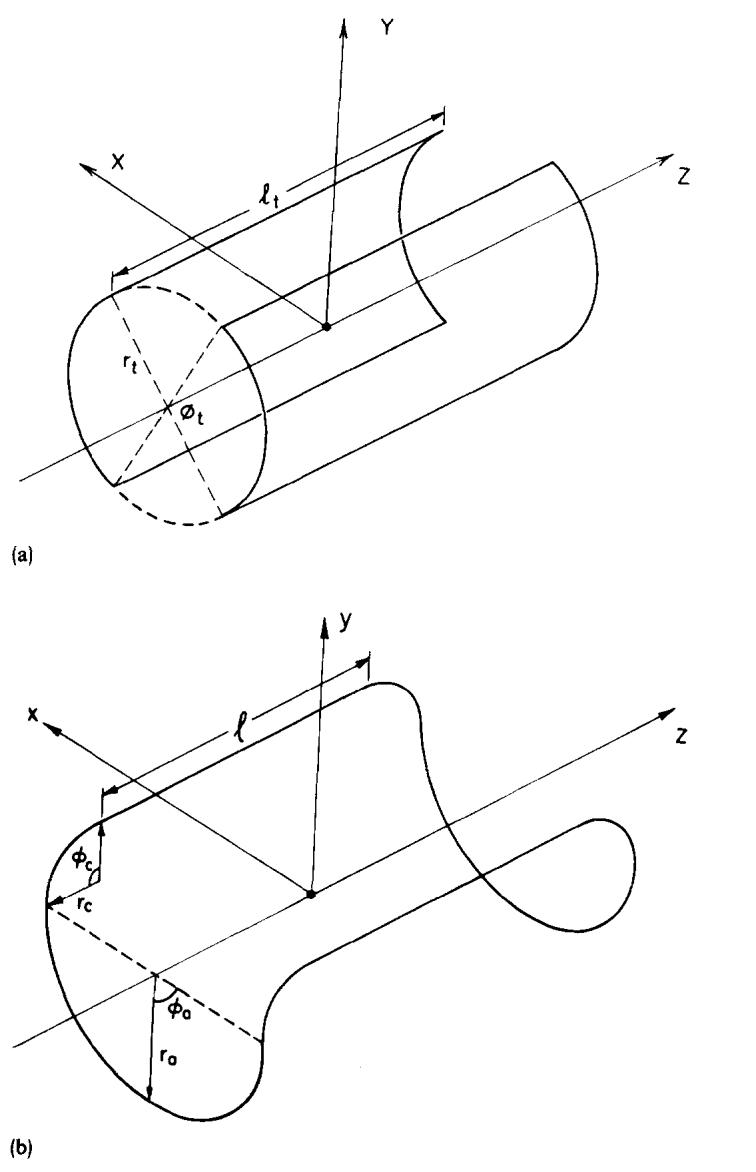
Coil configuration used as the example for this paper. (a) The geometry of the double-saddle transmitter coil. (b) A schematic of a single-saddle receiver coil.
The H1 field of the single-saddle coil was calculated numerically using the Biot-Savart law in the three central orthogonal planes (transverse, sagittal, and coronal) with a spatial resolution of 1 mm, similar to the resolution in an MR image. The corner joining each straight element to the end arcs is a significant fraction of the coil length; therefore it was included in the calculation. A computer program calculated H1 in the defined plane using the IMSL30 integration routine DCADRE. The program ran for approximately 1 h of CPU time on a VAX 11/780 (Digital Equipment Corp.). Figure 3 shows contour plots of |H1(x, y)| and αr(x, y) derived from the calculation for the central transverse plane of the single-saddle coil shown in Fig. 2(b). Notice in Fig. 3(a) that there exists a threefold difference in the sensitivity of the coil over the useful imaging region. This difference becomes greater when the length of the straight elements is increased, such as in a body coil. In Fig. 3(b), the central value of α = 0 is a saddle point; the straight elements of the coil are at the points of convergence of the isophase contours marked with black dots. The 0° phase contour between the two straight elements of the coil deviates slightly from the horizontal due to contributions from the end arcs and corners.
Fig. 3.
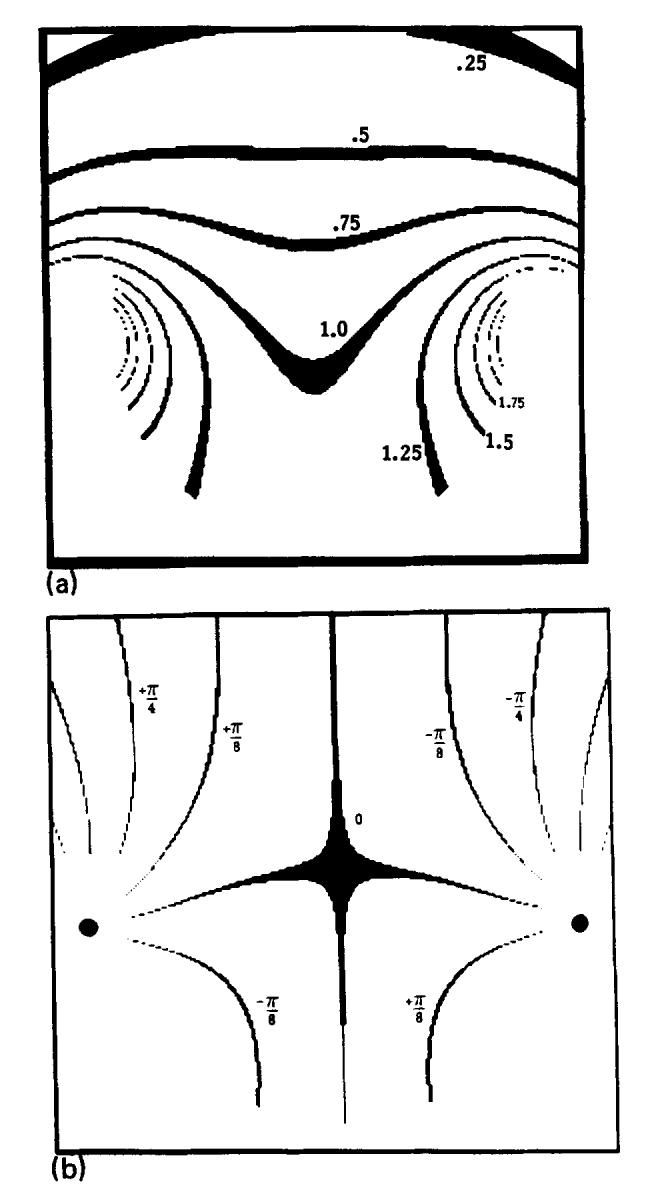
Two contour plots which characterize the H1 field of the receiver coil in the z = 0 plane, as shown in Fig. 2(b). (a) A contour plot of |H1(x, y)|. The contour lines are separated by units of 0.25 of the central amplitude which is set to 1.0. The contour widths are 0.5% of the contour value. (b) A contour plot of the phase of the H1 field, α(x, y). The plots have been multiplied by a mask outlining the phantom used in the experiment.
III. Experimental investigation
A. Method
It is not difficult to measure either the sensitivity or the distribution of phases φ(x, y) for a given MR imaging system. The sensitivity is simply proportional to the magnitude of the image vectors of a uniform phantom. To measure φ(x, y), quadrature detection28,31 is used, and a “real” image Ir(x, y) and an “imaginary” image Ii(x, y) are constructed. The phase is calculated as
| (6) |
A phantom was constructed that filled the entire transverse imaging plane of the single-saddle head coil. The phantom had uniform thickness (6 cm) and was filled with a CuSO4 solution which had T1 of ∼90 ms and T2 of ∼50 ms.
The pulse sequence shown in Fig. 4 was designed to isolate the phase error introduced by the receiver coil. It is an SE sequence, with both the 90° pulse and 180° pulse being nonselective. No z gradient is applied because the imaging slice is defined by the thickness of the phantom and thus phase anomalies introduced through slice selection and z-gradient-induced eddy currents are avoided. The 180° and 90° pulses were tuned and τ1 and τ2 (see Fig. 4) were set equal, to within one sampling unit, to eliminate any contribution due to field inhomogeneity. The global phase of the quadrature detector was shifted such that the central column of the image was real and positive, and the length of the first Gx pulse was adjusted to compensate for linear phase shifts (see Appendix A).
Fig. 4.
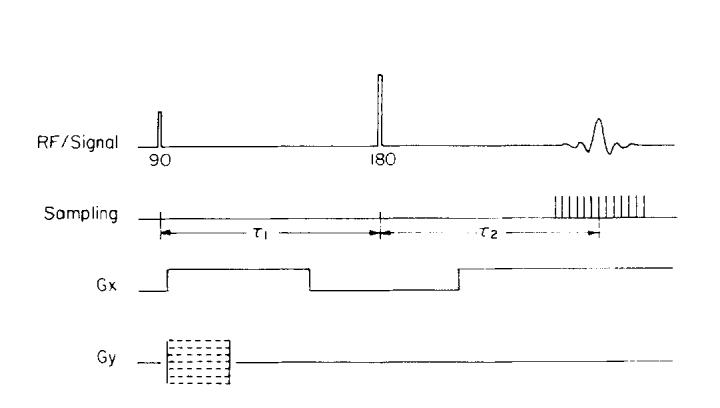
Pulse sequence used to collect data for phase images.
B. Results
A contour plot of measured r(x, y) is shown in Fig. 5(a) for the receiver coil of Fig. 2(b). The pattern agrees well with that in Fig. 3(a) and remains similar for z = ± 5 cm excursions from the center of the single-saddle receiver coil.
Fig. 5.
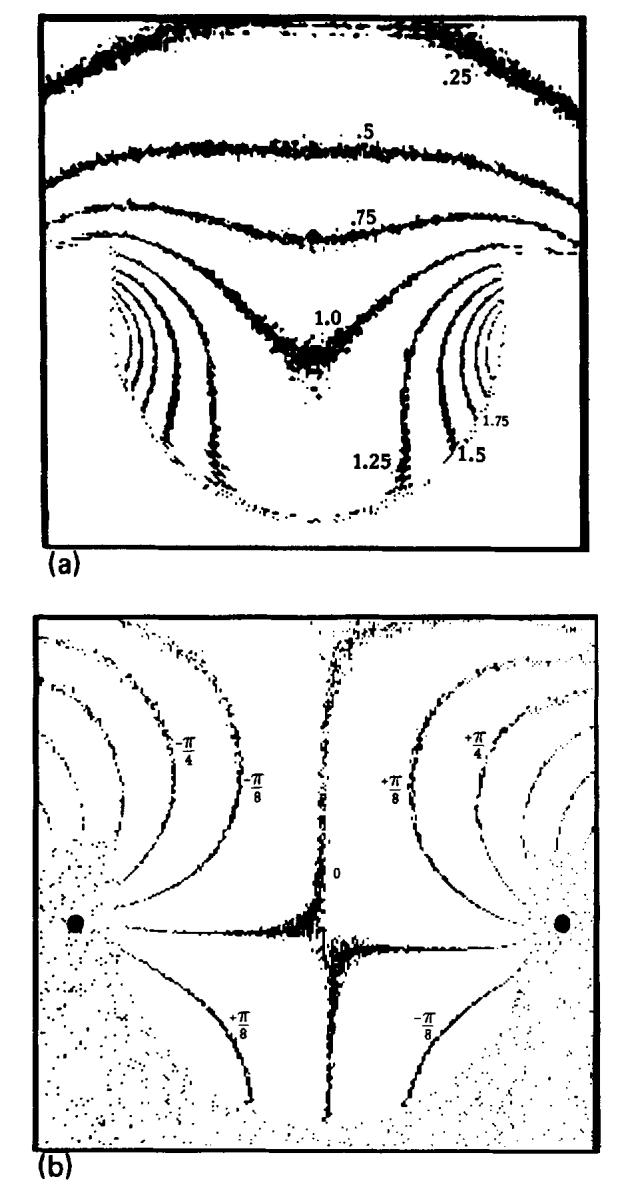
Measured coil sensitivity and phase. (a) A contour plot of the measured relative magnitudes of image vectors r(x, y) for a uniform phantom. (b) An isophase contour plot of the measured phase φ(x, y).
Figure 5(b) shows φ(x, y) measured in the transverse plane displayed with the same contours as Fig 3(b). In Fig. 5(b), the B0 field is pointing into the page and the magnetic dipoles are precessing counterclockwise. The magnetization vectors themselves all precess in phase at the center of the echo, assuming a uniform transmitter field. φ(x, y) at each position is actually the phase of the emf induced from that voxel. The phase varies most rapidly in the regions near the conductors of the coil. Comparing this plot with αr(x, y) shown in Fig. 3(b), it is clear that the measured phase is very close to - αr(x, y), indicating that almost all of the phase error is due to the receiver coil.
IV. Application to imaging
A. Sensitivity correction
Ideally, the sensitivity of a coil should be uniform throughout the imaging region. Usually this is not the case, but as shown in the previous section, the spatial dependence of the sensitivity can be both calculated and measured. This knowledge can be used to restore uniformity in images. Uniformity corrections have been suggested by Axel32 and are well known in other areas of medical imaging such as nuclear medicine.33 Uniformity correction methods are particularly important for single-saddle receiver coils whose sensitivity decreases approximately as the inverse of distance from the straight elements. Development of a correction matrix is facilitated by the fact that the spatial frequencies of the sensitivity function are very low compared with the spatial frequencies of a clinical MR image. A correction matrix can be constructed from a low-resolution estimate of the sensitivity, and interpolation techniques can be used to calculate correction factors for individual pixels.
Noise in MR images is spatially invariant and has a flat power spectrum34; thus renormalization by multiplication with a correction matrix to simulate uniform sensitivity changes the appearance of the noise in an image. After the renormalization, regions of low sensitivity have a relatively higher noise level than regions of high sensitivity. Although the magnitude of the noise varies with position, there is little reduction in SNR, provided the noise in the correction matrix is negligible. For the following example, this was achieved by using a heavily smoothed image of a uniform phantom to derive correction factors for each pixel.
The clinical importance of uniformity corrections is clearly demonstrated by the SE image of a transverse plane through the mediastinum shown in Fig. 6. The patient has a bronchogenic carcinoma in the left lung which is easily detectable. Determination of mediastinal extension of disease is made difficult by the nonuniform sensitivity which reduces contrast between the tumor mass and pericardial fat. After renormalization, this contrast is greatly improved, and the signal from fat has the same intensity throughout the corrected image, making it easier to distinguish pericardial fat from tumor.
Fig. 6.
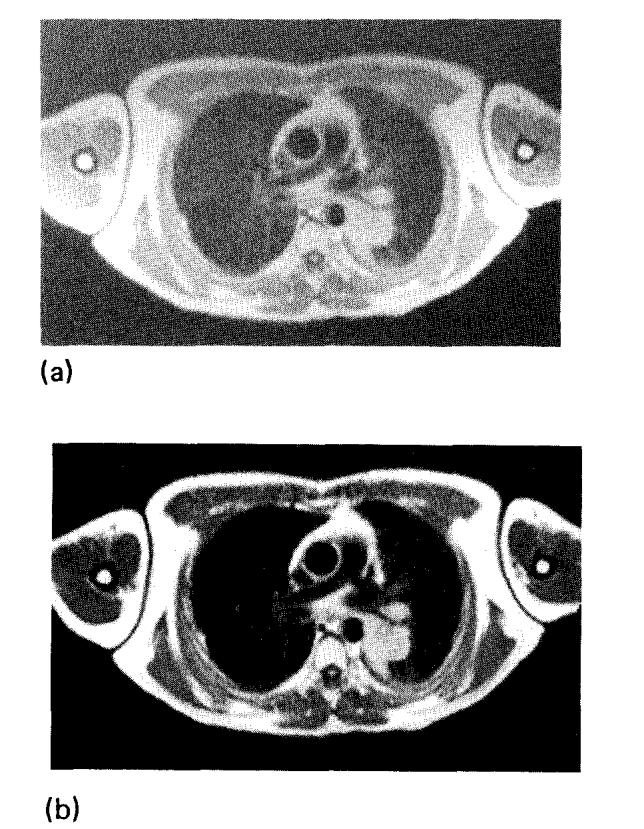
(a) SE image (TR = 1200, TE = 30) of a transverse plane through the mediastinum. (b) The same image after correction for the coil sensitivity. The window was set to the same value for both images.
B. Phase correction
The detrimental effects of phase errors described above can be avoided by displaying magnitude reconstructed images. However, retention of the phase term of the signal from an ISE pulse sequence increases the dynamic range of the image and can be used to optimize the contrast between two tissues.13-15 Simple phase sensitive reconstruction of ISE data is susceptible to distortions introduced by the phase error. Knowledge of the phase error can be used, however, to eliminate artifacts in images derived from phase-sensitive reconstruction of ISE data.
For an ISE sequence, the phase-sensitive image can have both positive and negative pixel values and may show tissue contrast improved over that of a magnitude image. An example of this contrast improvement is shown in Figs. 7(a) and 7(b) where the contrast between white matter (WM) and gray matter (GM) is clearly superior in the phase sensitive image. This inferiority of the magnitude image is due to the signal inversion of the GM pixels. The magnitude image also shows artifactual boundaries35 in the regions of transition from WM to GM. The nonuniformity due to the phase error introduced by the receiver coil is revealed by the substantial signal power in the imaginary image [Fig. 7(c)]. The phase error in this image is demonstrated well by plotting image pixels in the complex plane, as shown in Fig. 8(a). If there were no phase errors, the imaginary image would be merely noise, and all of the vectors in Fig. 8(a) would lie along the real axis. The nonuniformity is most severe in regions of rapid phase change, which for the single-saddle coil, are close to the straight elements [see Fig. 3(b)]. The information in the imaginary image should be transferred to the real image to improve the uniformity and contrast in the real image.
Fig. 7.

Transverse images of a 1-cm slice through the head obtained with an ISE sequence (TR = 2000 ms, TI = 240 ms, TE = 30 ms). (a) Using magnitude reconstruction, phase information is lost and regions of long TI, such as CSF and GM, have inverted, positive signal intensity. (b) The “real” component of the complex image. This image is phase sensitive. (c) The “imaginary” image is the projection of the image vectors onto the axis orthogonal to that in (b). The window for (b) is 20 times the background root-mean-square deviation, the window for (a) and (c) is 10 times the background rms deviation of (b).
Fig. 8.
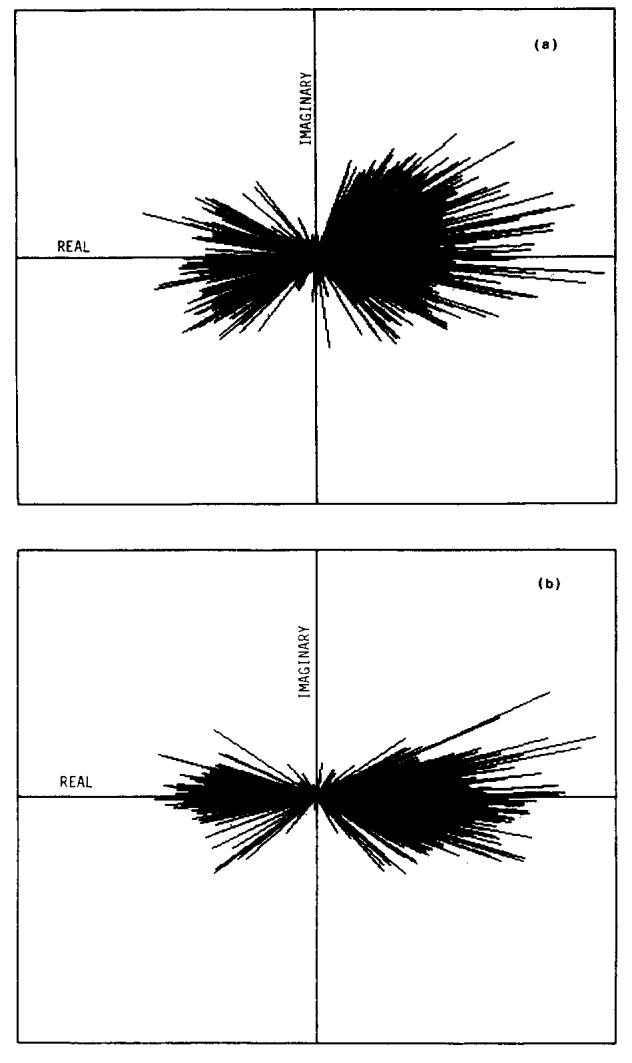
(a) Plot of image pixels in the complex plane. The pixels shown are from the left-half of the head in Fig. 7 and exclude background. (b) The same pixels as in (a), after subtracting the measured phase errors.
The first step in correcting the phase is to subtract the previously calculated or measured phase error from each pixel. Some residual phase errors remain, however, due to inaccuracies in the correction matrix or flow and are evident in the plot of image pixels after this gross correction [Fig. 8(b)]. By removing these residual phase errors a phase sensitive image with maximum available contrast between the positive and negative pixels can be achieved. The magnitude of each vector must be displayed with the correct sign, and care must be taken not to increase the low signal noise by determining incorrectly the sign of low-magnitude pixels. (see Appendix B).
Pixels whose magnitude is near zero (i.e., comparable to background or statistical noise) do not carry significant phase information, because the noise contribution dominates the phase angles of these pixels. For this reason, the mean value of a group of low-magnitude pixels is more precisely estimated by projecting their magnitudes onto the real axis. However, at higher magnitudes, the pixels carry phase information and, if residual phase errors exist, the contrast between positive and negative pixels can be improved by rotating these vectors onto the real axis. The problem is to decide for each pixel whether to project or rotate it onto the real axis. In order to make this decision, some a priori information can be used: (a) the probability density function describing the distribution of these low-magnitude pixels is Rayleigh36,37; (b) the σ value of this distribution can be measured from the image background.
The solid curve in Fig. 9(a) is a histogram of pixel magnitudes found in the head image shown in Fig. 7. A Rayleigh distribution with the measured σ value has been fitted to the low-magnitude pixels and is shown as a dashed curve. If the Rayleigh curve is R(m) and the solid curve P(m), we can use the ratio R(m)/P(m) to make the decision to rotate or project the pixel. If R(m)/P(m) ≃ 1, then the pixel of magnitude m is consistent with being part of the Rayleigh distribution and would therefore be projected. If R(m)/P(m) is close to zero, the pixel has a high magnitude and should be rotated onto the real axis. A suitable transition point between projecting and rotating is R(m)/P(m) = 0.5, shown by the arrow in Fig. 9(a).
Fig. 9.
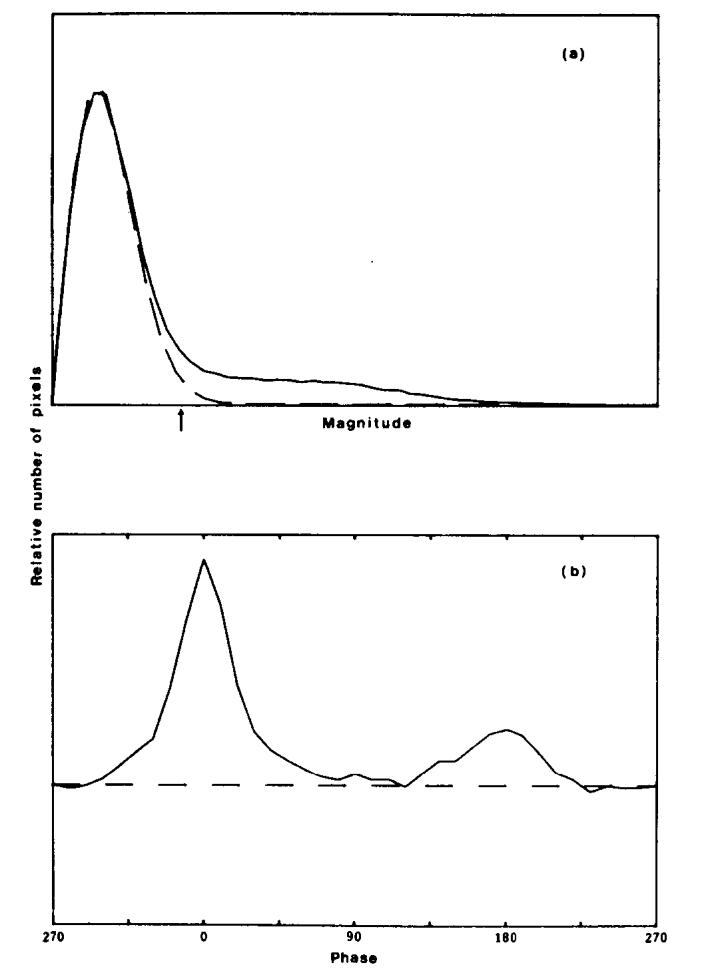
Histograms of the magnitude and phase of image pixels from the image shown in Fig. 7, after subtraction of the estimated phase error. (a) The distribution of the pixel magnitudes is the solid curve P(m); the dashed line shows a Rayleigh distribution R(m). The arrow marks the m value where R(m)/P(m) = 0.5. (b) The distribution of phase angles found in the image.
In addition, a strategy was developed to deal with those few pixels of large magnitude remaining close to the imaginary axis. These pixels were rotated unless the probability of incorrect sign determination due to random noise exceeded 0.01, in which case they were projected.
The validity of this approach is reinforced by the histogram of phase angles in Fig. 9(b). This histogram was derived from the image in Fig. 7 after the initial phase correction was applied. The area under the dashed line represents the total number of pixels below the transition point R(m)/P(m) = 0.5. The distribution of phase angles above the dashed line consists of two broad peaks at 0° (positive real) and 180° (negative real), even after the initial correction. The distribution of phase angles below the line is uniform, as expected.
The value of this processing algorithm is shown in Fig. 10. Figure 10(a) shows a phase sensitive image in which all of the pixels were rotated onto the real axis. The background rms deviation is increased by a factor of and the transition between positive and negative regions is jagged. The effect of the processing algorithm is shown in Figs. 10(b) and 10(c). In Fig. 10(b) there is a reduction in the background noise found in Fig. 10(a), and smoother zero crossings. The “bad pixels” that pepper Fig. 10(a) have been eliminated, and the image is aesthetically more pleasing. The WM/GM CNR in the top left region of the brain has been increased by as much as 1.6 times that of the original real image [Fig. 7(b)]. Figure 10(c) shows that the residual information remaining in the imaginary image is small; this indicates that we are close to the maximum available WM/GM CNR derivable from this pair of real and imaginary images. No sensitivity correction was used in order to isolate the improvement available from phase correction.
Fig. 10.

Same image as shown in Fig. 7 with an attempt to display the full magnitude of the image vectors with the correct sign. (a) A simple algorithm which uses the sign of the real part of the image vector after phase correction to determine the sign of the displayed pixel. Note the increased low-signal noise, jagged boundaries, and anaomalous pixels. (b) The phase sensitive image after the image processing described in the text. (c) The residual signal remaining in the imaginary image after this processing. The window for (a) and (b) is the same as in Fig. 7(b); the window for (c) is the same as in Fig. 7(c).
V. Conclusions
The relationship between the H1 field of the receiver coil used for MR imaging and the spatial dependence of the sensitivity and phase in the image has been investigated at 0.15 T. Calculations of the H1 field for the specific example of a single-saddle coil agree closely with measurements of pixel intensity and phase in an image of a uniform phantom. The change in sensitivity with respect to position is a function of the geometry of the coil and the proximity of the sample to the coil conductors. The change in the phase with respect to position is due to the lack of reciprocity when separate transmitter and receiver coils are used.
Nonuniform sensitivity and phase errors can be corrected to a large degree with simple image processing. Nonuniform sensitivity can be overcome using a correction matrix derived from the image of a uniform phantom. Similarly, the phase error due to the receiver coil can be measured and subsequently subtracted from the image before applying an algorithm which displays the full magnitude of the image vectors with the correct sign in ISE images. Both of these corrections can improve the quality of clinical MR images.
Acknowledgments
This research was supported by the Medical Research Council, the National Cancer Institute of Canada, the Ontario Cancer Treatment and Research Foundation, and the Ontario Ministry of Health. Personal support for E. R. McVeigh was received from the Ontario Ministry of Colleges and Universities.
Appendix a: causes of phase shifts in magnetic resonance imaging
Several factors can contribute independently to phase shifts in MR imaging. In addition to receiver coil geometry, discussed in the text above, the following independent factors can also be important.
1. Radio frequency filtering
A low-pass rf filter is used to eliminate high frequencies from the demodulated signal before it is digitized. This filter can add a frequency-dependent phase shift to the signal due to the complex nature of the transfer function of the filter.38 The amount of phase shift depends on the location of the filter poles in frequency space with respect to the image edge; it also depends on the order of the poles. For a filter with a bandwidth that is at least twice the image bandwidth, it is safe to approximate the phase shift as a linear function of the frequency. This shift can then be offset by other factors which introduce linear phase shifts described in this Appendix.
2. Noncentered echo
For an ideal imager, the echo sampled by the quadrature detector is Hermitian, i.e., the real part is symmetric about its center and the imaginary part is antisymmetric.39 If the center of the sampling comb coincides with the center of the echo, the resulting image I(x, y) will be real. However, if there is a shift in time of the center of the sampling comb with respect to the center of the echo, a linear phase shift will be introduced into the transform. Specifically, for a time shift of sΔt (Δt is the sampling interval, s is a real number), there will be a total shift of 2πs across the image in the frequency encoding direction.
3. Readout compensation gradients
The readout gradient applied to frequency encode columns of magnetization vectors also causes a linear phase shift across the sample. This phase shift is usually eliminated by a compensation gradient before the 180° pulse. In Fig. 4, the compensation gradient is the first pulse on the Gx line. The area under the compensation pulse should equal the area between the beginning of the readout Gx pulse and the center of the echo. If the two Gx pulses are of unequal area there will be a linear phase shift across the sample at the time TE. Fine adjustment of the compensation gradient is usually done empirically to overcome nonzero rise and fall times of the gradient pulses.
4. Static field inhomogeneities and chemical shifts
The spin-echo technique was developed40 to reduce signal decay from dephasing due to an inhomogeneous static field. If the effective center of the 180° pulse occurs exactly midway between the 90° pulse and the center of the sampling comb, (i.e., τ1 = τ2 in Fig. 4) static field inhomogeneities should have no effect on the signal amplitude at the echo center, because the spins will all be in phase. However, if τ2 is not equal to τ1, a phase shift is introduced which is proportional to the product of the field inhomogeneity or chemical shift and the time difference τ1 - τ2. Specifically,
| (A1) |
This phase shift has been utilized by Dixon41 to form chemical shift images, and by Margosian, et al.42 to map the inhomogeneity ΔB0(x, y). If the sampling comb position cannot be adjusted with accuracy better than one sampling interval Δt (i.e., 0≤|τ1 - τ2| < Δt), a phase error on the order of Δφ(x, y) = γΔB0(x, y) Δt is introduced. On our system this was a major source of residual phase error and required special attention.
We were able to fine-tune small, constant field gradients to minimize the first-order field inhomogeneities. The residual inhomogeneity was mapped by subtracting a phase image with a sampling offset of 10Δt from a phase image with a sampling offset of - 10Δt. This yields an image of ΔB0, two examples of which are shown in Fig. 11.
Fig. 11.
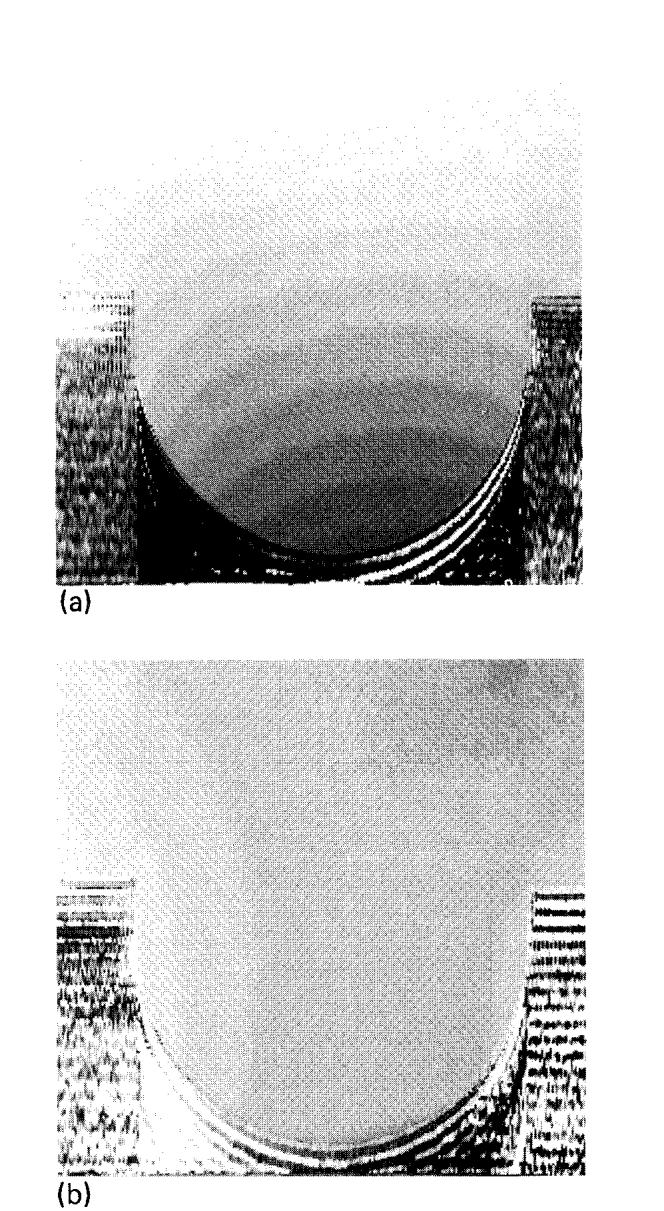
Magnetic field inhomogeneity images constructed from phase differences. Each step in the gray scale represents ∼4 ppm. (a) Before initial first-order corrections. (b) After first-order corrections in the vertical direction.
Appendix b: increase in background noise from simple sign determination
The noise in a magnitude image follows a Rayleigh probability distribution given by
| (B1) |
where m is the magnitude of the pixel, and σ is the rms deviation of the noise in the real or imaginary image.36,37 If the complex plane is split into two halves and the magnitude of each pixel is displayed as positive or negative, depending upon which half the vector is in, the noise will be given by
| (B2) |
This is a Rayleigh distribution reduced in height by a factor of 2 and reflected about m = 0. The variance is given by
| (B3) |
Thus the background rms deviation increases by a factor of if the magnitude of the image vectors is simply displayed on the positive and negative real axes. This result was confirmed experimentally by measuring the background noise of the image shown in Fig. 10(a).
References
- 1.Bydder GM, Butsen PC, Harman RR, Gilderdale DJ, Young IR. J. Comput. Assist. Tomogr. 1985;9:413. doi: 10.1097/00004728-198503000-00042. [DOI] [PubMed] [Google Scholar]
- 2.Glover GH, Hayes CE, Pelc NJ, Edelstein WA, Mueller OM, Hart HR, Hardy CJ, O’Donnell M, Barber WD. J. Magn. Reson. 1985;64:255. [Google Scholar]
- 3.Leroy-Willig A, Darrasse L, Taquin J, Sauzadi M. Magn. Reson. Med. 1985;2:20. doi: 10.1002/mrm.1910020104. [DOI] [PubMed] [Google Scholar]
- 4.Hinshaw WS, Gauss RC. Distributed phase rf coil. European Patent Application, Publ. No. 0047065. 1981
- 5.Hayes CE, Edelstein WA, Schenck JF, Mueller OW, Eash M. 1985; presented at the Soc. Magn. Reson. Med., Fourth Annual Meeting; London. [Google Scholar]
- 6.Shen JF, Lowe IJ. 1985; presented at the Soc. Magn. Reson. Med., Fourth Annual Meeting; London. [Google Scholar]
- 7.Hanssum H. J. Phys. A Gen. Phys. 1983;16:3385. [Google Scholar]
- 8.Hanssum H. J. Phys. D. 1984;17:1. [Google Scholar]
- 9.Hoult DI, Chen CN, Sank VJ. Magn. Reson. Med. 1984;1:339. doi: 10.1002/mrm.1910010305. [DOI] [PubMed] [Google Scholar]
- 10.Ginsberg DM, Melchner MJ. Rev. Sci. Instrum. 1970;41:122. [Google Scholar]
- 11.Hoult DI, Lauterbur PC. J. Magn. Reson. 1979;34:425. [Google Scholar]
- 12.Henrick RE, Nelson TR, Hendee WR. Magn. Reson. Imag. 1984;2:193. doi: 10.1016/0730-725x(84)90005-5. [DOI] [PubMed] [Google Scholar]
- 13.Hendrick RE, Nelson TR, Hendee WR. Magn. Reson. Imag. 1984;2:279. doi: 10.1016/0730-725x(84)90193-0. [DOI] [PubMed] [Google Scholar]
- 14.Wehrli FW, MacFall JR, Glover GH, Grigsby N. Magn. Reson. Imag. 1984;2:3. doi: 10.1016/0730-725x(84)90119-x. [DOI] [PubMed] [Google Scholar]
- 15.Wehrli FW, MacFall JR, Shutts D, Berger R, Herfkens RJ. J. Comput. Assist. Tomogr. 1984;8:369. doi: 10.1097/00004728-198406000-00001. [DOI] [PubMed] [Google Scholar]
- 16.Perman WH, Hilal SK, Simon HE, Maudsley AA. Magn. Reson. Imag. 1984;2:23. doi: 10.1016/0730-725x(84)90121-8. [DOI] [PubMed] [Google Scholar]
- 17.Redpath TW, Norris DG, Jones RA, Hutchinson JMS. Phys. Med. Biol. 1984;29:891. doi: 10.1088/0031-9155/29/7/013. [DOI] [PubMed] [Google Scholar]
- 18.Bryant DJ, Payne JA, Firmin DN, Longmore DB. J. Comput. Assist. Tomogr. 1984;8:588. doi: 10.1097/00004728-198408000-00002. [DOI] [PubMed] [Google Scholar]
- 19.Patrick JL, Haacke EM, Hahn JE. 1985; presented at the Soc. Magn. Reson. Med., Fourth Annual Meeting; London. [Google Scholar]
- 20.O’Donnell M. Med. Phys. 1985;12:59. doi: 10.1118/1.595736. [DOI] [PubMed] [Google Scholar]
- 21.Hoult DI. J. Magn. Reson. 1979;33:189. [Google Scholar]
- 22.Hasse A, Hanicke W, Frahm J. J. Magn. Reson. 1984;56:401. [Google Scholar]
- 23.Bendall MR, Gordon RE. J. Magn. Reson. 1983;53:365. [Google Scholar]
- 24.Evelhoch JL, Crowley MG, Ackerman JJH. J. Magn. Reson. 1984;56:110. [Google Scholar]
- 25.Kumar A, Welti D, Ernst RR. J. Magn. Reson. 1975;18:69. doi: 10.1016/j.jmr.2011.09.019. [DOI] [PubMed] [Google Scholar]
- 26.O’Donnell M, Edelstein WA. Med. Phys. 1985;12:20. doi: 10.1118/1.595732. [DOI] [PubMed] [Google Scholar]
- 27.Rosen BR, Pykett IL, Brady TJ. J. Comput. Assist. Tomogr. 1984;8:195. [PubMed] [Google Scholar]
- 28.Hoult DI, Richards RE. J. Magn. Reson. 1976;24:71. doi: 10.1016/j.jmr.2011.09.018. [DOI] [PubMed] [Google Scholar]
- 29.Feynman RP, Leighton RB, Sands M. The Feynman Lectures on Physics. I. Addison-Wesley; Reading, MA: 1963. pp. 30–37. [Google Scholar]
- 30.IMSL Library. 9th ed. IMSL; Houston, TX: 1982. [Google Scholar]
- 31.Fukushima E, Roeder SBW. Experimental Pulse NMR: A Nuts and Bolts Approach. Addison-Wesley; Reading, MA: 1981. pp. 60–76. [Google Scholar]
- 32.Axel L. J. Comput. Assist. Tomogr. 1984;8:381. doi: 10.1097/00004728-198406000-00002. [DOI] [PubMed] [Google Scholar]
- 33.Muehllehner G, Colsher JG, Stoub EW. J. Nucl. Med. 1980;21:771. [PubMed] [Google Scholar]
- 34.McVeigh ER, Bronskill MJ, Henkelman RM. Med. Phys. 1985;12:586. doi: 10.1118/1.595679. [DOI] [PMC free article] [PubMed] [Google Scholar]
- 35.Hearshaon D, Ellis J, Carson P, Shreuc P, Aisen A. 1984; presented at the Soc. Magn. Reson. Med., Third Annual Meeting; New York. [Google Scholar]
- 36.Edelstein WA, Bottomley PA, Pfeifer LM. Med. Phys. 1984;11:180. doi: 10.1118/1.595484. [DOI] [PubMed] [Google Scholar]
- 37.Henkelman RM. Med. Phys. 1985;12:232. doi: 10.1118/1.595711. [DOI] [PubMed] [Google Scholar]
- 38.Sedra AS, Smith KC. Microelectronic Circuits. Holt, Rinehart, and Winston; New York: 1982. p. 626. [Google Scholar]
- 39.Brigham EO. The Fast Fourier Transform. Prentice-Hall; Englewood Cliffs: 1974. [Google Scholar]
- 40.Carr HY, Purcell EM. Phys. Rev. 1954;94:630. [Google Scholar]
- 41.Dixon WT. Radiology. 1984;153:189. doi: 10.1148/radiology.153.1.6089263. [DOI] [PubMed] [Google Scholar]
- 42.Margosian P, Abart J. 1984; presented at the Soc. Magn. Reson. Med., Third Annual Meeting; New York. [Google Scholar]


