

Abstract
A T1-weighted imaging pulse sequence for contrast-based studies of myocardial perfusion is presented and evaluated in phantoms and in vivo. The sequence is similar to spoiled gradient-recalled echo equences except that nonselective preparatory RF pulses drive magnetization to steady state prior to image acquisition. Steady state is thus obtained in both tissue and blood resulting in a stable, homogeneous, and dark pre-contrast baseline. Tip angles and timings are chosen so that pixel intensity approximates a linear relation to 1/T1. The dynamic range of signal response to contrast agent concentration is greater than that of an inversion-recovery fast low angle shot sequence. The sequence proposed should be useful for myocardial perfusion studies.
Keywords: myocardial perfusion, magnetic resonance imaging, contrast agents
INTRODUCTION
Recent studies have clearly demonstrated the feasibility of characterizing myocardial perfusion by rapidly acquiring T1-weighted magnetic resonance (MR) images after bolus administration of contrast medium (1-5). The ideal imaging pulse sequence for this purpose would produce image intensities that could be directly related to contrast concentrations in both blood and tissue so that quantitative measurements could be made. A less restrictive but equally useful relationship would be image intensities that were linearly related to 1/T1 in both blood and tissue. A linear relationship is attractive because contrast concentrations are known to be linearly related to the change in 1/T1 in in both blood (6) and tissue (7-9), at least under some circumstances (10-12). Thus, a pulse sequence for which myocardial image intensity is linearly related to 1/T1 would allow estimation of contrast agent mean transit times directly from image intensities without actually calculating contrast concentration (4, 13). Furthermore, if a similar linear relationship exists in blood, regional myocardial blood volume can also be estimated (13-15) and combined with the mean transit time to allow quantification of regional myocardial blood flow (4, 13, 15).
To date, most studies of perfusion utilizing the T1 effect of MR contrast agents have employed pulse sequences in which image acquisition is preceded by an inversion pulse, such as an inversion-recovery fast low angle shot (IR-FLASH) (4, 7) and inversion-recovery echo planar imaging (IR-EPI) (3). These sequences have proven their utility in characterizing perfusion, but also reveal that the relationship between image intensity and 1/T1 becomes nonlinear under experimental conditions relevant to the characterization of perfusion, particularly in the blood (3, 12, 16).
In this report we describe a magnetization-driven spoiled gradient-recalled echo pulse sequence (MD-SPGR) for the study of myocardial perfusion. The MD-SPGR sequence differs from IR-FLASH primarily in the method of magnetization preparation before image acquisition. Specifically, the inversion pulse used in IR-FLASH is replaced by a train of preparatory RF pulses designed to allow magnetization to achieve steady state before image acquisition. The MD-SPGR pulse sequence uses segmented k-space data acquisition as described by Atkinson and Edelman (17). Using MD-SPGR, the image data are acquired during a period in which magnetization is at steady state, whereas IR-FLASH sequences are not run at steady state.
We show that with magnetization at steady state, the flip angle used during image acquisition can be increased resulting in a dramatic increase in the range over which image intensity is linearly related to 1/T1 compared to IR-FLASH. In principle, the increase in dynamic range is of significant value in characterizing the blood time-intensity curve for use as the input function for indicator-dilution analysis of myocardial enhancement patterns. We have used the MD-SPGR pulse sequence extensively to characterize myocardial perfusion in humans (18-21) and have found it to be an attractive alternative to IR-FLASH.
THEORY
Neglecting through-plane motion, the signal intensity for a rapid gradient-echo pulse sequence where longitudinal magnetization is at steady state and with perfect spoiling of transverse magnetization is described by Eq. [1] (22):
| [1] |
where Mo is the equilibrium longitudinal magnetization and α is the flip angle. Neglecting the T2* term (i.e., very short TE) and approximating e−TR/T1 with a Taylor series expansion (i.e., e−TR/T1 ≈ 1 − TR/T1), valid when TR ≪ T1), this equation becomes:
| [2] |
There are two important points to be made from Eq. [2]. First, for large flip angles image intensity will approximate a linear relation to 1/T1 (i.e., for α = 90° where cos(90°) = 0). Second, for large flip angles image intensity in an MD-SPGR pulse sequence continues to increase even for T1's as short as 30 ms. By comparison, image intensity in an IR-FLASH pulse sequence plateaus for all T1 less than approximately 200 ms, assuming 400 ms between the “hard” 180° pulse and collection of the center of k-space data (the value of 400 ms is typically chosen to null the myocardial signal). The increased dynamic range of an MD-SPGR sequence over IR-FLASH could be useful in characterizing blood contrast concentrations in myocardial perfusion studies. Sobol et al. (23) report that in water solutions contrast concentration is linearly related to 1/T1 for T1's even shorter than 30 ms.
The validity of Eqs. [1] and [2] requires that longitudinal magnetization is at steady state prior to image acquisition and that transverse magnetization is completely spoiled.
Driving Magnetization to Steady State
For a train of RF pulses, longitudinal magnetization will transiently approach a steady state value. In theory, the approach of longitudinal magnetization to the steady state can be predicted analytically provided that transverse magnetization is perfectly spoiled after each RF pulse. In practice, spoiling of transverse magnetization can be achieved using gradients or RF spoiling algorithms (24, 25). We chose to spoil transverse magnetization using RF spoiling, rather than gradient spoiling, to minimize TR and thus reduce imaging time. Zur et al. (25) have shown that for RF spoiling of transverse magnetization a train of as many as 150 RF pulses are required, depending on the imaging parameters, before spoiling is achieved. Therefore, the analytical predictions of the number of RF pulses required to drive magnetization to steady state, which assume perfect spoiling after each RF pulse, do not apply to pulse sequences which spoil transverse magnetization using RF spoiling. Accordingly, we developed a spoiled gradient-recalled echo pulse sequence in which image acquisition can be preceded by a variable number of preparatory RF pulses. We then determined the number of RF pulses required to drive magnetization to steady state and the range over which image intensity is linearly related to 1/T1 both experimentally and in computer Bloch simulations.
METHODS
MD-SPGR.Pulse Sequence
Figure 1 shows the MD-SPGR pulse sequence. Based on Eqs. [1] and [2], we decided to use a flip angle of 45° (see Discussion, “Sensitivity and Linearity”). Based on simulations and experimental results, we used 60 preparatory RF pulses to drive magnetization to steady state (see Results, “Driving Magnetization to Steady State”). The preparatory RF pulses are identical to the slice excitation RF pulses. The lack of a slice-select gradient (Gz) during the preparatory RF pulses effectively results in “hard” preparatory pulses which avoids problems related to through-plane motion of ventricular blood (see Results, “In Vivo Experiments”). Stimulated echoes are minimized by applying a 1-ms spoiler gradient in the slice direction (Gz) after the 60th preparatory pulse but before the first image phase encode. This spoiler gradient reduces stimulated echoes which may form in regions outside the slice when the pulsing in those regions ends (i.e., after the 60 nonselective preparatory RF pulses).
FIG. 1.

MD-SPGR pulse sequence used for in vivo imaging. Within each cardiac cycle, a series of 60 preparatory RF pulses are used to drive magnetization to steady state, immediately followed by 32 phase encodes for image data acquisition. Each image is acquired over three cardiac cycles (total of 96 phase encodes). To minimize stimulated echoes, a 1-ms spoiler gradient is applied along Gz after the 60th preparatory RF pulse but before the imaging pulses (labeled “1 ms spoiler”). The spoiler gradient is also applied after every sixth preparatory RF pulse (i.e., after RF pulse #6 as shown in Figure, and after RF pulse 12, 18, 24, etc.) for technical reasons relating to memory size limitations on the RF wave form board.
Unless otherwise stated, the imaging parameters used in all simulations and images were chosen to be the same as those used in our clinical studies of myocardial perfusion (18-21): image matrix 256 × 96, NEX = 1, α = 45°, TR = 6.5 ms, TE = 2.3 ms, field of view (FOV) = 36 cm, slice thickness = 10 mm. The asymmetrical sinc RF transmit pulse had a duration of 900 μs. The asymmetric fractional echo had a fraction factor of 160/256. A band-width of ±32 kHz was used, such that readout time was (1/(32,000·2)s)·160 data points = 2.5 ms. The RF phase scheme (24, 25) commenced with the dummy pulses and was continued without interruption during the imaging pulses to ensure that no new transients would be introduced. As with standard General Electric SPGR sequences, RF spoiling was accomplished by adding a constant phase increment to the RF during each cycle. The seed value (24) was 92.3236°.
Simulations
Driving Magnetization to Steady State
We performed a computer Bloch equation simulation of this pulse sequence (26) exactly as it is executed on our scanner. For each phase encode, slice selection is accomplished using an asymmetrical sinc RF pulse with an apodizing Hamming window and trapezoidal gradient, followed by a fractional gradient-recalled echo. The computer simulation assumes that the phase-encoding gradient is fully refocused, and dephasing of transverse magnetization by completion of the readout gradient was modeled as a 2π phase shift across a pixel. The slice profile and RF spoiling algorithm (24) were fully simulated.
The number of RF pulses required to drive magnetization to steady state was determined for a uniform phantom. The effect of flip angle was investigated by repeating data acquisition for α = 5, 10, 20, 30, 45, 60, and 90°. The T1 and T2 used in the simulation were chosen based on the measured values for our phantom (685 and 73 ms, respectively). The phantom was designed specifically to model relaxation times in the heart.
Relationship of Image Intensity to Contrast Concentration
The relationship between image intensity and contrast concentration was simulated for 1/T1's ranging from 0.1 to 50 s−1. This relationship was investigated for flip angles of 5, 10, 20, 30, 45, 60 and 90°.
In Vitro Experiments
Driving Magnetization to Steady State
The uniform phantom was placed in a 1.5T Signa (General Electric) clinical scanner. T1 and T2 of the phantom were determined to be 685 and 73 ms, respectively, using standard methods with the phase encode gradient disabled. The number of RF pulses required to drive magnetization to steady state was determined experimentally by disabling the phase encoding gradient and collecting an echo for each RF pulse. Imaging parameters were identical to those of the Bloch simulations. Signal magnitude for each echo (S) was calculated by taking the one dimensional Fourier transform and summing the magnitudes of the signal within the phantom. To allow comparison of the experimental data to the simulations, all signal values (S) were normalized to those measured using a 90° RF pulse with longitudinal magnetization fully relaxed (So). No corrections for noise (27) were necessary because the signal- to-noise ratio was greater than 10 for all echoes. A plot of S/So as a function of RF pulse number allowed us to determine the number of RF pulses required to achieve steady state.
Relationship of Image Intensity to Contrast Concentration
The MD-SPGR sequence was used to image test tubes filled with saline and an MR contrast agent (gadoteridol (Gd(HP-DO3A)), Prohance, Squibb) at concentrations of 0–10 mM. This range of concentrations was chosen to span the range expected in myocardial tissue and blood in vivo (28-30) and corresponds to 1/T1's of approximately 0.5–40 s−1 assuming a gadoteridol relaxivity of 4 mM−1 s−1 (10, 31). A heart rate of 50 beats/min was simulated, and 32 of the 96 phase encodes were acquired in each heartbeat as shown in Fig. 1. The T1 values of the solutions were independently measured using saturation recovery.
For comparison, we also imaged the test tubes using the IR-FLASH sequence. The FLASH pulse sequence and SPGR use the same phase encoding scheme; however, the MD-SPGR sequence uses a higher flip angle and a different magnetization prior to imaging. Specifically, for IR-FLASH image acquisition was preceded by a single hard 180° RF pulse and a wait period, whereas for MD-SPGR, image acquisition was preceded by 60 preparatory RF pulses. The imaging parameters for IR-FLASH were chosen based on the study of myocardial perfusion using IR-FLASH by Wilke et al. (4) (wait period = 100 ms, image matrix 256 × 96, NEX = 1, α = 9°, TR = 6.5 ms, TE = 2.3 ms, FOV 36 cm, slice thickness = 10 mm).
For both the MD-SPGR and IR-FLASH sequences, k-space was sampled from top to bottom. For MD-SPGR in which each image is acquired over three cardiac cycles, lines 1, 4, 7, etc., were sampled in beat 1, lines 2, 5, 8, etc., in beat 2, and lines 3, 6, 9, etc., in beat 3. For IR-FLASH, all 96 phase encodes were acquired in one cardiac cycle.
The RF receive gains were not changed at any time during data acquisition. The body RF coil was used for both transmit and receive to ensure a homogeneous RF field among the test tubes.
To allow direct comparison of image intensity between sequences and between the experimental and simulated results, the fully relaxed signal for each tube (So) was also measured using the same SPGR sequence but with a 90° RF flip angle and a TR of 5 s which was assumed to be long enough to ensure full T1 relaxation between phase encodes. This image allowed us to normalize image pixel intensities for the MD-SPGR and IR-FLASH sequences as a fraction of the fully relaxed signal, i.e. S/So.
In Vivo Experiments
We evaluated the practical issues involved in using the MD-SPGR sequence in humans by imaging volunteers (n = 12) and patients with acute myocardial infarction (n = 22) in a 1.5T Signa scanner. Cardiac-gated, partial k-space, double oblique, short axis images were acquired in all cases. “Partial k-space” refers to the fact that the echo fraction factor was 160/256 and that the central 96 of the total 256 phase encodes were acquired. In patients, images were acquired before, during, and after bolus IV injection of 0.1 mmol/kg of gadoteridol. The contrast agent was injected in a peripheral vein over a period of about 3 s. This experimental protocol was carefully designed and fully approved by our Institutional Review Board for clinical investigation.
The overall in vivo imaging protocol was as follows. Images were acquired during multiple 12-heartbeat breath-holds. Within each breath-hold, 32 phase encoding steps were acquired in each heartbeat. The total number of phase encodes/image was 96, such that each image was acquired in three consecutive heartbeats. A total of four base-to-apex slices were acquired. The first slice was acquired in beats 1–3, the next slice in beats 4–6, etc. Patients were then allowed to breathe after the 12th heartbeat. After the first breath-hold, the contrast agent was administered. Images were acquired as quickly as possible after contrast administration (typically two breath-hold/min) for a total of 15 min to characterize the arrival and distribution of contrast within the ventricular cavities and myocardial tissue.
Using these parameters, the temporal resolution for a given slice location is approximately 30 s because the 12 beats used for imaging require approximately 15 s, and an additional 15 s is required between breath-holds for the volunteers and patients to breathe.
The specific absorption rate (SAR) for the MD-SPGR sequence was calculated for a 70-kg man using the body coil and the methods described by General Electric (4.x Signa Overview, revision 1.1, 8-6-90, pp. 7-20-7-23) and was found to be 0.11 W/kg averaged over an exposure period of 6 min.
RESULTS
Simulations and in Vitro Experiments
Driving Magnetization to Steady State
Figure 2 shows the experimental and simulated data for the number of RF pulses necessary to drive magnetization to steady state for flip angles of 10, 45, and 90°. The experiments and simulations agreed well in all cases. Although the number of pulses necessary to reach steady state varied with flip angle, for any given flip angle at least 32 pulses were required to drive magnetization to within 5% of its steady state value. Increasing the flip angle to 90° did not decrease the number of pulses required to reach steady state, presumably because the RF spoiling algorithm requires many pulses to completely spoil transverse magnetization (25).
FIG. 2.

Number of RF pulses required to drive magnetization to steady state. (a) flip angles of 10 and 45°; (b) flip angle of 90°. Although the number of pulses required was dependent on flip angle, for any given flip angle at least 32 pulses were required to drive magnetization to within 5% of its steady state value.
Relationship of Image Intensity to Contrast Concentration
Figure 3 shows signal intensity (image intensity) normalized to the fully relaxed signal intensity (S/S0) as a function of contrast concentration (l/Tl) for the MD-SPGR sequence determined both experimentally and in simulations. The results for IR-FLASH are shown for comparison. The experimental and simulated data agreed well for both sequences and at all contrast concentrations (l/Tl). For IR-FLASH, signal initially increased with increasing l/Tl but eventually reached a plateau. For MD-SPGR, signal increased over the entire range of l/Tl.
FIG. 3.
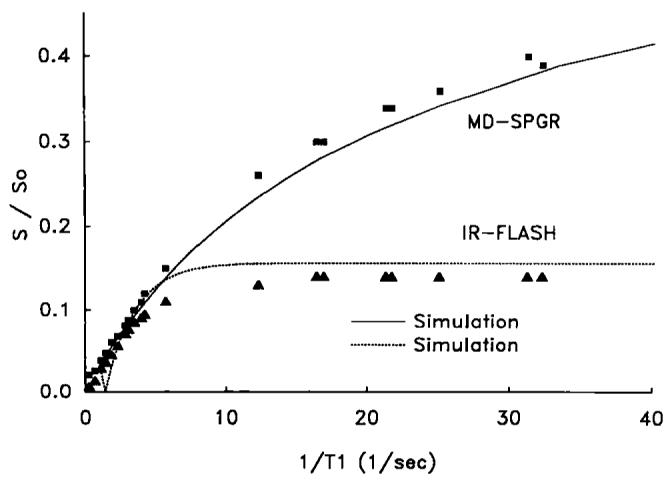
Experimental and simulated relationships between image intensity normalized to fully relaxed image intensity (S/S0) and 1/T1 for both the MD-SPGR and IR-FLASH pulse sequences. The relationships were similar in the range of 1/T1's expected in myocardial tissue (<5 s−1), but image intensity was much higher for MD-SPGR compared to IR-FLASH in the range of 1/T1's expected in blood (>5 s−1).
In Vivo Experiments
Figure 4 shows a series of images acquired in a patient before, during, and after contrast administration. As demonstrated in the upper left-hand image of Fig. 4, the pre-contrast image intensity of myocardium and blood in all volunteers and patients was homogeneous and dark. Following contrast arrival, image pixel intensity increased in both blood and myocardium as a function of time, thereby allowing characterization of contrast arrival and distribution in myocardial tissue.
FIG. 4.

In vivo time sequential short-axis images of a human heart acquired using the MD-SPGR sequence before, during, and after bolus administration of an MR contrast agent. Time increases from left to right, then top to bottom. Each image was acquired in three cardiac cycles. These images were acquired approximately 30 s apart (allowing approximately 15 s between breath-holds for the person to breathe). The pre-contrast image (upper left) exhibited homogeneous and dark pixel intensities in both blood and myocardium. The homogeneity of pixel intensities in pre-contrast images was highly reproducible among patients, facilitating visualization of regional contrast delivery.
In all volunteers, myocardial contrast enhancement was homogeneous around the circumference of the left ventricle. In patients, however, image intensity in infarcted myocardium was initially similar to that of normal myocardium but became significantly greater in images acquired more than two minutes post-injection. Figure 5 shows typical time-intensity curves obtained in a patient for regions of interest within blood, normal myocardium, and infarcted myocardium. The patient results are described in more detail in ref. 18.
FIG. 5.

Time-intensity curves from images acquired in a patient from regions of interest within cavity blood, normal myocardium, and infarcted myocardium. In all volunteers and in regions of normal myocardium in patients, the myocardial time-intensity curves (squares) were similar to those of blood (open circles) but smaller in magnitude. In regions of infarcted myocardium (triangles), time intensity curves showed hyper enhancement in images acquired more than 2 min post-contrast.
The images shown in Fig. 4 were acquired using non-slice selective preparatory RF pulses. In volunteers imaged using slice-selective preparatory RF pulses, we found heterogeneous pixel intensities within the ventricular cavity presumably due to through-plane motion of blood which had not been driven to steady state by the slice-selective preparatory RF pulses. We found that by using nonselective preparatory pulses the problem of heterogeneous pixel intensities within the ventricular cavity is avoided presumably because all protons are at steady state regardless of whether they are originally in the imaging plane or not.
DISCUSSION
The results demonstrate that image intensities for the MD-SPGR pulse sequence approximate a linear relationship to 1/T1 in phantoms. It has been recently demonstrated how this approximate linear relationship can be exploited by using the ratio of myocardial-to-blood signal intensity (MBSI) to examine contrast agent washidwashout kinetics (20, 21).
Dynamic Range of Pixel Intensities
The dynamic range of T1 values that affect image intensity for the MD-SPGR pulse sequence is increased significantly compared to IR-FLASH (Fig. 3). This increase in dynamic range is of significant utility in the use of the blood contrast time-intensity curve as the input function for indicator-dilution analysis of myocardial time-intensity curves (1). For example, estimates show that blood contrast concentrations at the peak of the first-pass are at least 5 mM (28-30). For a Gd-DTPA relaxivity of 4 s−1mM−1 (10) and a pre-contrast blood T1 of 1 s, blood T1 at the peak of the first-pass is approximately 50 ms. From Fig. 3, this T1 (1/0.050 = 20 s−1) is still within the dynamic range which affects image intensity for MD-SPGR but is clearly on the plateau for IR-FLASH. In theory one could use lower concentrations of contrast with IR-FLASH to avoid the plateau, but in practice the required concentrations are so low that almost no myocardial enhancement is observed due to the 10-fold decrease in myocardial contrast concentration relative to blood during the first-pass (10), assuming a vascular volume of 10% in myocardium. Others employing IR-FLASH and IR-EPI sequences have reported a plateau in blood image intensity under first-pass conditions (3, 12) and this has recently been acknowledged as a limitation in characterizing myocardial perfusion (16). The increase in dynamic range using the MD-SPGR sequence is, therefore, an important advantage which enables the use of the ventricular blood time-intensity curve as the myocardial input function for appropriate calculations.
The increased signal intensity for MD-SPGR over that of IR-FLASH (Figure 4) is due largely to the increased flip angle (45° versus 9°). It is not possible to simply increase the flip angle for IR-FLASH in order to increase the level of the plateau because the high tip angle will cause transients in longitudinal magnetization between image phase encodes, resulting in image artifacts, unless magnetization is brought to steady state first as is done in MD-SPGR.
Sensitivity and Linearity
From Eqs. [1]] and [2], note that for α = 90° the relationship between signal (image intensity) and 1/T1 is exactly linear whereas for α = 45° (Fig. 3) some curvature is introduced. We found, however, that the sensitivity (slope of relationship between image intensity and contrast concentration) for α = 90° is poor. At the opposite extreme of flip angle (small flip angles), sensitivity in a narrow range of small 1/T1 is increased but the overall relationship becomes highly nonlinear. We chose a flip angle of 45° as a compromise between sensitivity and linearity.
Sensitivity is an important issue concerning the comparison between MD-SPGR and IR-FLASH. Based on the results shown in Fig. 3, the sensitivity of image intensity to contrast concentration (1/T1) for MD-SPGR using a 45° flip angle is equal to or greater than that of IR-FLASH for all contrast concentrations. Theoretically however, the sensitivity of IR-FLASH should be somewhat greater for low contrast concentrations. Furthermore, the sensitivity of IR-FLASH does not appear to have been optimized in some papers (2, 4), and might be improved by the use of phase sensitive reconstruction rather than the magnitude reconstruction used here and in other reports (2, 4).
Temporal Resolution
As with IR-FLASH, temporal resolution for the MD-SPGR pulse sequence is limited. For 60 preparatory RF pulses and a 6.5 ms TR, approximately 400 ms in each cardiac cycle are required. Because no image data are acquired during this period, the number of phase encoding steps must be reduced to allow the preparatory pulses to be played. In practice, we found that we are limited to 32 phase encodes/cardiac cycle. As a consequence, each image requires three cardiac cycles (for 96 phase encodes), and multiple base-to-apex slices must be serially acquired. More efficient schemes for driving magnetization to steady state are possible, however, and are currently being developed for this sequence.
Limitations
Despite the short TE employed in the MD-SPGR sequence, T2* effects might affect image intensity during the myocardial first-pass of the contrast agent due to capillary compartmentalization of relatively high concentrations of the agent. The relationship between image intensity and 1/T1 would also be expected to diverge from a linear relationship for very short T1 as suggested by the second term of the Taylor series expansion used to simplify Eq. [1]. In addition, the curvature of the relationship shown in Fig. 3 is a function of pre-contrast T1 and the deviation from linearity can be more significant depending on the pre-contrast T1.
Summary
An MD-SPGR pulse sequence has been developed specifically for the study of myocardial perfusion. In vivo pre-contrast image intensity is homogeneous and dark in both blood and myocardium, providing a stable baseline. Using the imaging parameters given here, image pixel intensity increases monotonically even for T1's as short as 30 ms. The MD-SPGR sequence should be useful for myocardial perfusion studies.
REFERENCES
- 1.Rosen BR, Belliveau JW, Vevea JM, Brady TJ. Perfusion imaging with NMR contrast agents. Magn. Reson. Med. 1990;14:249–265. doi: 10.1002/mrm.1910140211. [DOI] [PubMed] [Google Scholar]
- 2.Atkinson DJ, Burstein D, Edelman RR. First-pass cardiac perfusion evaluation with ultrafast MR imaging. Radiology. 1990;174:757–762. doi: 10.1148/radiology.174.3.2305058. [DOI] [PubMed] [Google Scholar]
- 3.Wendland MF, Saeed M, Takayuki M, Derugin N, Moseley ME, Higgins CB. Echo-planar MR imaging of normal and ischemic myocardium with gadodiamide injection. Radiology. 1993;186:535–542. doi: 10.1148/radiology.186.2.8421761. [DOI] [PubMed] [Google Scholar]
- 4.Wilke N, Simm C, Zhang J, Ellerman J, Ya X, Merkle H, Path G, Ludemann H, Bache RJ, Ururbil K. Contrast-enhanced first pass myocardial perfusion imaging—correlation between myocardial blood flow in dogs at rest and during hyperemia. Magn. Reson. Med. 1993;29:485–497. doi: 10.1002/mrm.1910290410. [DOI] [PubMed] [Google Scholar]
- 5.Lima JAC, Judd RM, Zerhouni EA, Schulman SP, Bazille A, Veigh McE. R., Shapiro EP, Weiss JL. Contrast enhanced ultrafast MRI demonstrates perfusion in infarcted myocardium supplied by patent coronary artery despite thallium defect. Circ. Suppl. 1993;88:1275. [Google Scholar]
- 6.Koenig SH, Spiller M, Brown RD, Wolf GL. Relaxation of water protons in the intra- and extracellular regions of blood containing Gd(DTPA) Magn. Reson. Med. 1986;3:791–795. doi: 10.1002/mrm.1910030514. [DOI] [PubMed] [Google Scholar]
- 7.Burstein D, Taratuta E, Manning WJ. Factors in myocardial “perfusion” imaging with ultrafast MRI and Gd-DTPA administration. Magn. Reson. Med. 1991;20:299–305. doi: 10.1002/mrm.1910200212. [DOI] [PubMed] [Google Scholar]
- 8.Tweedle MF, Wedeking P, Telser J, Sotak CH, Chang CA, Kumar K, Wan X, Eaton SM. Dependence of MR signal intensity on Gd tissue concentration over a broad range. Magn. Reson. Med. 1991;22:191–194. doi: 10.1002/mrm.1910220205. [DOI] [PubMed] [Google Scholar]
- 9.Saeed M, Wendland MF, Takehara Y, Masui T, Higgins CB. Reperfusion and irreversible myocardial injury—identification with a nonionic MR imaging contrast medium. Radiology. 1992;182:675–683. doi: 10.1148/radiology.182.3.1535880. [DOI] [PubMed] [Google Scholar]
- 10.Judd RM, Atalay MK, Rottman JR, Zerhouni EA. Effects of myocardial water exchange on enhancement during bolus administration of MR contrast agents. Magn. Reson. Med. 1995;33:215–223. doi: 10.1002/mrm.1910330211. [DOI] [PubMed] [Google Scholar]
- 11.Donahue KM, Burstein D, Manning WJ, Gray ML. Studies of Gd-DTPA relaxivity and proton exchange rates in tissue. Magn. Res. Med. 1994;32:66–76. doi: 10.1002/mrm.1910320110. [DOI] [PubMed] [Google Scholar]
- 12.Wendland MF, Saeed M, Ku KY, Roberts TPL, Lauerma K, Derugin N, Varadarajan J, Watson AD, Higgins CB. Inversion recovery EPI of bolus transit in rat myocardium using intravascular and extravascular gadoliunium-based contrast media: dose effects on peak signal enhancement. Magn. Reson. Med. 1994;32:319–329. doi: 10.1002/mrm.1910320307. [DOI] [PubMed] [Google Scholar]
- 13.Rumberger JA, Bell MR, Feiring AJ, Behrenbeck T, Marcus ML, Ritman EL, Wolf GL. Measurment of myocardial perfusion using fast computed tomography. In: Marcus ML, Skorton DL, Schelbert HR, editors. Cardiac Imaging. Saunders; Philadelphia: 1991. pp. 688–702. [Google Scholar]
- 14.Canty JM, Jr, Judd RM, Brody AS, Klocke FJ. First-pass entry of nonionic contrast agent into the myocardial extravascular space. Circulation. 1991;84:2071–2078. doi: 10.1161/01.cir.84.5.2071. [DOI] [PubMed] [Google Scholar]
- 15.Wu XW, Ewert DL, Liu YH, Ritman EL. In vivo relation of intramyocardial blood volume to myocardial perfusion: evidence supporting microvascular site for autoregulation. Circulation. 1992;85:730–737. doi: 10.1161/01.cir.85.2.730. [DOI] [PubMed] [Google Scholar]
- 16.Hansen Fritz-T., Rostrup E, Larsson HBW, Sondergaard L, Ring P, Henriksen O. Measurement of the concentration of Gd-DTPA during dynamic conditions. SMR Proc. 1994;2:889. [Google Scholar]
- 17.Atkinson DJ, Edelman RR. Cineangiography of the heart in a single breath hold with a segmented turboFLASH sequence. Radiology. 1991;178:357–360. doi: 10.1148/radiology.178.2.1987592. [DOI] [PubMed] [Google Scholar]
- 18.Lima JAC, Judd RM, Bazille A, Schulman SP, Atalar E, Zerhouni EA. Regional heterogeneity of human myocardial infarcts demonstrated by contrast enhanced MRI: potential mechanisms. Circulation. doi: 10.1161/01.cir.92.5.1117. in press. [DOI] [PubMed] [Google Scholar]
- 19.Lima J,AC, Judd RM, Schulman SP, Atalar E, Olivieri Lugo-C. H., Zerhouni EA. Capillary damage within human infarcts assessed by contrast enhanced MRI indexes greater myocardial dysfunction and greater myocardial loss. Circulation. 1994;90:I410. [Google Scholar]
- 20.Roberts J, Lima JAC, Judd RM, Olivieri Lugo-C. H., Zerhouni EA. Altered contrast washin/washout kinetics in chronic human infarcts is proportional to transmural fibrous involvement. Circulation. 1994;90:I410. [Google Scholar]
- 21.Lima JAC, Judd RM, Olivieri Lugo-C. H., Schulman S, Atalar E, Gerstenblith G, Zerhouni EA. Myocardial perfusion pattern by contrast enhanced MRI in the acute post-infarct period can predict myocardial necrosis and eventual extent of scar formation. Circulation. 1994;90:I410. [Google Scholar]
- 22.Ernst RR, Anderson WA. Application of Fourier transform spectroscopy to magnetic resonance. Magn. Reson. Med. 1994;37:93–102. [Google Scholar]
- 23.Sobol WT, Jackels SC, Cothran RL, Hinson WH. NMR spin-lattice relaxation in tissues with high concentration of paramagnetic contrast media: evaluation of water exchange rates in intact muscle. Med. Phys. 1991;18:243–250. doi: 10.1118/1.596722. [DOI] [PubMed] [Google Scholar]
- 24.Crawley AP, Wood ML, Henkelman RM. Elimination of transverse coherences in FLASH MRI. Magn. Res. Med. 1988;8:248–260. doi: 10.1002/mrm.1910080303. [DOI] [PubMed] [Google Scholar]
- 25.Zur Y, Wood ML, Neuringer LJ. Spoiling of transverse magnetization in steady state sequences. Magn. Res. Med. 1991;21:251–263. doi: 10.1002/mrm.1910210210. [DOI] [PubMed] [Google Scholar]
- 26.Reeder SB, Veigh McE. R. Tag contrast in breath-hold CINE cardiac MRI. Magn. Reson. Med. 1994;31:521–525. doi: 10.1002/mrm.1910310508. [DOI] [PMC free article] [PubMed] [Google Scholar]
- 27.Henkelman RM. Measurement of signal intensities in the presence of noise in MR images. Med. Phys. 1984;12:232–233. doi: 10.1118/1.595711. [DOI] [PubMed] [Google Scholar]
- 28.Kennan RP, Zhong J, Gore JC. On the relative importance of paramagnetic relaxation and diffusion-mediated susceptibility losses in tissues. Magn. Res. Med. 1991;22:197–203. doi: 10.1002/mrm.1910220207. [DOI] [PubMed] [Google Scholar]
- 29.Albert MS, Huang W, Lee J, Patlak CS, Springer CS. Susceptibility changes following bolus injections. Magn. Reson. Med. 1993;29:700–708. doi: 10.1002/mrm.1910290520. [DOI] [PubMed] [Google Scholar]
- 30.Weisskoff RM, Kiihne S. MRI susceptometry image-based measurement of absolute susceptibility of MR contrast agents and human blood. Magn. Reson. Med. 1992;24:375–383. doi: 10.1002/mrm.1910240219. [DOI] [PubMed] [Google Scholar]
- 31.Donahue KM. Studies of Gd-DTPA relaxivity and proton exchange rates in tissue with implications for MR imaging of regional myocardial perfusion. Massachusetts Institute of Technology; 1993. Ph.D. Dissertation. [Google Scholar]