

Abstract
A drug delivery vehicle was constructed that could be visualized noninvasively with MRI. The biodegradable polymer poly(DL-lactic-co-glycolic acid) (PLGA) was used to fabricate microspheres containing vascular endothelial growth factor (VEGF) and the MRI contrast agent gadolinium diethylenetriamine pentaacetic acid (Gd-DTPA). The microspheres were characterized in terms of size, drug and contrast agent encapsulation, and degradation rate. The PLGA microspheres had a mean diameter of 48 ± 18 μm. The gadolinium loading was 17 ± 3 μg/mg polymer and the VEGF loading was 163 ± 22 ng/mg polymer. Electron microscopy revealed that the Gd was dispersed throughout the microspheres and it was confirmed that the Gd loading was sufficient to visualize the microspheres under MRI. VEGF and Gd-DTPA were released from the microspheres in vitro over a period of ∼6 weeks in three phases: a burst, followed by a slow steady-state, then a rapid steady-state. Biodegradable Gd-doped microspheres can be effectively used to deliver drugs in a sustained manner, while being monitored noninvasively with MRI.
Keywords: gadolinium, vascular endothelial growth factor, contrast media, drug delivery
Biodegradable polymer microspheres are an effective means of delivering therapeutic agents in a sustained, controlled manner (1). Poly(DL-lactic-co-glycolic acid) (PLGA) has been the most extensively studied matrix because of its proven safety (2), and it has been shown that PLGA can improve the bioavailability of proteins such as human growth hormone (3) and insulin-like growth factor (4). To design the optimal controlled release system requires feedback from in vivo release kinetics and biodistribution studies. Although invasive histological methods of tissue analysis can be used, a noninvasive continuous monitoring technique would be much more valuable in evaluating the in vivo behavior of the drug delivery system.
One application of biodegradable microspheres that is being actively explored is the delivery of angiogenic factors to treat ischemia (5,6). Angiogenic factors such as vascular endothelial growth factor (VEGF) have promising applications in treating ischemic disease, and it has been demonstrated that local, controlled delivery of VEGF protein can be an effective means of inducing neovascularization and promoting tissue perfusion (7). The short biological half-life of VEGF makes a sustained release system desirable, and because of the tumorigenic potential of VEGF (8), it is important that the delivery is controlled and localized to a target region, and that systemic exposure is minimized. These requirements for controlled, localized, sustained delivery of VEGF make PLGA biodegradable microspheres well suited as a delivery vehicle. In order to optimize the delivery of a biodegradable polymer controlled release system for VEGF, it is necessary to be able to observe the fate of the system once it is delivered to ensure that it is targeted properly and that it remains sufficiently localized in vivo.
MRI has the potential to be used as a noninvasive means for visualizing an implanted drug delivery vehicle to monitor its localization and tissue distribution kinetics. The high temporal and spatial resolution of MRI, as well as the use of RF energy instead of radioactive isotopes, makes it a desirable noninvasive imaging modality compared with tomographic techniques such as PET or SPECT. To enhance the contrast in MR images, the paramagnetic lanthanide gadolinium (Gd) is most often used, and it is chelated to larger molecules in order to reduce its toxicity. In this study, the feasibility of incorporating the MR contrast agent Gd diethylenetriamine pentaacetic acid (GdDTPA) (9) into PLGA microspheres to visualize them with MRI was investigated. Data is presented on the construction and characterization of the VEGF/Gd-DTPA PLGA microspheres, as well as the in vitro release kinetics of the contrast agent and drug from within the microspheres.
MATERIALS AND METHODS
Materials
PLGA with a lactide:glycolide ratio of 50:50 and molecular weight (Mw) of 64 kD was provided by Alkermes (Cambridge, MA). Gd-DTPA (Mw = 938) was supplied by Magnevist (Schering, Germany) and was diluted with distilled water to 120 mM. VEGF was provided by the National Cancer Institute (Bethesda, MD) and was formulated in a solution that contained 0.5 mg/ml VEGF and 27 mg/ml bovine serum albumin (BSA). Poly(vinyl alcohol) (PVA) (88% mol hydrolyzed, Mw = 25,000) was purchased from Polysciences (Warrington, PA). Methylene chloride was obtained from Fisher Scientific (Fairlawn, NJ).
Microsphere Preparation
The particles were prepared by double emulsion solvent-evaporation (10,11). The primary water/oil emulsion was made by first dissolving 100 mg of PLGA in 1 ml of methylene chloride, then adding 100 μl of Gd-DTPA and 100 μl of VEGF. The mixture was continuously sonicated at 20 W and 20 kHz for 20 sec. The second emulsion was made by adding 5 ml of a PVA solution (1% PVA, 5% NaCl) and vortexing at the highest setting (8) for 30 sec. This secondary emulsion was added to 40 ml of a second solution of PVA (0.3% PVA, 5% NaCl) and stirred for 3 hr at room temperature to evaporate the methylene chloride. The resulting microspheres were washed three times with distilled water and lyophilized. The microspheres were stored at −20°C.
Microsphere Analysis
The microspheres were imaged using a brightfield light microscope equipped for differential interference contrast (DIC) imaging (Nikon E800, Melville, NY). In DIC imaging, the contrast is a function of optical path gradients and produces a pseudo 3D surface image (12).
The size distribution of the microspheres was analyzed with a particle size analyzer (Multisizer 2, Beckman Coulter, Miami, FL), and the volume-weighted mean diameter (dwm) was calculated according to the following equation (13):
| [1] |
where ni is the number of particles having diameter di.
The Gd-DTPA loading of the particles was determined by inductively coupled plasma mass spectrometry (ICPMS) (Desert Analytics, Tucson, AZ). VEGF loading was calculated from the cumulative release from the in vitro study (see below). Loading level is defined to be the mass of Gd or VEGF encapsulated, per mass of particles.
Energy-filtered electron microscopy (EFTEM) was used to examine the distribution of Gd within the microspheres (14,15). In the EFTEM technique, a monochromatic electron beam focused on the sample loses energy through electron interactions. By using transmitted electrons that fall within a defined energy window, an elemental map can be constructed. For this study, a CM120 transmission electron microscope (Philips Electron Optics / FEI, Hillsboro, OR) equipped with a GIF100 postcolumn imaging filter (Gatan, Warrendale, PA) running Gatan Digital Micrography software was used (16). Microspheres were first embedded in resin and cured overnight at 60°C. Sections were cut dry on a microtome at a thickness of ∼100 μm. The incident electron beam had an energy of 120 keV, and to obtain the signal from Gd, transmitted electrons with energies of 1185 ± 10 eV were counted. The acquisition time was ∼10 min.
In Vitro Degradation
For the in vitro degradation study, 45 mg of particles were suspended in 5 ml of phosphate-buffered saline (pH = 7.3) in a 15-ml centrifuge tube, which was kept in a water bath maintained at 37°C. Three different samples of microspheres, each made separately, were used for the study.
In order to measure the Gd released from the microspheres and the longitudinal relaxation rate of the microspheres themselves, T1 maps were made of the samples at regular intervals over a period of 60 days. Before each measurement the samples were centrifuged at 3300 rpm (1380g) for 15 min in order to form a pellet of microspheres at the bottom of the tube. Images of the samples were then acquired in a 1.5 T clinical MRI scanner (GE, Milwaukee, WI) using a birdcage head coil. To measure T1, an inversion recovery fast spin-echo sequence was used with the following parameters: TR/TE = 10 sec / 10 ms, resolution = 1.25 × 1.25 mm, slice thickness = 5 mm, echo train length = 4, TI = 50–3200 ms. After imaging, 2.5 ml of the supernatant was removed and replaced with 2.5 ml of fresh saline. The sample was gently shaken and replaced in the water bath.
To calculate T1 values, the complex image data was polarity-corrected by subtracting the phase of the fully relaxed image (TI = 3200 ms) from the phase of all the other images and taking the real part. The data was then fit to a three-parameter model (17):
| [2] |
where A and B are parameters that are determined by factors such as the inversion efficiency and equilibrium magnetization, TI is the inversion time, and T1 is the longitudinal relaxation time. A standard curve relating T1 to Gd-DTPA concentration was made with standards prepared in saline at Gd-DTPA concentrations ranging from 0–0.5 mM. This standard curve was used to convert the T1 values measured in the supernatant to Gd-DTPA concentration.
VEGF content in the supernatant was determined by an enzyme-linked immunosorbent assay (ELISA) (Quantikine VEGF Immunoassay kit, R&D Systems, Minneapolis, MN) and measured in duplicate. Values for VEGF and GdDTPA concentration in the supernatant were normalized to the total amount released. All values are reported as mean of the three samples ± standard deviation (SD).
Relaxation Measurements
In order to characterize the magnetic relaxation properties of the microspheres they were embedded in gelatin, since they tended to settle when mixed with water. Gelatin (Sigma, St. Louis, MO; 175 bloom) was prepared at a concentration of 16% (weight/volume). A suspension was made with 200 mg of PLGA microspheres and 3 ml of water, and 0.5 ml of this suspension was added to 0.5 ml of gelatin and vortexed. In order to measure the T1 of the free Gd-DTPA in the suspension, 1 ml of the suspension was filtered with a 0.22 μm syringe filter and 0.5 ml of the filtrate was added to 0.5 ml of gelatin and vortexed. In addition, a suspension of blank spheres containing no Gd-DTPA was also embedded in gelatin to measure the T1 effect of the PLGA. To measure T1, inversion recovery gradient-echo images were acquired on a 1.5 T clinical scanner with the following imaging parameters: TR/TE = 10 s/3.8 ms, resolution = 0.47 × 0.94 mm, TI = 16–4000 ms. The data were polarity-corrected and fit to a three-parameter monoexponential recovery curve as described above. Standards were prepared containing varying concentrations of Gd-DTPA in gelatin, ranging from 0–2.25 mM. T1 was converted to Gd-DTPA concentration using this curve.
Bioactivity
The bioactivity of VEGF released from microspheres was assayed by measuring its ability to induce proliferation in human umbilical vein endothelial cells (HUVECs). The proliferation assay was conducted by Paragon Bioservices (Baltimore, MD). Cells were seeded into 24-well cell culture plates at a density of 5000 cells/well. Cells were grown in endothelial growth media (EGM-2, Cambrex, East Rutherford, NJ) for 2 days in a 37°C incubator with 5% CO2. The EGM-2 media is a proprietary formulation containing basal media plus supplements, cytokines, and growth factors, including VEGF. The EGM-2 media was then replaced with experimental media and the amount of cellular proliferation was measured 4 days later by counting the viable cells in each well using a hemacytometer and Trypan blue staining. There were four experimental media formations, each made with modified EGM-2 media that contained all the components of EGM-2 except VEGF. Group 1 contained exogenously added VEGF protein and served as a positive control. Group 2 contained supernatant from VEGF/Gd-DTPA PLGA microspheres. Group 3 contained supernatant from “empty” microspheres containing Gd-DTPA and BSA, and served as a negative control. Group 4 contained the modified media alone and served as an additional negative control. Groups 1 and 2 contained VEGF at a concentration of 10 ng/ml. Each was tested in triplicate. Values are reported as mean ± SD. Statistical significance was tested using one-tailed un-paired Student's t-tests. Statistical significance was defined as P ≤ 0.05.
RESULTS
Microsphere Size and Gadolinium Loading
The VEGF/Gd-DTPA PLGA microspheres were spherical in shape and heterogeneous in size, as shown in the DIC light micrograph in Fig. 1. The size distribution is shown in Fig. 2. The mean diameter of this distribution, termed the volume-weighted mean (dwm), calculated from Eq. 1, was 48 ± 18 μm. The Gd loading of the microspheres was determined by ICP-MS elemental analysis to be 17 ± 3 μg/mg polymer, which corresponds to 103 ± 16 μg/mg polymer loading for Gd-DTPA. The distribution of Gd within the microspheres was investigated using energy-filtered transmission electron microscopy (EFTEM), as shown in Fig. 3. Figure 3a shows a low-loss transmission electron micrograph of a single particle, with regions of high electron density appearing dark. For each pixel the area under the peak between 1175 and 1195 eV in the energy loss spectrum was integrated to construct a Gd map, as shown in Fig. 3b. In this micrograph, signal intensity is proportional to Gd concentration. The bright regions in the energy-filtered electron micrograph correspond to the dark regions of high electron density in the low-loss electron micrograph in Fig. 3a. From these images it can be seen that the Gd is dispersed homogeneously throughout the particle.
FIG. 1.
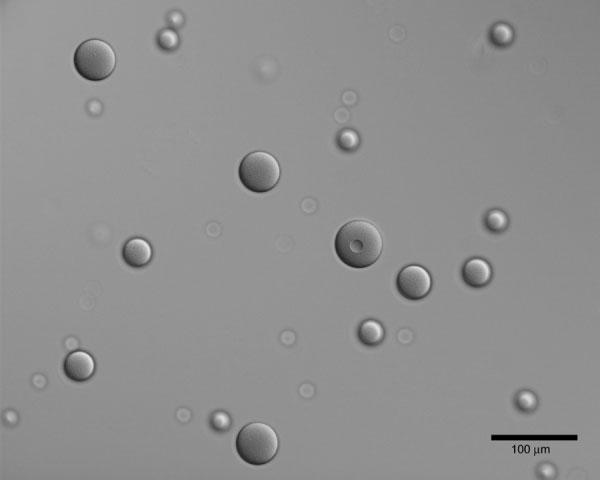
Differential interference contrast (DIC) light micrograph of VEGF/Gd-DTPA PLGA microspheres. Scale bar = 100 μm.
FIG. 2.
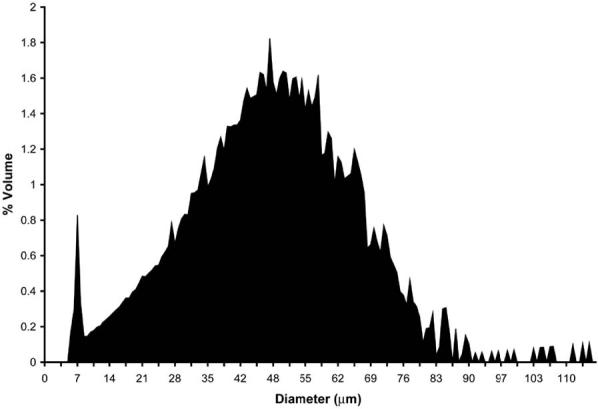
Size distribution of VEGF/Gd-DTPA PLGA microspheres. The graph shows the contribution to the total volume of microspheres vs. microsphere diameter. The mean ± SD of this volume-weighted distribution is 48 ± 18 μm.
FIG. 3.
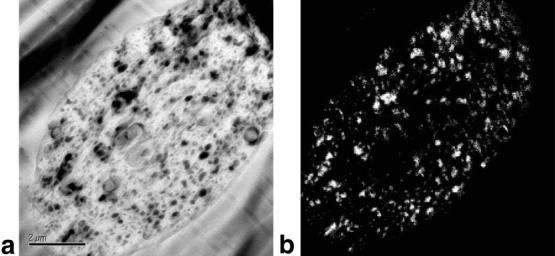
Electron micrographs of VEGF/Gd-DTPA PLGA microsphere. a: Low-loss transmission electron micrograph of a single sphere. b: Energy-filtered transmission electron micrograph (EFTEM) of same sphere in a showing localization of Gd. Dark regions in a indicating regions of high electron density correspond to bright regions in b which contain Gd. Scale bar = 2 μm.
Longitudinal Relaxation Effects
In order to characterize the T1 relaxation effect of the microspheres, they were embedded in gelatin (to prevent settling) and the T1 was measured on a 1.5 T MR scanner. Microspheres were also filtered and the resulting filtrate was mixed with gelatin to measure the T1 of Gd-DTPA that had escaped from the microspheres. To determine if the polymer itself had any T1 effect, T1 was also measured for gelatin containing empty microspheres and for gelatin alone. The longitudinal relaxation rate, R1 (R1 = 1/T1), is plotted for each of these samples in Fig. 4. The relaxation rates of gelatin and empty spheres in gelatin were similar, indicating that PLGA alone has no appreciable T1 effect. The T1 enhancement of the VEGF/Gd-DTPA microspheres is significant and is due in part to free Gd-DTPA that has escaped from the microspheres, as shown by the increased relaxation rate of the filtrate. From elemental analysis, the Gd-DTPA concentration of the microspheres in the gelatin was 4.6 mM. By MRI measures, however, the relaxation rate of the embedded spheres was equivalent to the relaxation rate of a 2.1 mM concentration of Gd-DTPA in gelatin. The discrepancy is likely due to restriction of water access to the encapsulated Gd-DTPA by the polymer, thereby reducing the T1 effect.
FIG. 4.
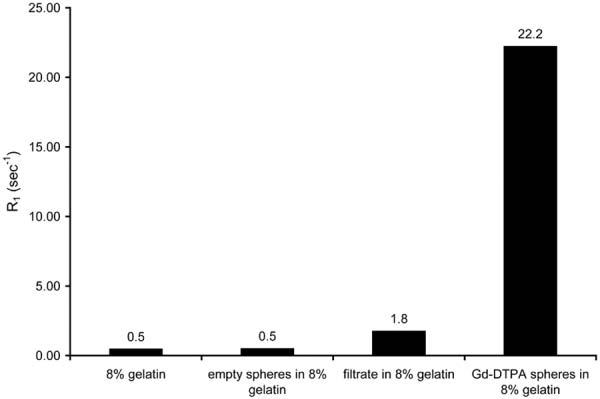
R1 relaxation rates for 8% gelatin, empty microspheres, filtrate, and Gd-DTPA microspheres. The empty microspheres did not have an effect on the relaxation rate, indicating that the PLGA by itself had no T1 effect. The result for the filtrate is a measure of the contribution of nonencapsulated Gd-DTPA to the overall relaxation rate enhancement of the Gd-DTPA microspheres.
Release Kinetics
Samples of microspheres were suspended in saline and placed in a water bath at 37°C. At regular intervals the microspheres were centrifuged and a sample of supernatant was taken and replaced with fresh saline. The “day 0” sample was taken immediately after the microspheres were first suspended in saline. Figure 5 shows an inversion recovery fast spin-echo image (TI = 1600 ms) of the day 30 samples of VEGF/Gd-DTPA PLGA microspheres. The microspheres appear as bright regions at the bottom of the tubes. The release kinetics of VEGF and Gd-DTPA from PLGA microspheres is shown in Fig. 6. Also shown is the longitudinal relaxation rate (R1) of the pellet of micro-spheres after centrifugation. The release profiles for both the VEGF and Gd-DTPA can be described by three phases: a burst, followed by a slow steady-state, followed by a rapid steady-state. For the Gd-DTPA, 54% was released by day 1, 0.2%/day was released during the slow steady-state phase (days 2–16), and 5%/day was released during the rapid steady-state phase (days 18–24). For the VEGF, 3% was released by day 1, 0.1%/day was released during the slow steady-state phase (days 2–20), and 6%/day was released during the rapid steady-state phase (days 24–35). The release of VEGF slightly lags that of Gd-DTPA. The R1 of the microspheres increase and reach a maximum when the rate of release of Gd-DTPA is also at its maximum. The R1 then decreases as the rate of Gd-DTPA release decreases.
FIG. 5.
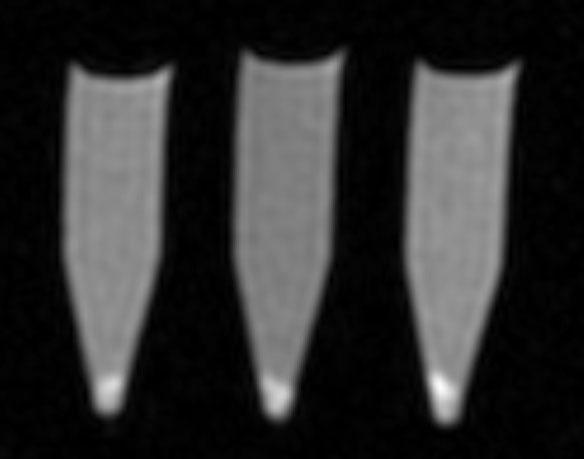
Fast spin-echo image of VEGF/Gd-DTPA PLGA micro-spheres after 30 days of degradation. The three samples have been centrifuged and the microsphere pellets appear as a bright region at the bottom of the tubes. Imaging parameters were TR/TE = 10 sec / 10 ms, echo train length = 4, inversion time = 1600 ms, resolution = 1.25 × 1.25 mm.
FIG. 6.
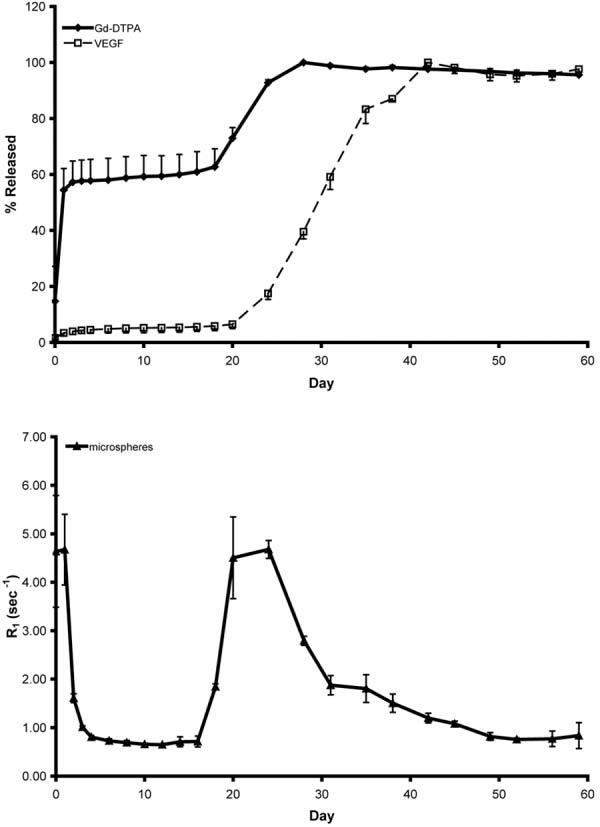
Release (top) and relaxation rate (bottom) kinetics of VEGF/Gd-DTPA PLGA microspheres. In the top figure the amounts of VEGF and Gd-DTPA are expressed as the percentage of the total released. The bottom graph shows the relaxation rate of the microsphere pellet. The release takes place in three phases: an initial burst, followed by a slow steady-state, followed by a rapid steady-state. The relaxation rate of the microspheres reaches a maximum during the maximum rate of Gd-DTPA release and resembles the derivative of the release curve. Points on the graphs represent the mean of three samples and the bars represent the SD.
Bioactivity
The bioactivity of the VEGF released from the PLGA microspheres was assessed by measuring the proliferation of HUVECs over a period of 4 days cultured with supernatant from VEGF/Gd-DTPA PLGA microspheres (“VEGF micro-spheres”). The results are shown in Fig. 7. For this assay, VEGF protein served as a positive control (“VEGF”), and supernatant from empty microspheres (“empty micro-spheres”) and media excluding VEGF (“media”) served as negative controls. No significant difference was found between the cell counts for the VEGF and VEGF micro-spheres groups, indicating that the VEGF released from the microspheres was as bioactive as the unencapsulated VEGF. Both VEGF groups induced proliferation that was significantly higher than the negative controls (P ≤ 0.05).
FIG. 7.
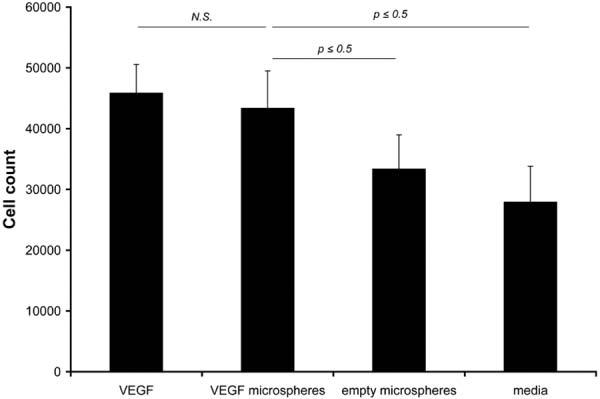
Bioactivity measured by human umbilical vein cell (HUVEC) proliferation. Each bar represents the cell count at the end of 4 days of incubation with a particular media formation. VEGF = exogenously supplied VEGF (10 ng/ml), VEGF microspheres = VEGF released from VEGF/Gd-DTPA microspheres, empty = supernatant from empty (BSA/Gd-DTPA) microspheres, media = modified media without VEGF. The VEGF group served as a positive control and the empty and media groups served as negative controls. The counts for the VEGF microspheres group was not significantly different than the counts for the VEGF group, and were significantly (P ≤ 0.05) higher than the two negative controls. The data are expressed as mean ± SD of measurements made in triplicate.
DISCUSSION
It has been shown that biodegradable PLGA microspheres can be manufactured to co-encapsulate the angiogenic factor VEGF and the MRI contrast agent Gd-DTPA. By incorporating Gd-DTPA into the microspheres they can be clearly localized with MRI, which can be used to noninvasively provide information about the spatial distribution and release kinetics of the sustained release drug delivery vehicle. The incorporation of Gd-DTPA did not affect the bioactivity of the VEGF, as demonstrated by the HUVEC cellular proliferation assay.
The distribution of Gd-DTPA in the microspheres was fairly homogeneous, as demonstrated by the elemental map obtained by EFTEM. From the relaxation measurements, it was found that the polymer itself had a negligible effect on T1 relaxation. The relaxation rate of the VEGF/Gd-DTPA PLGA microspheres was significantly higher than that of empty microspheres. Some of this effect is from free Gd-DTPA that has been released from the microspheres, as shown by the relaxation rate of the filtrate, which was slightly higher than that of plain gelatin. The contribution of free Gd-DTPA to the overall T1 relaxation effect of the microspheres increases over time as more and more is released. The relaxivity of the encapsulated Gd-DTPA is somewhat less than that of free Gd-DTPA, since water access is inhibited, so that an effective concentration is observed that is less than the actual concentration of Gd-DTPA.
For the in vitro release of VEGF, an initial small burst followed by a biphasic steady-state release was observed. Similar release profiles have been observed by others (18,19). The release of Gd-DTPA and VEGF from the microspheres followed similar profiles. The initial burst may be due to material being released from the outer surface of the microspheres. Subsequently, the primary mode of degradation for PLGA microspheres is bulk erosion (20,21), where hydrolysis of the interior of the microspheres happens faster than erosion of the surface. As water hydrolyzes the interior of the microspheres, tortuous channels develop, through which material from the interior is able to diffuse. During the early stages of hydrolysis, very small amounts of VEGF and Gd-DTPA are released. As these channels increase in size, increasing amounts of material are able to diffuse out and eventually some spheres break apart, releasing bulk amounts. The rapid release phase of Gd-DTPA slightly precedes the rapid release of VEGF, which may be explained by the difference in size between Gd-DTPA (1 kD) and VEGF (45 kD). Because Gd-DTPA is a smaller molecule, it may more easily diffuse out of the polymer as it degrades.
The relaxation rate of the spheres increases as the release rate of Gd-DTPA increases, so that the R1 of the microspheres resembles the derivative of the release of Gd-DTPA. Initially, a burst of Gd-DTPA is released from the surface of the microspheres, where it is easily accessed by water and therefore effectively increases the R1 of the microspheres. After this initial release, the encapsulated Gd is shielded from water and the R1 decreases. As hydrolysis of the polymer occurs, pores and channels develop within the microspheres, thereby allowing water greater access to Gd within the microspheres, increasing the effective R1. Furthermore, the Gd is more easily able to diffuse out of microspheres, resulting in an increased release rate. Eventually, most of the Gd diffuses out and the R1 decreases once again. By tracking the R1 of the micro-spheres, the release rate of Gd can be inferred, which can in turn be used to approximate the release of drug from the microspheres.
The degradation rate of PLGA microspheres can be influenced by the polymer composition, preparation conditions, and the incorporation of additives (22-24). For example, it has been shown that the inclusion of BSA facilitates the release of growth factor from a polymer matrix (25). By carefully choosing these parameters, the release profile can be finely controlled, which may be especially important for optimizing the delivery of angiogenic factors (26,27). It has been demonstrated that in vivo release rates can be approximately twice the rates observed in vitro (24). The increased rate of hydrolysis and polymer degradation that occurs in vivo should affect the rates of release of VEGF and Gd-DTPA similarly, so that they should still correlate well in vivo, as they do in vitro.
The current study investigated the use of Gd-doped bio-degradable microspheres as a means for delivering the angiogenic factor VEGF, but the techniques presented here could easily be applied to co-encapsulate a variety of therapeutic polypeptides. In theory, these microspheres could also be used to deliver DNA (28) in a sustained manner, and therefore prolong gene expression without the use of viral vectors. The co-encapsulation of Gd would allow the use of MRI to ensure that the DNA was localized properly and to monitor the initial biodistribution.
CONCLUSIONS
In this study the angiogenic protein VEGF and the MRI contrast agent Gd-DTPA were co-encapsulated in biodegradable microspheres by the double emulsion solvent-evaporation method. The microspheres degraded over a period of ∼30 days, with both the protein and contrast agent exhibiting triphasic release profiles. After an initial burst release the first day, Gd-DTPA was released slowly for the first 16 days, then rapidly over the next 8 days. The VEGF release slightly lagged that of the Gd-DTPA, with the slow release phase occurring during the first 20 days and the rapid release phase occurring over the following 15 days. The incorporation of Gd-DTPA enabled the microspheres to be visible under MRI, and a correlation was observed between the change in longitudinal relaxation rate of the microspheres and the release of VEGF and Gd-DTPA.
ACKNOWLEDGMENTS
The authors thank the National Cancer Institute for their generous gift of VEGF; William Shenke for help with the ELISA assay and Yah-el Har-el for help with the particle sizing; Richard Leapman for help in acquiring the EM images; and Levant Akyurek for helpful discussions regarding VEGF.
REFERENCES
- 1.Cohen S, Yoshioka T, Lucarelli M, Hwang LH, Langer R. Controlled delivery systems for proteins based on poly(lactic/glycolic acid) microspheres. Pharm Res. 1991;8:713–720. doi: 10.1023/a:1015841715384. [DOI] [PubMed] [Google Scholar]
- 2.Athanasiou KA, Niederauer GG, Agrawal CM. Sterilization, toxicity, biocompatibility and clinical applications of polylactic acid/polyglycolic acid copolymers. Biomaterials. 1996;17:93–102. doi: 10.1016/0142-9612(96)85754-1. [DOI] [PubMed] [Google Scholar]
- 3.Cleland JL, Mac A, Boyd B, Yang J, Duenas ET, Yeung D, Brooks D, Hsu C, Chu H, Mukku V, Jones AJ. The stability of recombinant human growth hormone in poly(lactic-co-glycolic acid) (PLGA) microspheres. Pharm Res. 1997;14:420–425. doi: 10.1023/a:1012031012367. [DOI] [PubMed] [Google Scholar]
- 4.Singh M, Shirley B, Bajwa K, Samara E, Hora M, O'Hagan D. Controlled release of recombinant insulin-like growth factor from a novel formulation of polylactide-co-glycolide microparticles. J Control Release. 2001;70:21–28. doi: 10.1016/s0168-3659(00)00313-8. [DOI] [PubMed] [Google Scholar]
- 5.King TW, Patrick CW., Jr Development and in vitro characterization of vascular endothelial growth factor (VEGF)-loaded poly(DL-lactic-coglycolic acid)/poly(ethylene glycol) microspheres using a solid encapsulation/single emulsion/solvent extraction technique. J Biomed Mater Res. 2000;51:383–390. doi: 10.1002/1097-4636(20000905)51:3<383::aid-jbm12>3.0.co;2-d. [DOI] [PubMed] [Google Scholar]
- 6.Cleland JL, Duenas ET, Park A, Daugherty A, Kahn J, Kowalski J, Cuthbertson A. Development of poly-(D,L-lactide-co-glycolide) microsphere formulations containing recombinant human vascular endothelial growth factor to promote local angiogenesis. J Control Release. 2001;72:13–24. doi: 10.1016/s0168-3659(01)00258-9. [DOI] [PubMed] [Google Scholar]
- 7.Hopkins SP, Bulgrin JP, Sims RL, Bowman B, Donovan DL, Schmidt SP. Controlled delivery of vascular endothelial growth factor promotes neovascularization and maintains limb function in a rabbit model of ischemia. J Vasc Surg. 1998;27:886–894. doi: 10.1016/s0741-5214(98)70269-1. [DOI] [PubMed] [Google Scholar]
- 8.Lee RJ, Springer ML, Blanco-Bose WE, Shaw R, Ursell PC, Blau HM. VEGF gene delivery to myocardium: deleterious effects of unregulated expression. Circulation. 2000;102:898–901. doi: 10.1161/01.cir.102.8.898. [DOI] [PubMed] [Google Scholar]
- 9.Gadian DG, Payne JA, Bryant DJ, Young IR, Carr DH, Bydder GM. Gadolinium-DTPA as a contrast agent in MR imaging—theoretical projections and practical observations. J Comput Assist Tomogr. 1985;9:242–251. doi: 10.1097/00004728-198503000-00003. [DOI] [PubMed] [Google Scholar]
- 10.Jeffery H, Davis SS, O'Hagan DT. The preparation and characterization of poly(lactide-co-glycolide) microparticles. II. The entrapment of a model protein using a (water-in-oil)-in-water emulsion solvent evaporation technique. Pharm Res. 1993;10:362–368. doi: 10.1023/a:1018980020506. [DOI] [PubMed] [Google Scholar]
- 11.Ogawa Y, Yamamoto M, Okada H, Yashiki T, Shimamoto T. A new technique to efficiently entrap leuprolide acetate into microcapsules of polylactic acid or copoly(lactic/glycolic) acid. Chem Pharm Bull (Tokyo) 1988;36:1095–1103. doi: 10.1248/cpb.36.1095. [DOI] [PubMed] [Google Scholar]
- 12.Murphy D. Fundamentals of light microscopy and electronic imaging. John Wiley & Sons; New York: 2001. Differential interference contrast (DIC) microscopy and modulation contrast microscopy; pp. 153–68. [Google Scholar]
- 13.Edmundson IC. Particle-size analysis. Adv Pharm Sci. 1967;2:95–179. [PubMed] [Google Scholar]
- 14.Reimer L. Electron spectroscopic imaging. In: Reimer L, editor. Energy-filtered transmission electron microscopy. Springer; Berlin: 1995. pp. 347–400. [Google Scholar]
- 15.Leapman RD, Jarnik M, Steven AC. Spatial distributions of sulfur-rich proteins in cornifying epithelia. J Struct Biol. 1997;120:168–179. doi: 10.1006/jsbi.1997.3937. [DOI] [PubMed] [Google Scholar]
- 16.Krivanek OL, Friedman SL, Gubbens AJ, Kraus B. An imaging filter for biological applications. Ultramicroscopy. 1995;59:267–282. doi: 10.1016/0304-3991(95)00034-x. [DOI] [PubMed] [Google Scholar]
- 17.Crawley AP, Henkelman RM. A comparison of one-shot and recovery methods in T1 imaging. Magn Reson Med. 1988;7:23–34. doi: 10.1002/mrm.1910070104. [DOI] [PubMed] [Google Scholar]
- 18.Spenlehauer G, Vert M, Benoit JP, Boddaert A. In vitro and in vivo degradation of poly(D,L lactide/glycolide) type microspheres made by solvent evaporation method. Biomaterials. 1989;10:557–563. doi: 10.1016/0142-9612(89)90063-x. [DOI] [PubMed] [Google Scholar]
- 19.Hora MS, Rana RK, Nunberg JH, Tice TR, Gilley RM, Hudson ME. Release of human serum albumin from poly(lactide-co-glycolide) microspheres. Pharm Res. 1990;7:1190–1194. doi: 10.1023/a:1015948829632. [DOI] [PubMed] [Google Scholar]
- 20.Langer R, Folkman J. Polymers for the sustained release of proteins and other macromolecules. Nature. 1976;263:797–800. doi: 10.1038/263797a0. [DOI] [PubMed] [Google Scholar]
- 21.Langer R. New methods of drug delivery. Science. 1990;249:1527–1533. doi: 10.1126/science.2218494. [DOI] [PubMed] [Google Scholar]
- 22.Yang YY, Chung TS, Bai XL, Chan WK. Effect of preparation conditions on morphology and release profiles of biodegradable polymeric microspheres containing protein fabricated by double-emulsion method. Chem Eng Sci. 2000;55:2223–2236. [Google Scholar]
- 23.Wu XS, Wang N. Synthesis, characterization, biodegradation, and drug delivery application of biodegradable lactic/glycolic acid polymers. II. biodegradation. J Biomater Sci Polym Ed. 2001;12:21–34. doi: 10.1163/156856201744425. [DOI] [PubMed] [Google Scholar]
- 24.Tracy MA, Ward KL, Firouzabadian L, Wang Y, Dong N, Qian R, Zhang Y. Factors affecting the degradation rate of poly(lactide-co-glycolide) microspheres in vivo and in vitro. Biomaterials. 1999;20:1057–1062. doi: 10.1016/s0142-9612(99)00002-2. [DOI] [PubMed] [Google Scholar]
- 25.Murray JB, Brown L, Langer R, Klagsburn M. A micro sustained release system for epidermal growth factor. In Vitro. 1983;19:743–748. doi: 10.1007/BF02618093. [DOI] [PubMed] [Google Scholar]
- 26.Carmeliet P. Mechanisms of angiogenesis and arteriogenesis. Nat Med. 2000;6:389–395. doi: 10.1038/74651. [DOI] [PubMed] [Google Scholar]
- 27.Hershey JC, Baskin EP, Glass JD, Hartman HA, Gilberto DB, Rogers IT, Cook JJ. Revascularization in the rabbit hindlimb: dissociation between capillary sprouting and arteriogenesis. Cardiovasc Res. 2001;49:618–625. doi: 10.1016/s0008-6363(00)00232-7. [DOI] [PubMed] [Google Scholar]
- 28.Wang D, Robinson DR, Kwon GS, Samuel J. Encapsulation of plasmid DNA in biodegradable poly(D, L-lactic-co-glycolic acid) microspheres as a novel approach for immunogene delivery. J Control Release. 1999;57:9–18. doi: 10.1016/s0168-3659(98)00099-6. [DOI] [PubMed] [Google Scholar]