Abstract
Purpose:
To develop and test a delayed-enhancement imaging method for improving the contrast between myocardial infarction (MI) and blood pool.
Materials and Methods:
The T2 of blood is significantly longer than that of acute or chronic MI. The proposed multi-contrast delayed-enhancement (MCODE) imaging method produces a series of images with both T1 and T2 weightings, which provides both excellent contrast between normal and infarcted myocardium, and between blood and MI.
Results:
The subendocardial border between MI and blood pool was easily discriminated in the T2-weighted image. The measured MI-to-blood contrast-to-noise ratio (CNR) was better in the T2-weighted image than in the T1-weighted image (22.5 ± 8.7 vs. 2.9 ± 3.1, mean ± SD, N = 11, P < 0.001, for TrueFISP, and 19.4 ± 10.8 vs. 3.9 ± 2.3, N = 11, P < 0.001, for TurboFLASH).
Conclusion:
The MCODE method provides a significant improvement in the ability to easily discriminate subendocardial MI by providing a T2-weighted image with high contrast between blood and MI. MCODE should improve both the detection and accurate sizing of MI.
Keywords: MRI, delayed enhancement, myocardial infarction, phase-sensitive, inversion recovery, SENSE, parallel MRI, T2-weighted
Myocardial viability assessment using Gd-DTPA enhancement MRI is gaining clinical acceptance (1,2). With the use of recent MRI methods (3) myocardial infarction (MI) can be imaged with high spatial resolution and good contrast. Following administration of Gd-DTPA, infarcted myocardium exhibits delayed enhancement and can be imaged using an inversion recovery (IR) sequence (1-3). Delayed-enhancement imaging using an IR sequence exhibits excellent contrast between infarcted and normal myocardium; however, the contrast between the MI and the blood pool is frequently suboptimal. Since a large fraction of infarctions caused by coronary artery disease are subendocardial, it is often difficult to assess the precise size of the infarct or to detect small infarcts.
The contrast between the blood and MI in the T1-weighted delayed contrast-enhanced image depends on variables such as contrast agent dosage, time from infusion, clearance rate, and imaging parameters. In the case of a small MI, partial volume effects may also reduce the contrast. Blood velocity may also have a role in the contrast, even though non-slice-selective IR is used. Therefore, as a result of mechanisms that are not fully characterized, it is not infrequent that subendocardial MI are difficult to detect or that blood may appear as possible delayed-enhanced myocardial tissue. Furthermore, the nonoptimal contrast between blood and MI may limit the accuracy of measuring the infarct size.
Using a combination of multiple imaging protocols has been shown to improve diagnostic accuracy. For example, the use of cine function and delayed-enhancement images may produce a better assessment by combining tissue characterization with wall thickness or wall motion abnormality (4). T2-weighted dark blood images have been used in conjunction with contrast-enhanced imaging to discriminate between acute and chronic MIs by detecting edema (5). T2-weighted imaging is used to provide contrast between blood and myocardium in the noncontrast imaging of coronary arteries (6,7).
This paper introduces a method for delayed contrast enhancement imaging that acquires both T1 and T2 contrasts within a single acquisition to enhance the contrast between the MI and the blood pool (8). By acquiring both images with the same resolution and slice prescription, as well as at the same cardiac and respiratory phases, accurate registration is ensured, which is important for the discrimination of subendocardial MI. A phase-sensitive IR (PSIR) method (9) of image reconstruction was used. PSIR techniques have a number of demonstrated benefits, including consistent contrast and appearance over a relatively wide range of IR times (TI), improved contrast-to-noise ratio (CNR), and accurate depiction of the enhanced region. The multiple contrast images may be presented to the user for interpretation, or potentially can be merged to produce a single image with improved contrast.
The current method was implemented with both segmented Turbo-FLASH (3) and single-shot True-FISP (10) sequences. The Turbo-FLASH and True-FISP sequences are both presented to demonstrate feasibility. In order to acquire both T1- and T2-weighted images, the imaging duration must be increased, and therefore parallel imaging methods may be employed to reduce the imaging time. Initial results using parallel imaging using the image domain sensitivity encoding (SENSE) method (11) are described.
MATERIALS AND METHODS
Basic Concept
A schematic plot of the T1- and T2-weighted signal intensities for the three tissue species (blood, MI, and normal myocardium) is shown in Fig. 1 to illustrate the basic concept of multicontrast discrimination. The T2-weighted image allows distinction of blood and myocardium, and the T1-weighted image allows distinction of normal and infarcted myocardium. The nominal values of T2 are 50 msec for myocardium and 250 msec for blood (12). In acute MI the T2 may be elevated due to edema with values in the range of 50–65 msec (13), which are still much less than those of blood. The T2 values are not shortened significantly with contrast-enhanced imaging because the T2 is still less than the T1 after contrast enhancement. For delayed-enhancement imaging, the nominal values (measured in previous studies at approximately 15 minutes following double dose) of T1 are 390 msec for normal myocardium and 250 msec for blood, and are only 10's of msec shorter for MI. The values of T1 depend on a number of variables, such as contrast agent dosage, time from infusion, and clearance rate. However, the main point is that the T1 values of blood and MI may be quite similar, leading to similar T1-weighted signal intensities.
Figure 1.
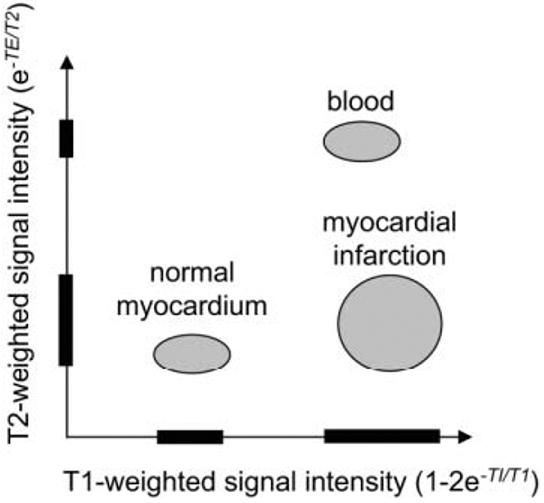
Schematic plot of T1- and T2-weighted signal intensities for normal myocardium, myocardial infarction, and blood, illustrating multiparameter signal separation.
Experimental Parameters
Delayed-enhancement imaging was performed in patients under a clinical research protocol approved by the Institutional Review Board of the National Heart, Lung, and Blood Institute, with prior informed consent. Images were acquired 10–30 minutes after a double dose (0.2 mmol/kg) of contrast agent (Gadopentetate Dimeglumine; Berlex Magnevist) was administered. Experiments were conducted using a 1.5T Siemens Avanto MRI system. The Siemens product PSIR true-FISP and Turbo-FLASH sequences and reconstruction software was custom modified to incorporate the acquisition of a T2-weighted image as well as parallel imaging using SENSE. For parallel imaging, a custom eight-element cardiac phased array (Nova Medical, Inc., Wilmington, MA, USA) was used, which consisted of two four-element linear arrays (24 cm × 6 cm element size with long dimension oriented along the superior/inferior (S/I) direction and without gap in the left/right (L/R) direction), with one array positioned on the chest and the second array positioned on the back of the patient. Raw data, including prescan noise, were acquired for all scans to enable offline image reconstruction for accurate signal-to-noise ratio (SNR) measurement.
Multicontrast delayed-enhancement (MCODE) images for short-axis slices were acquired in 11 patients (10 males and one female) with chronic MI for CNR measurement between blood and MI for both T1- and T2-weighted images. Long-axis images were acquired in several patients. The mean age of the patients was 60.9 ± 6.3 years (mean ± STD). The mean weight of the patients was 172.9 ± 23.8 pounds (mean ± STD). The mean heart rate of the patients was 59.7 ± 12.9 bpm (mean ± STD). In addition to the series of patients with chronic MI, one patient with a perioperative infarction was imaged.
For each slice imaged, data were acquired for both single-shot TrueFISP and segmented TurboFLASH sequences. Images were acquired without parallel imaging for all patients, and several patients were imaged both with and without parallel imaging. The acquisition order was randomly varied to ensure that there was no acquisition order dependence. In addition to delayed-enhancement images, TrueFISP cine functional images were acquired precontrast for all patients.
Typical parameters for the IR-True-FISP sequence were BW = 977 Hz/pixel; readout flip angle = 50° (T1-weighted IR image), 8° (reference), and 65° (T2-weighted image); and FOV = 300–370 mm. The acquistion matrix was 192 × 96 without parallel imaging (TE/TR = 1.1/2.6 msec), and 256 × 128 image matrix with R = 2 parallel imaging (TE/TR = 1.2/2.9 msec). Without parallel imaging the imaging duration was approximately 250 msec, and with parallel imaging the imaging duration was reduced to 184 msec by acquiring 64 phase encodes in a single heartbeat and reconstructing to obtain the full 128-line image resolution using rate R = 2 SENSE. A trigger delay was used to position the acquisition in mid-diastole. The value of the trigger delay depends on the heart rate and IR prep time (TI). The TI was set to nominally 300 msec, which approximately nulls the normal myocardium. The use of phase-sensitive IR obviated the need for precise TI adjustment. The same TI and FOV were used for both sequences. A typical value for the trigger delay is in the range of 300–400 msec. The breath-hold acquisition was three heartbeats for the single-shot IR-True-FISP sequence, either with or without parallel imaging.
Typical parameters for the IR-Turbo-FLASH sequence were BW = 140 Hz/pixel; TE/TR = 3.9/8.3 msec; readout flip angle = 25° (T1-weighted IR image), 5° (reference), and 15° (T2-weighted image); and image matrix = 256 × 125. The 125 phase encodes were acquired in 5 × 3 = 15 heartbeats, collecting 25 lines per heartbeat with 3 R-R intervals between inversions. The breath-hold included three additional dummy heartbeats that were discarded (18 heartbeats total). The segment duration was approximately 210 msec per R-R interval, acquired during diastasis. Using parallel imaging, the acquisition was reduced to 3 × 3 = 9 heartbeats plus three dummies.
Pulse Sequence
The pulse sequence timing is diagrammed in Fig. 2. Both single-shot True-FISP (10) and segmented Turbo-FLASH sequences (3) are described. The sequences are similar to the PSIR delayed-enhancement sequences (9,14), with the addition of a T2-weighted image. For each slice, imaging was performed in mid-diastole using a prospectively gated acquisition of k-space. IR pulses were applied every third heartbeat to enable the acquisition of 1) a T1-weighted IR image, 2) a reference image used in phase-sensitive image reconstruction, and 3) a T2-weighted image. For segmented or multiple single-shot acquisitions, using three R-R intervals between inversions permits substantial recovery of magnetization in the presence of Gd-DTPA. This minimizes disruption of the steady state due to heart rate variability. For breath-held acquisitions, all images are acquired at the same cardiac and respiratory phases. The reference phase map was acquired using a reduced flip angle readout (9). For single-shot True-FISP, multiple-repetition, motion-corrected, free-breathing acquisitions may be used (14).
Figure 2.
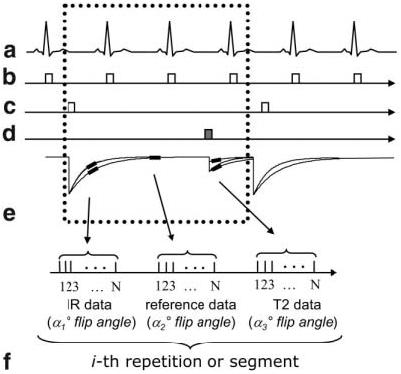
Pulse sequence diagram for MCODE with acquisition of T1-weighted IR data, reference data for phase-sensitive image reconstruction, and T2-weighted data: (a) EKG, (b) R-wave trigger, (c) 180° inversion pulses, (d) T2-preparation, (e) magnetization, and (f) data acquisition (during mid-diastole) for the i-th repetition or segment.
The inversion was performed via a nonselective Silver-Hoult adiabatic pulse (15). The T2-preparation was an iterative Carr-Purcell MLEV sequence (6,7,16) that consisted of a sequence of 90°x, 180°x, 180°x, −180°x, −180°x, −90°x RF pulses with overall duration TE followed by a gradient to spoil the transverse magnetization (RF pulses spaced TE/8, TE/4, TE/4, TE/4, and TE/8). The 180° pulses were composite pulses (90°x, 180°y, and 90°x) to provide more uniform off-resonance behavior (16). The final −90° tip-up pulse was a composite pulse (270°x and −360°x) as well. The T2-weighted signal intensity exp(−TE/T2) is determined (to a first order) by the T2-preparation duration TE. The k-space lines acquired immediately following the T2-preparation are primarily T2-weighted. Subsequent k-space lines have some T1 weighting due to relaxation of the longitudinal magnetization. In the case of a FISP readout with a large readout flip angle, the magnetization has a √T2/T1 dependence at steady state (17), and the T2-weighted image has significant T2 contrast even without T2-preparation.
The True-FISP sequence used a run-up (N = 20 pulses) with linear ramp flip angle to reduce the transient during the interrupted steady-state approach (18). The segmented sequence included a set of three heartbeats of dummy RF pulses to drive the magnetization toward steady state. The reference image was acquired after the magnetization had recovered almost completely. The use of a low flip angle for the reference image reduces the T1 contrast of the reference image.
Parallel imaging was used for acceleration by a factor of 2, by undersampling the phase encodes acquired for the T1- and T2-weighted images. Typically, full resolution corresponded to 128 phase encodes. The phase encodes acquired for the reference image were fully sampled at a lower (1/2) resolution. The reference phase encodes corresponded to a 2× FOV to prevent any wrap in the reference image. Prescan noise was acquired to calculate noise statistics used for optimal array combining (11,19).
Image Reconstruction
A phase-sensitive reconstruction method (9) was used that incorporated optimum B1-weighted phased array combining. A simplified diagram of the reconstruction algorithm is shown in Fig. 3. To improve the SNR of the reference image used for both the background phase estimate and the surface coil intensity correction, the complex images for each coil were optimally combined (B1-weighted sum) (9,19) prior to phase-sensitive detection. The T1-weighted IR image and T2-weighted image were also optimally combined (B1-weighted sum). In the case of accelerated imaging using parallel MR, the T1-weighted IR complex images and T2-weighted complex images were combined using SENSE unmixing coefficients, and the reference image used for the phase map used B1-weighted phased array combining (14). The FOV of the reference image was 2× that of the T1-weighted IR image to ensure that there was no aliasing in the reference image used to compute the SENSE unmixing coefficients, and therefore the spatial resolution of the reference was one-quarter that of the IR image. The phase of the reference image was removed from the T1-weighted IR image on a pixel-by-pixel basis by complex multiplication of the phased-array combined IR image with the conjugate of the phased-array combined reference phase image, as shown in Fig. 3 (9). As a result, the real part of the resultant image preserves the polarity of the IR signal. The surface coil intensity variation was corrected by dividing the IR image with the median filtered reference magnitude image (9). Image reconstruction was performed both online for clinical use and offline from raw data using Matlab software (The Mathworks, Natick, MA, USA) to facilitate accurate SNR measurement.
Figure 3.

Image reconstruction (simplified diagram) for phase-sensitive MCODE with surface coil intensity correction.
Both T1- and T2-weighted images are presented to the user in the same series and may be examined either side by side or by flickering between images in a movie fashion after individual display window-level adjustments are made. Combining images to produce a single image with improved contrast was explored using simple division of the T1-weighted image by the T2-weighted image, as well as principal component analysis (PCA).
CNR Measurement
The CNR between MI and blood was compared for the T1- and T2-weighted images using both segmented turbo-FLASH and single shot true-FISP sequences. The CNR was measured by subtracting the SNR of the MI and adjacent LV blood regions. The images were reconstructed in SNR units (with scaling based on prescan noise) which facilitated SNR measurement (20). The reference image amplitude was used to correct for surface coil intensity variation.
RESULTS
Images and corresponding scatter plots of signal intensities for MI, blood, and normal myocardium regions are shown for three patients with chronic MI, illustrating a range of contrasts between the MI and blood pool from poor to good, in Figs. 4-6. The scatter plots show how the T2 image may be used to distinguish between blood and MI despite the similarity in the T1-weighted intensities. The MI and normal myocardium are easily discerned in the left-hand images (Figs. 4-6) with T1 weighting, while the MI and blood are easily discerned in the right-hand images with T2 weighting. The TrueFISP readout was used in these images.
Figure 4.
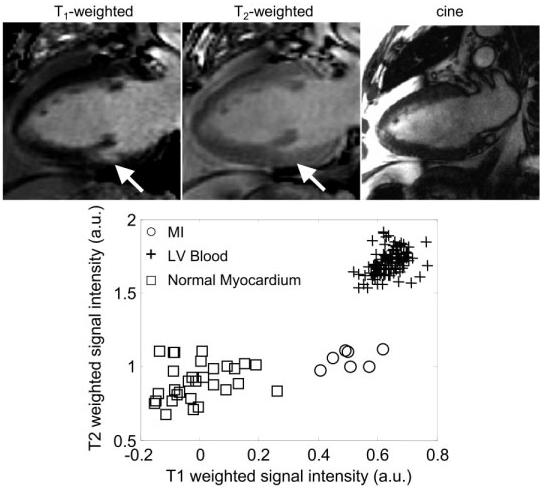
Long-axis images for a patient with a small subendocardial MI, illustrating the case of poor contrast between blood and MI: T1-weighted image (top left), T2-weighted image (top center), cine image (top right) of the same slice prescription at same cardiac phase acquired at a separate breath-hold, and scatter plot of signal intensities for normal myocardium, MI, and blood.
Figure 6.
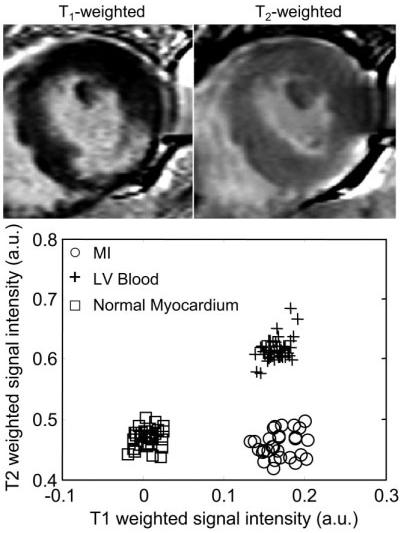
Short-axis images of a patient with an inferolateral MI, illustrating the case of poor contrast between blood and MI: T1-weighted image (top left), T2-weighted image (top right), and scatter plot of signal intensities for normal myocardium, MI, and blood.
The first case (Fig. 4) shows a small subendocardial MI and poor MI-to-blood pool contrast. The MI indicated by an arrow might easily be missed in the T1-weighted image (left) but is easily distinguished from the blood pool by comparison with T2-weighted image (center). The cine image (right) for the same slice and same cardiac phase acquired during a separate breath-hold shows the difficulty of relying on cine to determine the subendocardial border in separate delayed-enhancement acquisitions. It is clear that the slices are not at the same true positions, since the papillary muscle seen in the T1- and T2-weighted images is not seen in the cine image.
The second case (Fig. 5) shows a subendocardial MI (indicated by arrows) in which the lateral wall is clearly thinner on the T1-weighted image than on the T2-weighted image. This is consistent with a thin subendocardial MI, which is otherwise not very evident due to poor blood/MI contrast. A case of inferolateral MI (Fig. 6) with poor contrast between the MI and blood pool is readily discerned in the T1-weighted image due to the shape of the MI. However, one might assume that the endocardial border had a more circular shape if one had only the T1-weighted image, while the T2-weighted image indicates that the center of the infarct is thinned out and has an angular shape. In Figs. 4-6, the signal intensities in the T1-weighted images are approximately the same for the MI and blood pool, as seen in the associated scatter plots, while the signal intensities are distinct in the T2-weighted images. A case with good T1 contrast between the blood and MI is shown in Fig. 7 (TrueFISP case). The T2-weighted image still provides improved discrimination of the subendocardial border between the the MI and blood pool.
Figure 5.
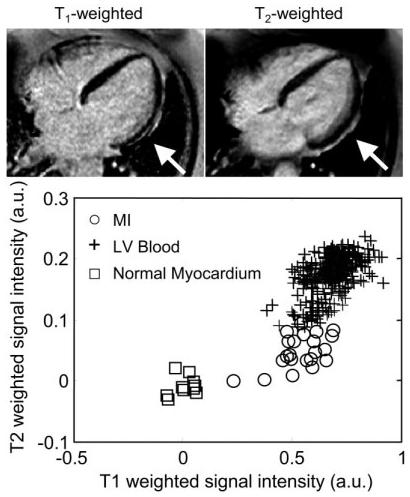
Long-axis images for the second patient with subendocardial MI (lateral wall), illustrating the case of poor contrast between blood and MI: T1-weighted image (top left), T2-weighted image (top right), and scatter plot of signal intensities for normal myocardium, MI, and blood.
Figure 7.
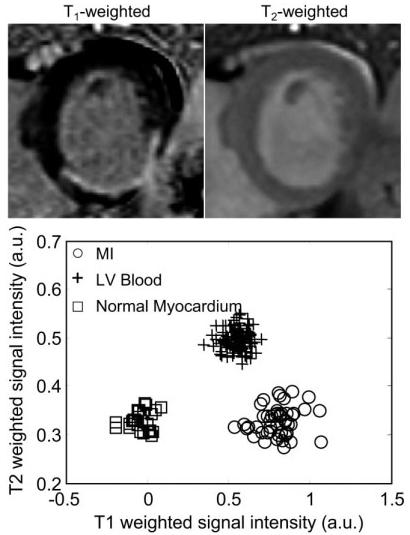
Short-axis images for a patient with a posterior MI, illustrating the case of good contrast between blood and MI: T1-weighted image (top left), T2-weighted image (top right), and scatter plot of signal intensities for normal myocardium, MI, and blood.
The measured MI-to-blood CNR (mean ± SD) was better in the T2-weighted image than in the T1-weighted image (22.5 ± 8.7 vs. 2.9 ± 3.1, N = 11, P < 0.001, for TrueFISP, and 19.4 ± 10.8 vs. 3.9 ± 2.3, N = 11, P < 0.001, for TurboFLASH). A scatter plot of the measured CNR values (Fig. 8) shows that the MI-to-blood CNR for the T2-weighted image was greater than or equal to the CNR for the T1-weighted image in all cases (i.e., above the dotted line representing equality).
Figure 8.
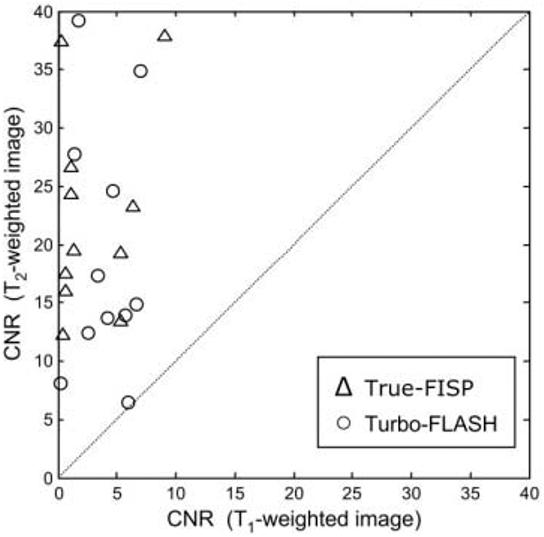
Scatter plot of the measured MI-to-blood CNR for T2-weighted vs. T1-weighted images (N = 11 patients). The CNR for the T2-weighted image was greater than or equal to the CNR for the T1-weighted image in all cases (i.e., above the dotted line representing equality).
DISCUSSION
With the MCODE method, both T1- and T2-weighted images are acquired within the same breath-hold, and may be displayed either side-by-side in separate windows (as in the figures) or in the same window, alternating between images. The latter display method (i.e., flickering between T1- and T2-weighted images) was found to be an effective means of detecting the MI because the images are already registered and the endocardial border becomes readily apparent. Another approach (Fig. 9a) that takes advantage of the inherent image registration is to trace the endo- and epicardial borders on the T2-weighted image and then copy these contours onto the T1-weighted image (TrueFISP example). These contours may also be used for segmentation in conjunction with objective computer-based infarct sizing (21). The T2-weighted image may be amenable to automatic segmentation, which would provide greater automation.
Figure 9.
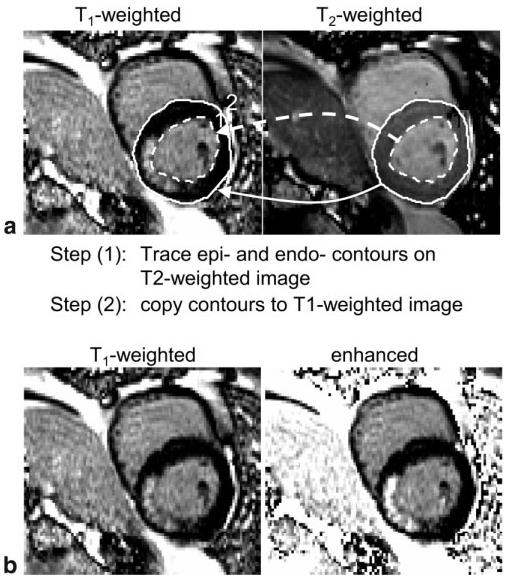
Approaches for visualizing MI. a: Illustration of copying endo- and epicardial contours from a T2-weighted image to a T1-weighted image. b: Illustration of merging T1-and T2-weighted images to create a single image with enhanced blood-to-MI contrast using simple division.
It may be possible to merge the images into a single image with enhanced contrast, but there are also pitfalls with this approach. A simple approach is to divide the T1-weighted image by the T2-weighted image. This has the effect of increasing the signal intensity of the MI proportional to the blood (Fig. 9b). However, when the MI signal intensity is below the blood pool intensity, as in Fig. 4 or 5, the division may actually increase the MI level such that it is closer to that of the blood, thereby reducing the net contrast. Furthermore, any misregistration will lead to artifacts with this approach. More sophisticated schemes, such as PCA, might be appropriate because the three tissue species appear well clustered in the scatter plot. PCA was tried on a couple of cases, but the overall image quality was reduced (e.g., the blood pool was somewhat mottled). Since the merging of both images into a single image entails a loss of information, we feel that it is preferable to display both images. This is an open topic for further investigation.
The multicontrast method was implemented with single-shot or segmented (results not shown) TrueFISP, as well as segmented TurboFLASH sequences. The large number of variables, such as flip angles, preparation times, matrix size, segmentation, and others, leads to a large parameter space that may be further optimized. A comparison of the sequences is beyond the scope of this paper. Several other issues (discussed below) are continuing to be explored.
As shown in the simulations, the T2-weighted image does not have pure T2 contrast, as desired, but includes some T1 contrast due to longitudinal relaxation following the T2-preparation. This may contribute to a loss of contrast between the blood and MI, although this contrast is quite large in the case of chronic MI. The T1 contrast may degrade the ability to measure or assess elevated T2 due to edema, although the T2-weighted images exhibited very little T1 contrast for the chronic cases examined. While the simulations (Appendix) show that a large T2 contrast is achieved even at the elevated T2 values associated with acute MI, these cases remain to be studied experimentally. Another potential variable is the value of T2 in the blood after contrast administration, which may be reduced at very high dosage and may differ between the left and right ventricles due to oxygenation. The residual T1 contrast may be reduced by using a smaller number of views per segment. This results in a longer acquisition, which may be offset by the use of parallel imaging and/or a segmented TrueFISP sequence.
The use of cine images in conjunction with delayed-enhancement images has been cited as a means of addressing the issue of subendocardial MI cases with low contrast between the MI and blood pool (4). Cine images offer excellent resolution and contrast between blood and myocardium, and this technique is often very helpful, although it is sometimes time-consuming to interpret the results due to differences in spatial and temporal resolution. It is also noted that cine and delayed-enhancement images are acquired during separate breath-holds and may have different slice positions, even though the slice prescription is the same, due to differences between breath-holds, as shown in the example of Fig. 4. Even small differences may complicate the interpretation or make it impossible to resolve, since the subendocardial MI may be very narrow or small. The accuracy of the subendocardial border will affect the assessment of transmurality, an important prognostic indicator. This is not to imply that cine imaging is not useful or that one should not use all available data to achieve the best interpretation, but rather to stress potential pitfalls. The proposed MCODE method may be used with a small additional cost in imaging duration to provide an easy first means of enhanced detection, and to determine whether a more complicated analysis is warranted.
For single-shot imaging, there is also an issue of image misregistration even though all images are acquired during the same breath-hold. This arises in cases of imperfect breath-holding, during which there is slight diaphragmatic motion. Unlike the case of Fig. 4, in which there is significant slice motion, there may be a small shift (typically less than a pixel) that may occur between three heartbeats due to a smooth respiratory drift. This may be corrected by rigid body registration, or a simple reacquisition. Since both T1- and T2-weighted images are presented immediately in the same image series and may be displayed alternately as a movie, the user is quickly alerted to any slight misregistration and can take corrective action. This was not deemed to be a problem in the cases examined.
The multicontrast approach using T1- and T2-weighted images has the potential to be extended to the acquisition of full parametric maps. For instance, the single-shot TrueFISP sequence might easily acquire additional image frames with variable parameters. Parametric maps for T1 and T2 have been estimated by measuring the signal intensity with TrueFISP readout following an IR preparation at several values of TI and readout flip angle (22).
In conclusion, MCODE imaging offers a significant improvement in the ability to detect subendocardial MI by providing a T2-weighted image with high contrast between blood and MI. MCODE should improve both the detection and accuracy of sizing of subendocardial MI. MCODE has the potential to enable imaging of edema, which would allow the differentiation of acute vs. chronic MI.
Acknowledgments
Contract grant sponsor: NIH/NHLBI Intramural Research Program.
APPENDIX
A simulation was performed to optimize the readout flip angles and to determine the effects of repeated readouts on the T1 and T2 contrasts. The magnetization of each readout during the IR was calculated according to the methods described by Sekihara (23), using previously measured values for T1 (corresponding to 15 minutes following a double dose) of 230 and 390 msec for MI and normal myocardium, respectively, and 250 msec for blood. The simulation used values for T2 of 50 msec for normal myocardium and 250 msec for blood (12). A range of values of T2 for MI (50–70 msec, at a 5-msec increment) were used, with 50 msec corresponding to chronic MI, and 70 msec corresponding to a value that might be seen with acute MI due to edema (13). The simulation used a TE of 40 msec for the T2-preparation. While a simple analysis using the difference of exponentials shows that the CNR is optimized at longer values of TE (approximately 100 msec), using a TE of 40 msec achieves almost 80% of the optimum CNR but yields a threefold higher SNR in the myocardium, which is useful for segmenting the epicardial border. Simulations were performed for a wide range of parameters for both sequences. Example simulations are shown for both single-shot TrueFISP (Fig. 10a-c) and segmented TurboFLASH (Fig. 10d-f) sequences, with normal myocardium plotted as a bold solid line, blood as a bold dashed line, and MI as normal dashed lines. The imaging parameters followed those used experimentally. The T2 value has no significant effect on the T1-weighted IR. The lower flip angle reference has almost no T1 or T2 contrast, as desired. Both the TrueFISP and Turbo-FLASH readouts have residual T1 contrast in the T2-prepared image that results from the readout. This could potentially be reduced by centric phase-encode ordering or by reducing the number of RF pulses through the use of parallel imaging or a reduced number of views per segment (see Discussion).
Figure 10.
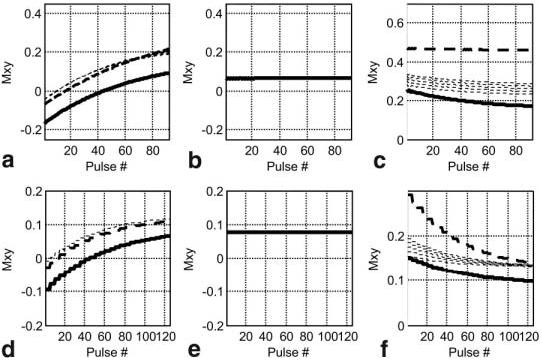
Simulated magnetization for single-shot TrueFISP (a–c) and segmented TurboFLASH (d–f) examples with normal myocardium (solid bold line), MI (dashed lines), and blood (bold dashed line): (a and d) T1-weighted IR data, (b and e) reference data, and (c and f) T2-weighted data. Several values of T2 were used for MI to simulate the expected range from acute to chronic MI due to possible edema.
REFERENCES
- 1.Kim RJ, Fieno DS, Parrish TB, et al. Relationship of MRI delayed contrast enhancement to irreversible injury, infarct age, and contractile function. Circulation. 1999;100:1992–2002. doi: 10.1161/01.cir.100.19.1992. [DOI] [PubMed] [Google Scholar]
- 2.Kim RJ, Wu E, Rafael A, et al. The use of contrast-enhanced magnetic resonance imaging to identify reversible myocardial dysfunction. N Engl J Med. 2000;343:1445–1453. doi: 10.1056/NEJM200011163432003. [DOI] [PubMed] [Google Scholar]
- 3.Simonetti OP, Kim RJ, Fieno DS, et al. An improved MR imaging technique for the visualization of myocardial infarction. Radiology. 2001;218:215–223. doi: 10.1148/radiology.218.1.r01ja50215. [DOI] [PubMed] [Google Scholar]
- 4.Kim RJ, Shah DJ, Judd RM. How we perform delayed enhancement imaging. J Cardiovasc Magn Reson. 2003;5:505–514. doi: 10.1081/jcmr-120022267. [DOI] [PubMed] [Google Scholar]
- 5.Abdel-Aty H, Zagrosek A, Schulz-Menger J, et al. Delayed enhancement and T2-weighted cardiovascular magnetic resonance imaging differentiate acute from chronic myocardial infarction. Circulation. 2004;109:2411–2416. doi: 10.1161/01.CIR.0000127428.10985.C6. [DOI] [PubMed] [Google Scholar]
- 6.Brittain JH, Hu BS, Wright GA, Meyer CH, Macovski A, Nishimura DG. Coronary angiography with magnetization-prepared T2 contrast. Magn Reson Med. 1995;33:689–696. doi: 10.1002/mrm.1910330515. [DOI] [PubMed] [Google Scholar]
- 7.Shea SM, Deshpande VS, Chung YC, Li D. Three-dimensional True-FISP imaging of the coronary arteries: improved contrast with T2-preparation. J Magn Reson Imaging. 2002;15:597–602. doi: 10.1002/jmri.10106. [DOI] [PubMed] [Google Scholar]
- 8.Kellman P, Chung Y, Simonetti OP, McVeigh ER, Arai AE. Multi-contrast delayed enhancement provides improved imaging of sub-endocardial myocardial infarction. J Cardiovasc Magn Reson. 2005;7:84–85. doi: 10.1002/jmri.20426. [DOI] [PMC free article] [PubMed] [Google Scholar]
- 9.Kellman P, Arai AE, McVeigh ER, Aletras AH. Phase sensitive inversion recovery for detecting myocardial infarction using gadolinium delayed hyperenhancement. Magn Reson Med. 2002;47:372–383. doi: 10.1002/mrm.10051. [DOI] [PMC free article] [PubMed] [Google Scholar]
- 10.Chung YC, Vargas J, Simonetti OP, Kim R, Judd R. Infarct imaging in a single heart beat. J Cardiovasc Magn Reson. 2002;4:12–13. [Google Scholar]
- 11.Pruessmann KP, Weiger M, Scheidegger MB, Boesiger P. SENSE: sensitivity encoding for fast MRI. Magn Reson Med. 1999;42:952–962. [PubMed] [Google Scholar]
- 12.Haacke EM, Brown RW, Thompson MR, Venkatesan R. Magnetic resonance imaging: physical principles and sequence design. John Wiley & Sons; New York: 1999. p. 54. [Google Scholar]
- 13.Wisenberg G, Prato FS, Carroll SE, Turner KL, Marshall T. Serial nuclear magnetic resonance imaging of acute myocardial infarction with and without reperfusion. Am Heart J. 1988;115:510–518. doi: 10.1016/0002-8703(88)90798-3. [DOI] [PubMed] [Google Scholar]
- 14.Kellman P, Larson AC, Hsu L, et al. Motion corrected free-breathing delayed enhancement imaging of myocardial infarction. Magn Reson Med. 2005;53:194–200. doi: 10.1002/mrm.20333. [DOI] [PMC free article] [PubMed] [Google Scholar]
- 15.Silver MS, Joseph RI, Hoult DI. Highly selective PI/2 and PI-pulse generation. J Magn Reson. 1984;59:347–351. [Google Scholar]
- 16.Levitt M, Freeman R, Frenkiel T. Supercycles for broadband heteronuclear decoupling. J Magn Reson. 1982;50:157–160. [Google Scholar]
- 17.Scheffler K, Hennig J. T1 Quantification with inversion recovery TrueFISP. Magn Reson Med. 2001;45:720–723. doi: 10.1002/mrm.1097. [DOI] [PubMed] [Google Scholar]
- 18.Deshpande VS, Chung YC, Zhang Q, Shea SM, Li D. Reduction of transient signal oscillations in True-FISP using a linear flip angle series magnetization preparation. Magn Reson Med. 2003;49:151–157. doi: 10.1002/mrm.10337. [DOI] [PubMed] [Google Scholar]
- 19.Roemer PB, Edelstein WA, Hayes CE, Souza SP, Mueller OM. The NMR phased array. Magn Reson Med. 1990;16:192–225. doi: 10.1002/mrm.1910160203. [DOI] [PubMed] [Google Scholar]
- 20.Kellman P, McVeigh ER. Image reconstruction in SNR units: A general method for SNR measurement. Magn Reson Med. 2005;54 doi: 10.1002/mrm.20713. 10.1002/mrm.20713. [DOI] [PMC free article] [PubMed] [Google Scholar]
- 21.Hsu L, Kellman P, Natanson A, Aletras AH, Arai AE. Computer quantification of myocardial infarction on contrast enhanced magnetic resonance imaging; Proceedings of the 12th Annual Meeting of ISMRM; Kyoto, Japan. 2004. Abstract 171. [Google Scholar]
- 22.Schmitt P, Griswold MA, Jakob PM, et al. Inversion recovery True-FISP: quantification of T1, T2, and spin density. Magn Reson Med. 2004;51:661–667. doi: 10.1002/mrm.20058. [DOI] [PubMed] [Google Scholar]
- 23.Sekihara K. Steady-state magnetizations in rapid NMR imaging using small flip angles and short repetition intervals. IEEE Trans Med Imaging. 1987;6:157–164. doi: 10.1109/TMI.1987.4307816. [DOI] [PubMed] [Google Scholar]


