Abstract
A series of solenoidal NMR probes were built to measure T1 and T2 relaxation times in vivo in the mouse, over the frequency range of 5 to 60 MHz, using inversion-recovery and spin-echo pulse sequences. KHT tumors growing in the legs of C3H mice were studied and compared with normal mouse legs. The tumor relaxation times were studied at 10 MHz during the course of tumor growth and as a function of frequency when the tumor had a mass of approximately 0.9 g. Mouse legs with tumors have higher T1 and T2 values than those without tumors over the frequency range of 5 to 60 MHz. Significant changes in both relaxation times were detected before a palpable mass could be detected. T1 contrast between normal and tumor-bearing legs decreased with increasing frequency, while T2 contrast remained nearly constant. A comparison between in vivo and in vitro measurements was done using four different types of sample preparation: live mouse, dead mouse, excised whole mouse leg, and tissue sample. These studies showed small but significant differences between the relaxation times measured in vivo and those measured in vitro.
INTRODUCTION
Relaxation times are the most important parameters governing signal contrast in nuclear magnetic resonance imaging, often forming the basis of discrimination between different types of tissue. The spin-lattice relaxation time (T1) and the spin-spin relaxation time (T2) can vary by an order of magnitude from tissue to tissue and depend as well on the magnetic field strength (1-3), which, in currently available imaging systems, also varies over an order of magnitude from approximately 0.15 to 1.5 T. Present day NMR imagers are designed, however, to operate at a single magnetic field strength. Designing optimal imagers and pulse sequences requires, therefore, knowledge of the relaxation times of the tissues to be discriminated, and knowledge of the field dependence of T1 and T2.
The major advantage of using magnets with higher fields is an improvement in the signal to noise (S/N) ratio. In an NMR experiment, the net magnetization is directly proportional to the magnetic field strength and for a given magnetization, the induced voltage in the receiver is proportional to the Larmor frequency, resulting in a signal strength that increases as the square of the frequency. Noise, however, also increases with frequency. For a constant fractional bandwidth and no degradation of the receiver electronics, the noise increases as the 1/2 power of the frequency, resulting in a gain in the S/N proportional to the 3/2 power of the frequency (4, 5). Under other assumptions (e.g., constant absolute bandwidth and degradation of the receiver due to increased impedance of the receiver), Hoult has derived a S/N ratio which is proportional to the 7/4 power of the frequency (6). In either case, one would expect that for a twelvefold increase in frequency (e.g., from 5 to 60 MHz), a S/N increase between 42 and 77. This increase can be expended for either better resolution or decreased imaging times. There are, however, other factors that must be considered besides the improved S/N. First, increased T1 relaxation times require longer imaging times to achieve analogous sequences. Second, although absolute signal strength may increase, signal contrast between two tissues may not. And third, the attenuation of radiofrequency transmission into and out of the sample at higher frequencies will eventually present a fundamental limit.
We have examined the NMR relaxation behavior of both normal and tumor-bearing tissues in the legs of mice with in vivo measurements over the frequency range of 5 to 60 MHz. We have also measured the variation of T1 and T2 with the growth of a tumor. Like other investigators (7-12), we have observed elevated relaxation times in tumors relative to normal tissues.
The experiments were performed in vivo, to avoid the controversial practise of applying in vitro data to in vivo imaging. Barroilhet (13 has argued for the need to perform in vivo measurements of relaxation times. He found that the T1 value of externalized mouse liver in vivo was different than the T1 value of stabilized liver samples in vitro. Nonetheless, several experimenters (14-16) have continued with in vitro determinations of relaxation times, thereby contributing to data presently being applied to questions that arise in NMR imaging. The question remains, however, as to whether T1 and T2 are the same in a live animal as in a biopsied sample. Therefore, we have carried out experiments with mice using four stages of sample preparation: live animals, dead animals, removed legs, and biopsy tissue samples, to ascertain the validity of applying in vitro data in the imaging situation.
METHODS
(a) Probe Design
Solenoidal probes with a diameter of 18 mm were designed to give local measurements of T1 and T2 in vivo in the hind legs of mice, as shown in Fig. 1. A series of probes, each tuned to a narrow range of frequencies, were built to measure relaxation times at Larmor frequencies between 5 and 60 MHz. These probes required a novel design because we wished to make measurements on a specific region of the mouse leg (gastrocnemius muscle) while the rest of the leg extended outside the physical limits of the windings. The NMR signal response (i.e., the amplitude of the free induction decay from a point sample) was minimized outside the limits of the coil and kept reasonably constant inside by overwinding the coil at its extremities. A typical coil winding pattern and response curve is shown in Fig. 2. The response R at axial position d is calculated using
| [1] |
where B1 is the normalized radiofrequency field strength (B1(0) = l), which is proportional to the sensitivity of the coil to external dipoles, and θ is the tip angle at the center of the coil, caused by the rf field pulse. The position d = 0 is located at the center of the coil. The sine term in Eq. [l] specifies the component of the magnetization at position d which lies in the xy plane and contributes to the detected signal. The experimental points in Fig. 2 correspond to the signals measured following a π/2 pulse, from a cylinder of glycerol (0.5 cm long, 0.5 cm diameter) located at various points along the axis of the probe, and agree well with the calculated response.
FIG. 1.
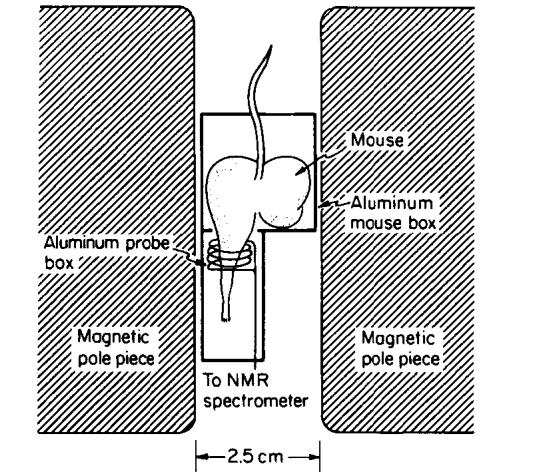
The in vivo NMR assembly, showing the mouse constrained within an aluminum box, with one leg protruding into the rf coil, and held in place with skin tape. The coil itself was contained within an aluminum box. The mouse box was kept warm with a small heating element, and the temperature was monitored with a thermistor.
FIG. 2.
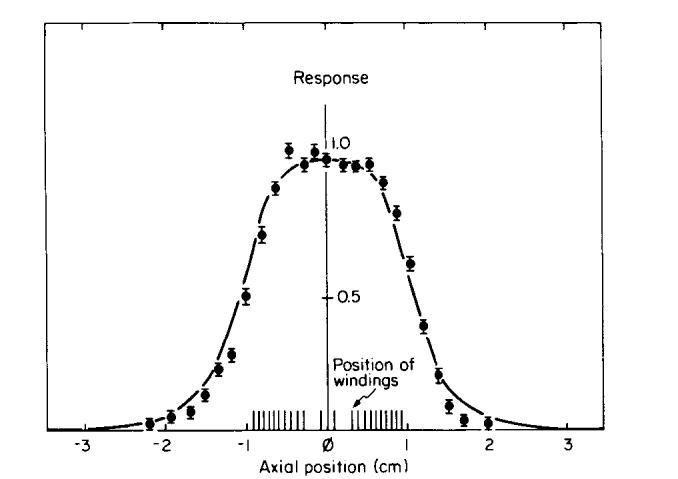
A response curve for a typical coil design. The data points are measured signals following a π/2 pulse from a 0.5 cm thick sample of glycerol positioned at various points along the axis of the coil. The error bars represent the standard deviation from four such measurements. The solid curve is the predicted response from Eq. [1]. The coil winding pattern is shown on the horizontal axis.
Even though the response curve of Fig. 2 is reasonably uniform within the coil, a nonzero signal is detected from tissue extending beyond the coil limits. If a short sample (i.e., one which does not extend beyond the windings) is used in the center of the coil, the applied rf pulse will tip all of the spins in the sample the same angle relative to the external field; the so-called π/2 pulse will tip all the spins through an angle of 90°, resulting in maximum net transverse magnetization, and therefore maximum induced voltage. However, if a long sample (one which extends beyond the windings) is used, the net transverse magnetization will be a maximum when spins in the center of the coil are slightly overdriven (i.e., tipped more than 90° relative to the external field), allowing for more distant spins to contribute a larger transverse component. We have named such a pulse a pseudo π/2 pulse because of the distribution of tip angles that it produces throughout a long sample. Similarly, a pseudo π pulse is one giving a null signal, and causes the spins to be tipped in such a way as to produce cancellation of all response in Eq. [1].
Computer calculations were done using Eq. [1] and a typical coil winding pattern to determine the values of θ that pseudo π/2 and π pulses gave in a cylindrical sample of semi-infinite length. Maximum and minimum values of R were determined by numerical integration of Eq. [l] over the sample, using values of θ in the range 0 < θ < 2π. From these calculations, it was found that values of θ equal to ∼100 and ∼220° were needed for pseudo π/2 and π pulses, respectively.
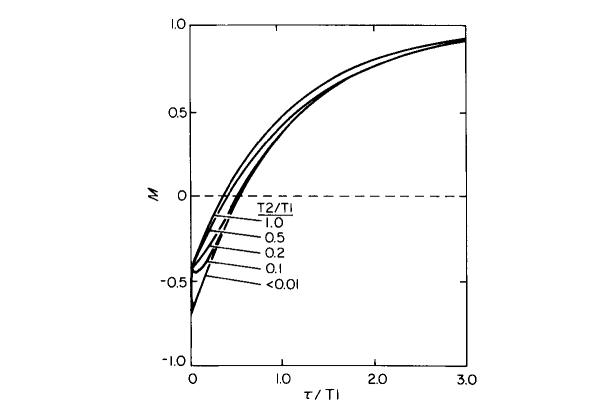
These nonideal tip angles do not introduce significant errors into the measurements of relaxation times. Computer simulations of T1 inversion-recovery experiments were made using this coil design and a uniform linear sample of infinite extent, and are shown in Fig. 3. The simulations also took into account the effects of transverse relaxation and phase relationships between the π and π/2 pulses; simulations were done with various values of T2/T1 and with the π/2 pulse either parallel to or perpendicular to the π pulse in the rotating frame of reference. In all simulations, the signal was determined by summing the y components for all values of d in the response function defined by Eq. [1], immediately following the π/2 pulse. In simulations of a T1 experiment, a pseudo π/2 pulse was applied along the x axis in the rotating frame of reference. Then, the transverse and longitudinal components were allowed to relax for a time τ and a pseudo π/2 pulse was applied along the same axis. If τ ≫ T2, there will be complete dephasing of the magnetization in the xy plane, and the π/2 pulse will act on only the component of magnetization along the static magnetic field direction. This is shown in the lowest curve of Fig. 3. On the other hand, if τ (the time between the π and π/2 pulses) is <T2, a coherent pseudo π/2 pulse will flip the remaining transverse component, which will introduce a T2 weighting to the inversion-recovery data. This situation is shown in the upper curves of Fig. 3. If T2 = T1, as shown in the top curve of Fig. 3, then the entire T1 relaxation curve is T2 weighted, but accurately reflects T1. Intermediate values of T2/T1 generate intermediate curves. It should be noted from Fig. 3 that the transients near the time zero points of the relaxation curves are most pronounced for T2/T1 near 0.1, and become negligible for T2/T1 ratios near 0 or 1.
FIG. 3.
Simulation of T1 inversion-recovery experiments using an infinitely long sample extending through the mouse probe. The lower relaxation curve results when T2 ≪ T1 while the upper curve is for the case T2 = T1. Intermediate values of T2/T1 generate intermediate curves. The curve for T2/T1 = 0.1 approximates the experimental conditions when mouse legs are measured.
In the second type of simulation (not shown), the two pulses are incoherent; the π pulse is applied along the y direction and the π/2 pulse is applied along the x direction. In this case, the T1 relaxation curve is not weighted by T2, and represents the best possible experimental phase setting.
For the tissues studied in this paper, T2 is less than 0.15 T1. Under this constraint and the worst possible phase conditions (i.e., π and π/2 pulses along the same axis), a one-component exponential fit to a simulated data set gives agreement with the true T1 to better than 5% provided data points were not collected for τ < 0.5T2. Similar simulations were also done for T2 spin-echo experiments and one-component exponential fits to these data sets agree within 12% to the true T2. To corroborate these results, actual NMR experiments were performed using long samples of solution with T2/T1 ∼ 0.4. These experiments showed that measured values of T1 and T2 did not differ from true T1 and T2 (obtained with small samples) by more than 7%. Therefore, relaxation time measurements for a sample that extends beyond the radiofrequency coil are accurate to ∼5% for T1 measurements and ∼7% for T2 measurements, provided data points near the beginning of the relaxation curve are excluded from the analysis. It should be noted here that this analysis is completely parallel to the situation of relaxation time measurements in a slice that has been specified by selective excitation. Also, Eq. [1], which is used here to describe the response from a long sample in a nonuniform B1 field, is similar to the response functions used in studies with surface coils (17).
(b) Sampling and Data Analysis
Measurements were made with a Bruker1 spectrometer (Model BKR 622s), which spans a proton frequency range of 4 to 60 MHz, and has a 2.5 cm magnet gap adequate to receive a mouse. We have improved the magnet stability to <1 ppm per hour without a proton lock and have achieved a field homogeneity of better than 10 ppm over the sample without the use of shim coils. The receiver was interfaced to a PDP-11/402 computer with a 12 bit analog to digital converter (ADC) for data collection and rapid calculation and display of relaxation time curves.
T1 relaxation data were collected using inversion-recovery (π-τ-π/2) pulse sequences. π and π/2 pulses widths were adjusted to obtain minimum and maximum signals, respectively, and for mouse legs, a pulse width of 10 to 20 μsec gave a maximum signal. For T1 experiments, digitization of the post-π/2 FID (at time τ commenced following the 600 μsec receiver dead time, and then proceeded at a rate of 40 μsec/point. Sixteen consecutive points were averaged to reduce high-frequency noise on the FID. The set of averaged points, obtained with increasing values of τ, were saved for computer analysis.
T2 relaxation data were collected using repeated spin-echo (π/2-τ-π) pulse sequences. Sixteen consecutive data points were digitized at time 2τ following the pseudo π/2 pulse, at which point the spin echo was at its maximum amplitude. These points were averaged to yield a single point on the T2 relaxation curve.
For the experiments reported here, the time range of the data extended over at least 2.5 relaxation times, allowing for >92% of the transverse or longitudinal magnetization to return to equilibrium (Fig. 4). A time interval of at least 5T1 separated consecutive pulse sequences to allow for more than 99% of the longitudinal magnetization to return to equilibrium. At least 13 averaged data points per relaxation time were acquired, and data sets contained from 40 to 100 points. Decay curves were analyzed using a multiexponential analysis computer program developed by S. Provencher (18). This program requires no a priori estimates of relaxation times or baseline values. Although the analysis occasionally yielded two-component exponentials as the statistically best fit, such fits were not reproducible and the analysis was restricted to single exponentials (which gave consistent results). A typical T1 relaxation curve with a single exponential fit is shown in Fig. 4.
FIG. 4.
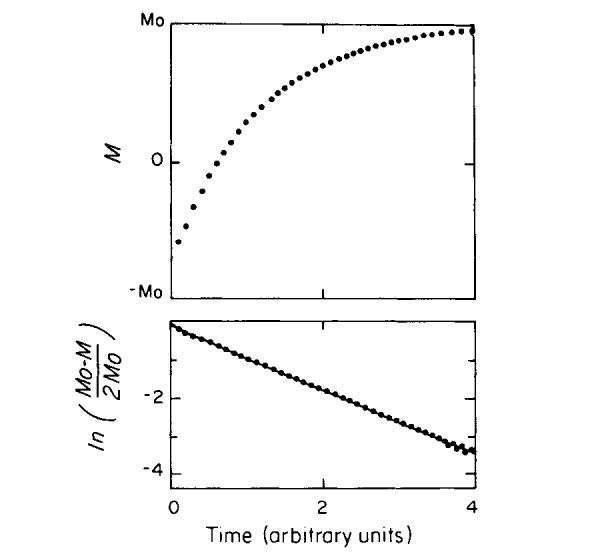
A typical relaxation curve from an inversion-recovery experiment is shown in the upper graph. The logarithmic transformation of the data and computer fit is shown in the lower graph. The relaxation time is related to the slope of the line through the points. The data shown spans ∼3 relaxation times.
(c) Mouse Care and Sample Preparation
Eight to fourteen week old male C3H/HeJ mice were used in these experiments. During the course of the NMR experiments, the mice were caged in groups of no more than four, keeping tumor-bearing and normal mice segregated, and were provided with food and water ad libitum. The tumor used was a transplantable, soft tissue sarcoma and has been designated the KHT sarcoma (19). Mice for tumor experiments were injected with ∼3 × l05 KHT cells intramuscularly in the left hind leg, giving a tumor-bearing leg 11-12 mm in diameter (a tumor mass of 0.7-0.9 g) (22) after 9 days. For tumor growth experiments, relaxation times were measured at the same time each day at a frequency of 10 MHz. Frequency-dependence experiments were carried out on mice in their ninth day of tumor growth. During relaxation time measurements, the mice were immobilized in an aluminum box that allowed only the left hind leg to protrude, as shown in Fig. 1. The leg was inserted into the probe and held in place with skin tape. Visual inspection through small windows in the probe box ensured that identical segments of the mouse legs were always positioned in the center of the coil. The mouse box was maintained at a temperature of 22°C to prevent chilling the mice.
Samples for the in vitro/in vivo comparison were prepared as follows: T1 and T2 of live mouse legs were measured as described above. Two healthy mice were then asphyxiated with 100% C02 and T1 and T2 were measured using the intact animal over a period of 3 hr following death. Two healthy mice were sacrificed by cervical dislocation and the whole legs were immediately removed. T1 and T2 measurements were then done on these legs, during the 12 hr period immediately following death, at regular 8 min intervals. The removed legs were stored inside an open probe at room temperature for these measurements. No precautions were taken to prevent bleeding; however, excessive blood loss was not observed. Small samples were also prepared from biopsied tissue obtained from the pertinent region of healthy mouse legs, and were analyzed within 3 hr following death.
RESULTS
Tumor growth experiments were carried out at a frequency of 10 MHz. Four mice injected with tumor cells were monitored over a 10 day period following injection. T1 and T2 measurements were compared to those from four healthy mice. Figures 5 and 6 show the variation of T1 and T2, respectively, measured as a function of time following tumor cell injection. Figures 5 and 6 also show that the measured values of T1 and T2 of the “normal” right legs of tumor-bearing mice did not change with tumor growth in the left legs, suggesting the absence of systemic effects found in other studies (21). The error bars in Figs. 5 and 6 denote the estimated standard deviations of relaxation time measurements (5% for T1 and 7% for T2, obtained from the simulations), which are larger than the standard deviations of more than 125 measurements made with eight healthy mice, and 30 measurements made with eight tumor-bearing mice. Significant increases in T1 and T2 begin to appear on the third day following injection, before a palpable tumor mass could be detected. T1 increases by approximately 70% above its normal value by the tenth day and T2 doubles over the same time period.
FIG. 5.
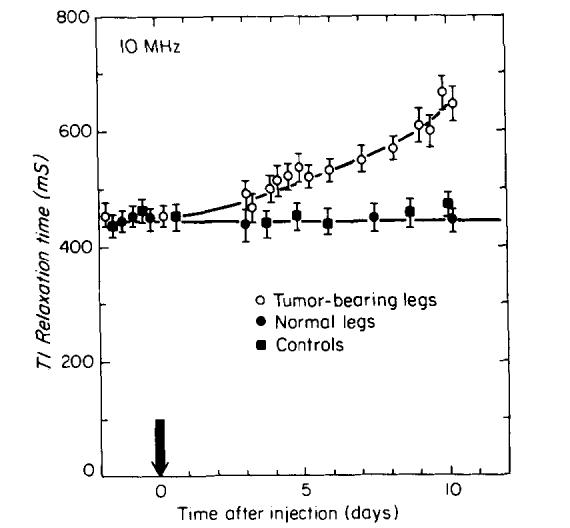
T1 of tumor-bearing legs as a function of time following injection. The time of injection is indicated by the arrow. The error bars show the estimated 5% standard deviation for T1 measurements. The solid squares are measurements taken from the right legs of tumor-bearing mice. The solid circles are measurements taken from normal mice.
FIG. 6.
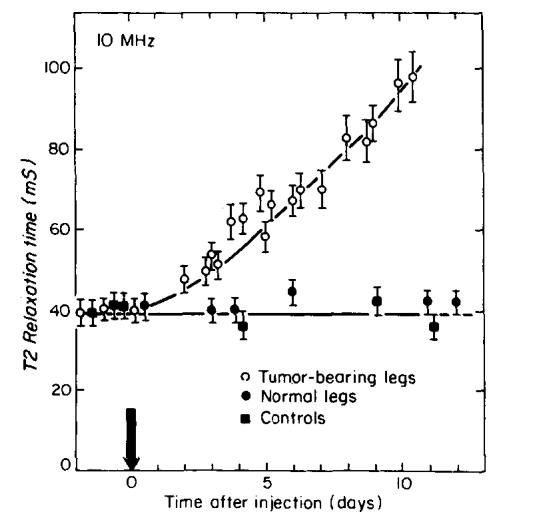
T2 of tumor-bearing legs as a function of time following injection. The time of injection is indicated by the arrow. The error bars show the estimated 7% standard deviation for T2 measurements. The solid squares are measurements taken from the right legs of tumor-bearing mice. The solid circles are measurements taken from normal mice.
Frequency dependence data was obtained using two mice in Day 9 of tumor growth and four healthy mice. The Day 9 tumor-bearing legs were large, measuring 12 +/- 1 mm in diameter (a 0.9 g tumor), compared to a normal leg diameter of 7 +/- 1 mm. As shown in Figs. 5 and 6, the tumors at this point of growth produce large changes in the measured values of T1 and T2. Data from frequency-dependence experiments are shown in Figs. 7 and 8. Both T1 and T2 of tumor-bearing legs were consistently higher than normal legs at all frequencies. T1 of normal and tumor-bearing legs increased with increasing frequency; however T2 of both normal and tumor-bearing legs remained nearly constant over the frequency range studied.
FIG. 7.
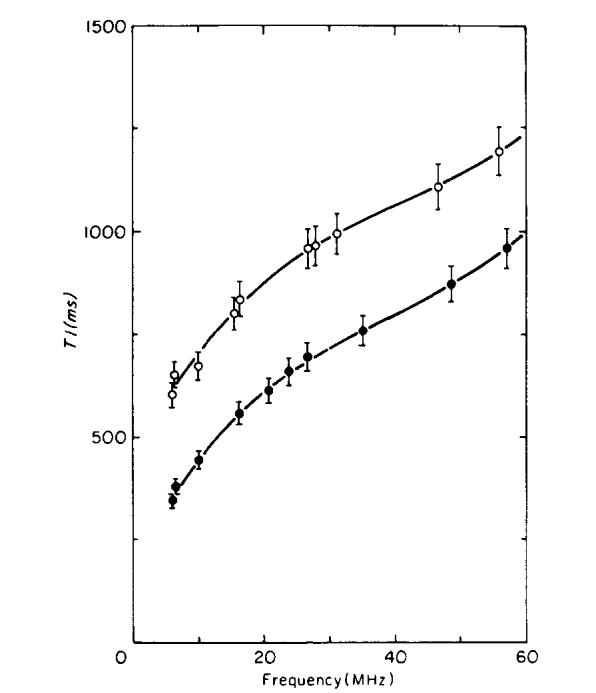
T1 vs frequency for normal and tumor-bearing legs. The open circles show T1 for tumor-bearing legs; the solid circles for normal mice. The error bars show the estimated 5% standard deviation in the measurements. The solid curves are fits to the data using polynomials of degree three.
FIG. 8.
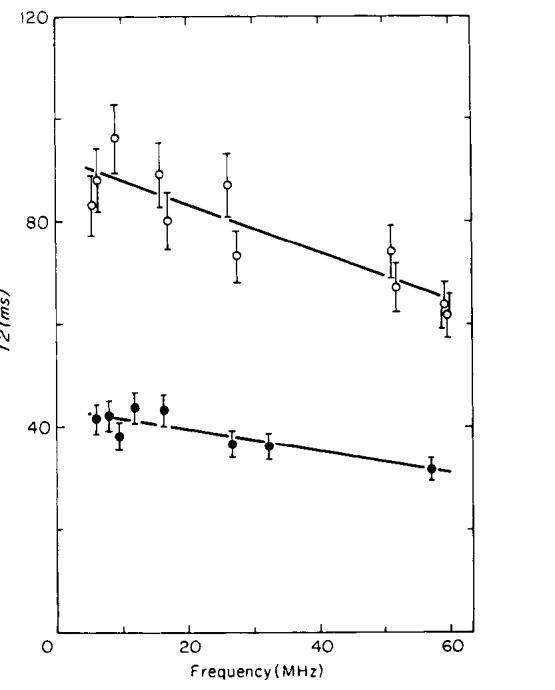
T2 vs frequency for normal and tumor-bearing legs. The open circles show T2 for tumor-bearing legs; the solid circles for normal mice. The error bars show the estimated 7% standard deviation in the measurements. The solid curves are fits to the data using polynomials of degree one.
The data in Figs. 7 and 8 were fit with polynomials and the resulting fits were used to determine the relative difference (contrast) between the relaxation times of the normal and tumor-bearing legs. Two models were tested. The first model assumed that the tumor relaxation times were the normal relaxation times shifted by a constant:
| [2] |
| [3] |
where FN and FT are the polynomial fits to the normal relaxation times and tumor relaxation times, respectively, in Figs. 7 and 8, ν is the frequency, and k is a constant.
The second model assumed that the tumor and relaxation curves were independent (i.e., k a function of ν):
| [4] |
| [5] |
The first model using the constant k did not give an acceptable fit to the data. The second model gave good fits with polynomials of degree three for the T1 data and of degree one for the T2 data. Percentage increases of T1 and T2 (contrast) for tumor-bearing legs relative to normal legs are shown in Fig. 9. The curves in Fig. 9 are defined by (FT - FN)/FN, using Eqs. [4] and [5]. The T2 contrast remains nearly constant from 5 to 60 MHz at a value slightly above 100%, while T1 contrast decreases from 71 % at 5 MHz to 20% at 60 MHz.
FIG. 9.
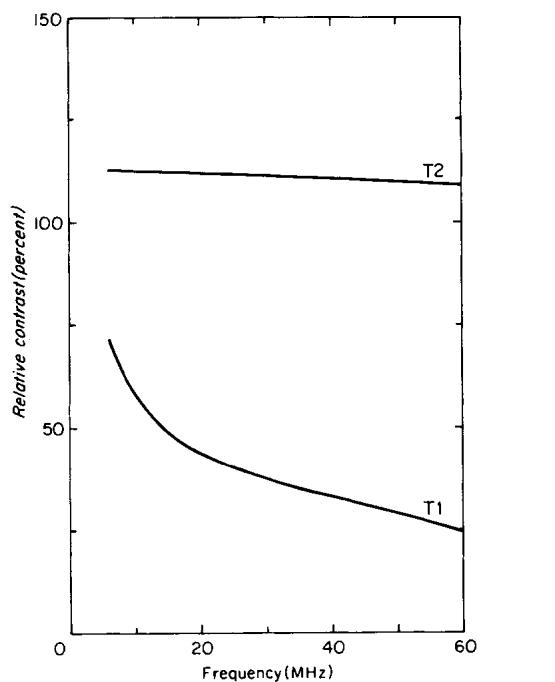
Relative differences (contrast) in T1 and T2 between normal and tumor bearing legs, as a function of frequency; upper curve: T2, lower curve: T1. The curves are generated from the polynomial fits shown in Figs. 7 and 8.
There are significant differences between the mean values for excised muscle up to 12 hr after death and all of the other sample preparations shown in Fig. 10 (p < 0.05). T1 of excised legs is generally less than T1 of other sample preparations, and decreases slightly with time following death, as shown in Figs. 10c-g (left).
FIG. 10.
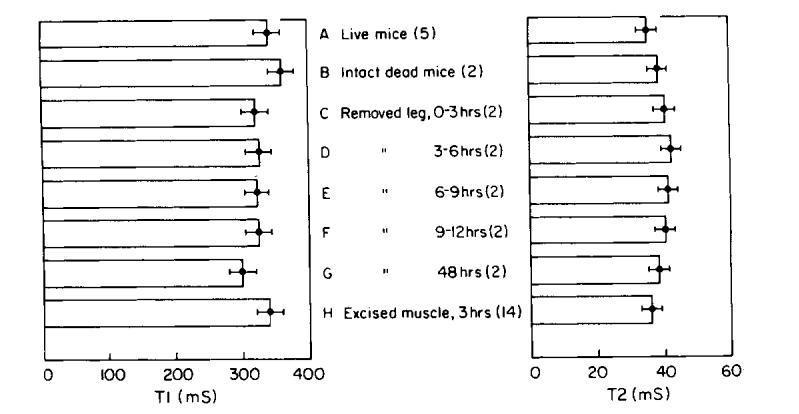
Results from in vivo and in vitro experiments at 6 MHz. (A) live mice; (B) intact, dead mice; (C-F) removed legs measured from death to 12 h following death, over consecutive 3 h intervals; (G) removed legs measured 48 h following death; (H) muscle tissue samples from legs, measured within 3 h after death. Error bars represent standard deviation from 25-40 experiments. Five mice were used for A, 2 mice for B-G, and 14 for H.
DISCUSSION
Increases in T1 and T2 in our experiments can be attributed to the presence of a tumor. We have found that by the third day of tumor growth, significant changes in T1 and T2 appear even before a palpable tumor can be detected. This suggests that NMR is a sensitive tool in the early detection of cancer.
The frequency dependence of relaxation times and contrast may play an important role in determining optimum imaging strategies for the detection of certain disease states. Koenig has measured T1 of normal mouse tissues in vitro over the frequency range of 0.01 to 100 MHz (3). He has described the T1 dispersion using a Cole-Cole analysis, which considers the relaxation rate 1/T1 as a function of log frequency. Our data from experiments with normal legs is consistent with that of Koenig, demonstrating a similar behavior over the limited frequency range we have studied. It should be noted here that this similarity exists for both data obtained in vivo and in vitro in normal mice, making the much simpler in vitro dispersion analysis preferable. However, in vivo measurements of tumor growth has the advantage that the same tumor can be analyzed from day to day, thereby simplifying time course studies, and minimizing mouse-to-mouse variability in the data.
An important parameter in the use of NMR to detect cancer is the percentage increase in T1 or T2 between tumor and normal tissue. For the KHT tumor, maximum T1 contrast was observed at frequencies near 5 MHz, and decreased with increasing frequency. The T1 contrast values are significantly higher at the lower frequencies. This is supported by the fact that the relaxation models discussed earlier failed unless the constant k was a function of frequency. On the other hand, T2 contrast decreased only slightly with increasing frequency, and always remained higher than 100% over the frequency range studied. These two points favor the use of high frequencies for T2-dependent imaging sequences for tumor differentiation because of the increased S/N, and suggest that T2 may prove to be a much more important parameter for cancer detection than T1.
We carried out our experiments in vivo because we expected to find differences between in vivo and in vitro relaxation times, as reported by other experimenters. Significant changes between the relaxation times of samples in vivo and in vitro were detected. Barroilhet observed a marked multicomponent T1 behavior with in vivo experiments, which was much less evident in vitro, and therefore argues for the need for in vivo determinations of relaxation times (13). Pearson has shown that T1 and T2 porcine muscle samples in vitro may vary with time as muscle rigor appears and attributes differences in these changes to the prior condition of the living muscle, the degree of exhaustion and the state of nutrition (20). Our experimental data were not obtained with sufficient signal to noise to distinguish fine detail in multiexponential curves, and therefore reflects weighted averages of relaxation times in tissue that may truly exhibit multiexponential behavior. However, multiexponential discrimination is unlikely to be a feasible option in NMR imaging because of the need for further data acquistion to resolve the exponential components, making imaging time a prohibitive factor. Our in vitro measurements of bulk, single component relaxation times differ slightly from in vivo measurements of the same tissues; however, our measurements are of much greater accuracy than similar measurements from an NMR imager. Therefore, for bulk measurements of single component relaxation times, both in vivo and in vitro measurements provide quantitative measurements applicable to in vivo NMR imaging.
CONCLUSIONS
NMR is highly sensitive in the detection of KHT tumors in mice in vivo. The spin-spin relaxation time T2 gives higher tumor-to-normal tissue contrast than T1 over the entire frequency range of 5 to 60 MHz. T1 and T2 contrast is highest at 5 MHz (the lowest frequency studied), and decreases with increasing frequency. A comparison between in vivo and in vitro data shows significant differences between relaxation times of live tissue and fresh tissue samples.
ACKNOWLEDGMENTS
The support of the Medical Research Council of Canada, the National Cancer Institute of Canada, the Ontario Cancer Treatment and Research Foundation, and the Ministry of Health of the Province of Ontario is gratefully acknowledged. R. M. Kroeker was supported by a Medical Research Council of Canada studentship. E. R. McVeigh held a 1983 Harold E. Johns summer studentship.
Footnotes
W. Germany Bruker Analytik GMBH, Silberstreifen, D-7512, Rheinstetten 4-Fo.
Digital Equipment Corporation, Maynard, Mass.
REFERENCES
- 1.BLOEMBERGEN N, PURCELL EM, POUND RV. Phys. Rev. 1948;73:679. [Google Scholar]
- 2.HELD G, NOACK F. Z. Naturforsch. C. 1973;28:59. [PubMed] [Google Scholar]
- 3.KOENIG SH, BROWN RD, III, ADAMS D, EMERSON D, HARRISON CG. Invest. Radiol. 1984 doi: 10.1097/00004424-198403000-00002. in press. [DOI] [PubMed] [Google Scholar]
- 4.ABRAGAM A. The Principles of Nuclear Magnetism. Oxford Univ. Press; (Clarendon), Oxford: 1961. pp. 82–83. [Google Scholar]
- 5.HILL HDW, RICHARDS RE. J. Phys. E. 1968;1:977. [Google Scholar]
- 6.HOULT DI, RICHARDS RE. J. Magn. Reson. 1976;24:71. doi: 10.1016/j.jmr.2011.09.018. [DOI] [PubMed] [Google Scholar]
- 7.DAMADIAN R. Science. 1971;171:1151. doi: 10.1126/science.171.3976.1151. [DOI] [PubMed] [Google Scholar]
- 8.HOLLIS DP, SARYAN LA. Johns Hopkins Med. J. 1972;131:441. [PubMed] [Google Scholar]
- 9.FLOYD RA, LEIGH JS, CHANCE B, MIKO M. Cancer Res. 1974;34:89. [PubMed] [Google Scholar]
- 10.FUNG FM. Biochim. Biophys. Acta. 1974;362:209. doi: 10.1016/0304-4165(74)90042-7. [DOI] [PubMed] [Google Scholar]
- 11.WEISMAN ID, BENNETT LH, MAXWELL LR, SR., WOODS MW, BURK D. Science. 1972;178:1288. doi: 10.1126/science.178.4067.1288. [DOI] [PubMed] [Google Scholar]
- 12.COLES BA. J. Nut. Cancer Inst. 1976;57:389. doi: 10.1093/jnci/57.2.389. [DOI] [PubMed] [Google Scholar]
- 13.BARROILHET LE, MORAN PR. Med. Phys. 1975;2:191. doi: 10.1118/1.594177. [DOI] [PubMed] [Google Scholar]
- 14.LING CR, FOSTER MA. Phys. Med. Biol. 1982;27:853. doi: 10.1088/0031-9155/27/6/006. [DOI] [PubMed] [Google Scholar]
- 15.BAKKER CJG, VRIEND J. Phys. Med. Biol. 1983;28:331. doi: 10.1088/0031-9155/28/4/001. [DOI] [PubMed] [Google Scholar]
- 16.FUNG BM, PUON PS. Biophys. J. 1981;33:27. doi: 10.1016/S0006-3495(81)84870-9. [DOI] [PMC free article] [PubMed] [Google Scholar]
- 17.HAASE A, HÄNICKE W, FRAHM J. J. Magn. Reson. 1984;56:401. [Google Scholar]
- 18.FROVENCHER SW. Biophys. J. 1976;16:27. doi: 10.1016/S0006-3495(76)85660-3. [DOI] [PMC free article] [PubMed] [Google Scholar]
- 19.KALLMAN RF, SILINI G, VAN PUTTEN LM. J. Nut. Cancer Inst. 1967;37:539. [PubMed] [Google Scholar]
- 20.PEARSON RT, DUFF ID, DERBYSHIRE W, BLANSHARD JMV. Biochim. Biophy. Acta. 1974;362:188. doi: 10.1016/0304-4165(74)90040-3. [DOI] [PubMed] [Google Scholar]
- 21.BEALL PT, MEDINA D, CHANG DC, SEITZ PK, HAZELWOOD CF. J. Nut. Cancer Inst. 1977;59:1431. doi: 10.1093/jnci/59.5.1431. [DOI] [PubMed] [Google Scholar]
- 22.HILL RP, KALLMAN RF, SIEMANN DW. In: Methods in Tumor Biology: Tissue Culture and Animal Tumor Models. Sridhar R, editor. Dekker, New York: to be published. [Google Scholar]


