Abstract
A mathematical analysis of ghosting artifacts often seen in interleaved echo-planar images (EPI) is presented. These artifacts result from phase and amplitude discontinuities between lines of k-space in the phase-encoding direction, and timing misregistrations from system filter delays. Phase offsets and time delays are often measured using “reference” scans, to reduce ghosting through post-processing. From the expressions describing ghosting artifacts, criteria were established for reducing ghosting to acceptable levels. Subsequently, the signal-to-noise ratio (SNR) requirements for estimation of time delays and phase offsets, determined from reference scans, was evaluated to establish the effect of estimation error on artifact reduction for interleaved EPI. Artifacts resulting from these effects can be reduced to very low levels when appropriate reference scan estimation is used. This has important implications for functional MRI (fMRI) and applications involving small changes in signal intensity.
Keywords: MRI, artifacts, reconstruction, EPI, functional imaging
INTRODUCTION
Rapid-imaging techniques such as interleaved echo planar imaging (EPI), gradient echo and spin echo (GRASE), and fast spin echo (FSE) have been important developments in ultrafast MRI techniques. These applications are essential for capturing physiological information with high-time resolution and good image quality. These techniques however, often suffer from artifacts not normally present with standard spin-warp imaging. Discontinuities in the phase-encoding direction such as amplitude modulations, constant-phase shifts, and echo-timing misregistrations due to system delays, can result in significant “ghost” artifacts that seriously compromise image quality (1).
For applications such as functional MRI (fMRI), the high temporal resolution offered by EPI, FSE, and GRASE is often necessary to track changes in signal enhancement dependent on blood oxygen level dependent (BOLD) (2, 3) or endogenous flow contrast with spin labeling (4-6). However, with 1–2% changes in signal intensity, even low-intensity artifacts can seriously affect quantitative estimates of flow or oxygenation. In addition, high spatial resolution (<1 × 1 mm) is required in fMRI to differentiate brain parenchyma from large vessels (D. LeBihan, personal communication), necessitating the use of interleaved techniques to prevent spatial resolution degradation resulting from T2 decay (7, 8).
Phase modulation of k-space data in the phase-encoding direction can result from off-resonance effects, such as susceptibility, field inhomogeneities, and chemical shift. In pulse sequences such as EPI and GRASE, where lines of k-space are acquired in two directions, incidental-phase offsets from receiver electronics and filters may also cause phase shifts between echoes (9). System filters are causal and have nonzero-phase responses that manifest as delays in the time (k-space) domain (1). Other delays can result from demodulators, RF coils, and other sources that are patient independent. Eddy currents resulting from gradient switching can also cause echo-timing misregistrations (10). In addition, FSE may suffer from constant-phase errors as a result of stimulated echoes and phase errors in RF transmission, even though lines of k-space are acquired in the same readout direction (11).
Phase-encode ordering is an important tool for the reduction of artifacts caused by amplitude modulation in many imaging techniques (12, 13). Echo-time shift (ETS) techniques are often used for interleaved EPI and GRASE to reduce both amplitude and phase discontinuities caused by T2 decay and off-resonance effects, respectively (14, 15).
Measurement of constant-phase offsets and timing delays are often made with “reference scans,” where the phase-encoding gradient is turned off and two or more readout gradient lobes acquire echoes. If phase offsets vary from view to view, then a reference scan that acquires an echo corresponding to each line in k-space is required, although only two “internal reference” lines (16) are needed to measure time delays. Filter delays can also be measured before an imaging protocol, as part of a calibration procedure (17).
A commonly used algorithm for making postprocessing corrections could be written as
(a) Measure filter delays (calibration scan), or (b) Acquire reference scan to measure constant-phase offsets (EPI, GRASE, FSE) and time delays (EPI, GRASE)
Acquire phase-encoded image data
Time-reverse echoes, where necessary (EPI, GRASE)
Fourier transform in the readout direction
Apply constant-phase shift corrections, and apply phase rolls to correct for time shifts
Fourier transform in the phase-encoding direction
The following section mathematically describes ghosting artifacts resulting from amplitude and phase discontinuities, and time-delay misregistrations. This is followed by an analysis of phase- and time-delay estimation errors, and the effects of these errors on image artifacts. Estimators for measuring time delays and phase offsets are discussed, and their performance is shown to be optimal for estimating these parameters.
THEORY
Ghost Artifacts—A Mathematical Description
Amplitude Discontinuity
Consider a simple interleaved EPI experiment, where no echo-time shifting (15) is used during acquisition and no echo misalignment occurs due to system filters (17). Here, the only corruption of k-space is an amplitude modulation in the ky direction.
A ky profile in normalized k-space, f[ky] is multiplied by an amplitude modulation h[ky]
| [1] |
The modulation function, h[ky] could, for example, result from T2 decay or periodic motion of the object (18). The pattern of modulation would also be highly dependent on the phase-encoding scheme used, as well as other imaging parameters such as TR and the flip angle. A representative example of the modulation function, shown in Fig. 1, was chosen to investigate the effects of amplitude modulation. Although the amplitude of ghost artifacts may vary with more complicated modulations, this representative function is reasonable for demonstrating the magnitude and periodicity of ghosting artifacts that result from amplitude discontinuities.
FIG. 1.
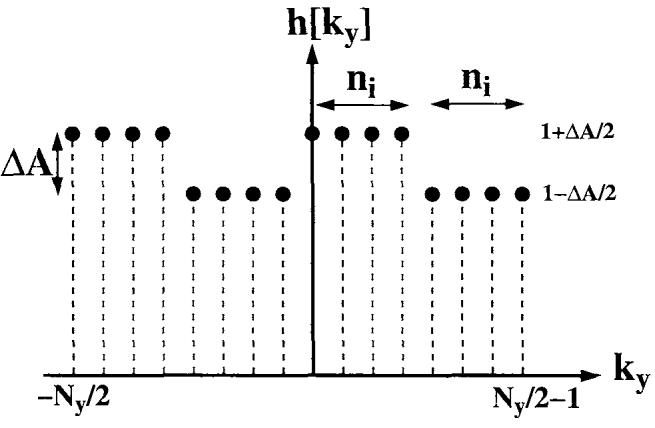
Simple amplitude discontinuities in the phase-encoding direction of k-space. The phase encoding index is denoted by “ky,” with Ny phase-encoding steps. Here, ni is 4 and Ny = 16.
Fourier transformation of Eq. [1] gives
| [2] |
where F′[ny] is the circular convolution of the uncorrupted image, F[ny], and the modulation kernel, H[ny]. All phase and amplitude information of ghost artifacts is contained in H[ny].
The modulation function depicted in Fig. 1 can be written as
| [3] |
where ΔA is represents the amount of amplitude modulation in the data, and g[ky], shown in Fig. 2, is defined as
| [4] |
FIG. 2.
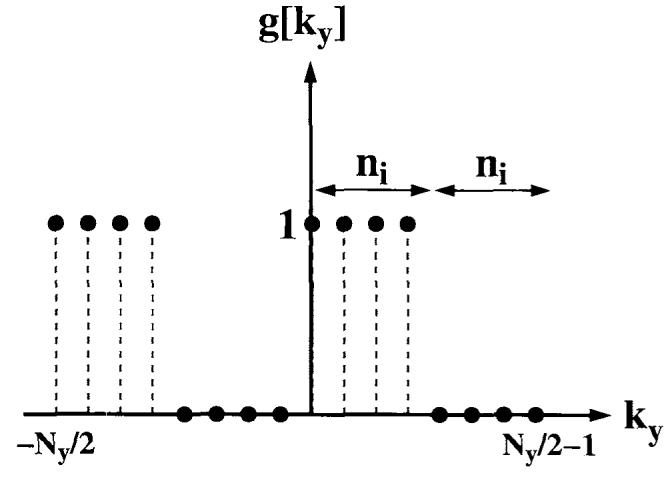
modulation function h[ky] can be simplified using shown here for ni = 4 and Ny = 16.
For a k-space data set that contains Ny phase-encoding steps, the Ny point DFT of h[ky] is
| [5] |
where GA[ny] = DFT{(g[ky] − g[ky − ni])(ΔA/2)} is defined as the ghost kernel, and is calculated in Appendix A.1 as
| [6] |
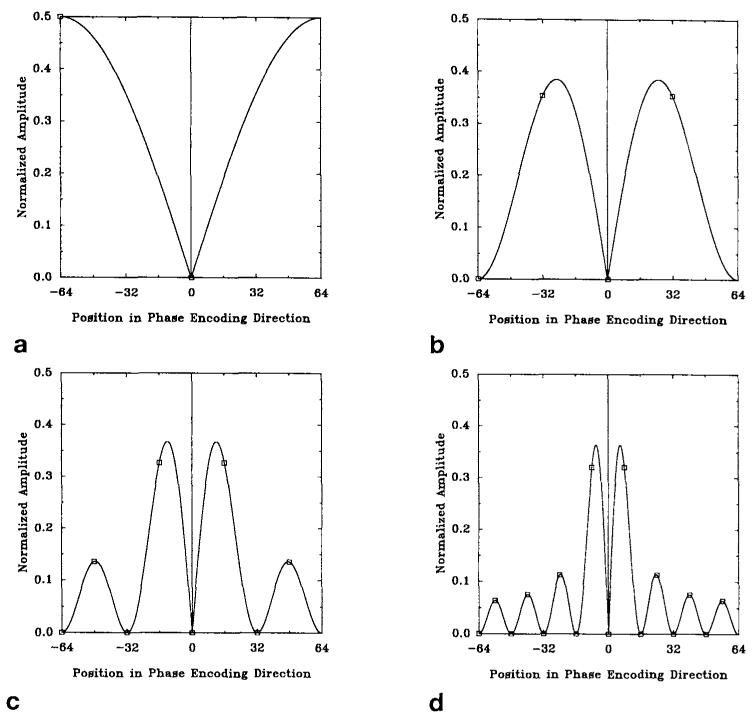
Figures 3a-3d plots the magnitude of the ghost kernel, |GA[ny]|, normalized by ΔA and image intensity (Ny, see Eq. [5]). Note that the m even terms are zero, meaning that the spacing between the image kernel and the m = ±1 ghosts is FOV/2ni, while the spacing between adjacent ghosts is FOV/ni. Figures 3a-3d shows the m even terms to emphasize this point.
FIG. 3.
Magnitude of ghost kernel, |GA[ny]|, normalized by ΔA and image intensity (Ny) for ni = 1, 2, 4, 8. The squares represent the kernel at different m values, while the solid line is shown to indicate the amplitude modulation of the ghosts. Note that even values of m are zero.
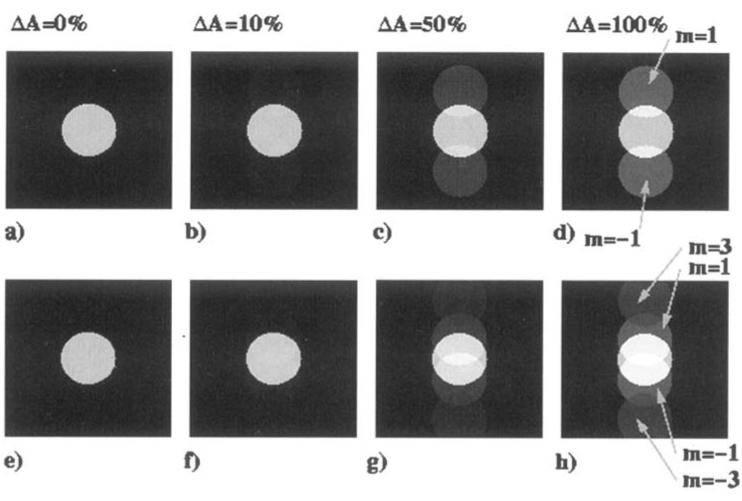
A computer simulation was written to demonstrate ghosts resulting from amplitude discontinuities. Figures 4a-4d show simulated images that contain amplitude discontinuities with ΔA = 10% (0.1), 50% (0.5), and 100% (1.0), for ni = 2, while Figs. 4e-4h represent images with the same amplitude modulations and ni = 4. As expected, for the ni = 2 images, the m = ±1 ghosts are seen above and below the central image. Likewise for the ni = 4 images, two intense ghosts (m = ±1) are seen overlapping the central image, with two weaker ghosts further out (m = ±3). Note that substantial amplitude modulation is required to achieve moderate ghosting.
FIG. 4.
Simulated magnitude images showing (a) image with no amplitude discontinuity, with (b) ΔA = 10%, (c) 50%, (d) 100% for ni = 2. Images (e)–(h) are the same modulations with ni = 4. Image, ghost, and overlap region intensities agree with those predicted by theory.
As the number of interleaves increases, the ghosts begin to impinge into the image. As ni becomes very high, the ghosts become blurred together with the image. For example, if ni = 64 and Ny = 128, then the m = ±l ghosts appear one pixel (ny = ±l) on either side of the image, giving the appearance of blurring. Figure 8d is an axial brain image that shows this blurring effect for time delays (see “Ghosting from Time Delays”).
FIG. 8.
128 × 128 axial interleaved EPI brain images that demonstrate the ghost artifacts caused by time delays. (a) 8 shot image with time delay correction, and (b) 1 shot (c) 4 shot, and (d) 64 shot images without time delay corrections. Ny = 128.
The following section, which discusses the effects of phase discontinuities, is a natural extension of the previous section.
Phase Discontinuity
A similar approach can be used to describe ghost artifacts that arise due to constant-phase modulations in the phase-encoding direction. Constant-phase shifts of echoes can result from field inhomogeneities, chemical shift, and susceptibility, as well as receiver-phase misregistrations. In FSE and GRASE imaging, stimulated echoes and phase errors in the transmitter also cause constant-phase errors (11). Accordingly, the following analysis considers the phase modulation depicted in Fig. 5, as a representative example.
FIG. 5.
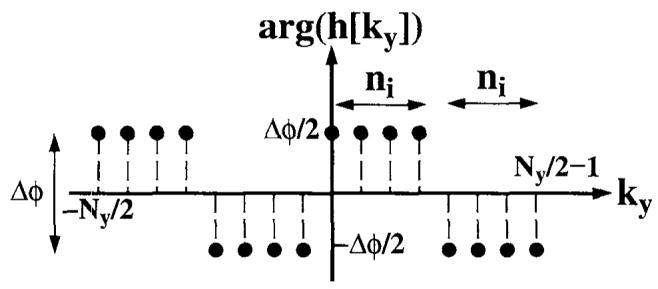
Phase discontinuities in the phase-encoding direction. Here, ni is 4 and Ny = 16.
In this case, the modulation function describing this discontinuity can be written
| [7] |
The Ny-point DFT of h[ky] takes the form
| [8] |
where the image kernel is
| [9] |
and the ghost kernel is
| [10] |
This result is very similar to that in Eq. [6] for amplitude modulation, except jΔA/2 is replaced with sin(Δϕ/2). When Δϕ is small, then Δϕ/2 and ΔA/2 are interchangeable when comparing the magnitude of ghosts. An additional result is that the amplitude of the image decreases with increased phase discontinuity as cos(Δϕ/2), unlike the image with amplitude modulation, where no amplitude decrement is seen.
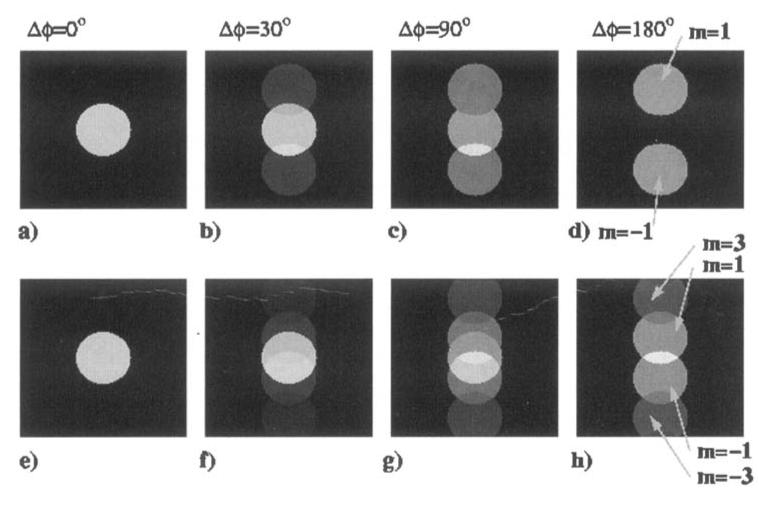
A computer simulation was written to show the effects of phase discontinuities. Figures 6a-d shows simulated images that contain constant phase discontinuities with Δϕ = 0°, 30°, 90°, and 180°, for ni = 2. Figures 6e-6h show images with the same phase modulations and ni = 4.
FIG. 6.
Simulated magnitude images showing (a) image with no constant phase discontinuities, with Δϕ = (b) 30°, (c) 90°, (d) 180° for ni = 2. Images (e)–(h) are images with the same modulation but ni = 4. Ghost and image intensities agree with those predicted by theory.
Ghosting from Time Delays
After Fourier transform in the readout direction, the phase discontinuity between successive ni groups of phase-encoding lines, shifted by s sample points 1 is
| [11] |
and the ghosting that results is
| [12] |
The image kernel is given by
| [13] |
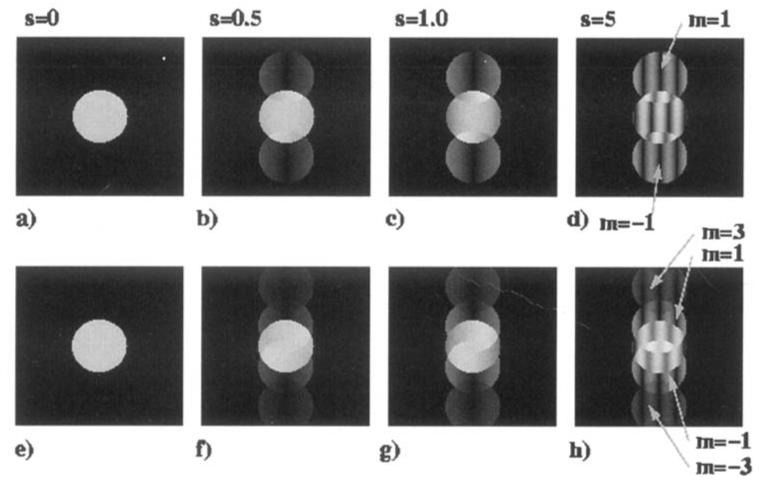
A computer simulation was written to demonstrate the effects of time delays. Figure 7a-7d shows simulated images that contain time shifts of 0.5, 1.0, and 5 sample points for ni = 2. Figures 7e-7h, are images with the same time shifts and ni = 4. Note the sinusoidal modulation of the ghosts and image in the readout (horizontal) direction.
FIG. 7.
Simulated magnitude images showing (a) image with no echo-time shift, with Δt = (b) 0.5 samples, (c) 1.0 samples, (d) 5 samples for ni = 2. Images (e)–(f) have the same shifts but ni = 4.
In Figures 8a-8d, axial brain images demonstrate the ghost artifacts that arise from time delays. This figure shows an 8-shot image with time delay corrections, as well as 1-shot, 4-shot, and 64-shot images with no time delay corrections. The time delay in this case is approximately 16 μs (3.3 sample points with ±100 kHz bandwidth).
A thorough description of ghost artifacts caused by representative examples of amplitude and phase discontinuities, as well as time delays, was presented. Using this description, criteria for maximum allowable phase discontinuities and echo-timing misalignment can now be established.
Ghosting Artifact Acceptability Criteria
There are many possible criteria that can be established for setting standards of ghost reduction. These criteria will vary for specific applications, depending on the desired information content of the image. For example, fMRI applications that are dependent on endogenous BOLD contrast or flow techniques using spin labeling for signal contrast, require tight control of ghosting since expected signal differences are on the order of a few percent. Images whose information content lies in morphological features, such as an anatomical brain or heart image, may have a higher tolerance for ghosting and will not require as stringent criteria.
The following discussion focuses on ghosts that are adjacent to the image. These ghosts are indexed by m = ±1, have the highest amplitude, and are most likely to overlap the image, possibly confounding signal enhancement measurements. The fact that the image itself is modulated by phase discontinuities and timing misregistrations is a smaller effect, since cos(Δϕ/2) ≈ 1 for small Δϕ. This is reasonable, since it assumes that a reference correction has been made, and that only a residual modulation remains due to SNR limitations of the reference measurements.
Ideally, ghost artifacts should be reduced below some fraction of the image noise level. For this analysis, we define the ghost-to-noise ratio, α, as the ratio of the ghost intensify to σ, the standard deviation of the complex Gaussian image noise. For example, if we wish to reduce the amplitude of an artifact to the same level as the noise, then the ghost-to-noise ratio equals 1.
Criteria for Amplitude Discontinuities
If the magnitude of the m = ±1 ghosts should be reduced below ασ, some fraction of the image noise, then
| [14] |
Since the image kernel has magnitude, Ny, Eq. [14] can be rearranged as
| [15] |
where SNR = Ny/σ is the signal-to-noise ratio of the image. Equation [15] sets the upper limit for ΔA to reduce the m = ±1 ghosts below ασ, for an ni shot acquisition. For example, if the ghost-to-noise ratio (α) = 1, ni = 1, then for an image with SNR = 50, the maximum amplitude discontinuity is 4%. For ni = 4, the maximum amplitude discontinuity is 6.1%.
Criteria for Phase Discontinuities
A similar analysis can be performed for constant-phase discontinuities. From Eq. [10] it is easily shown for m = ±1, that
| [16] |
Assuming the argument of the left-hand side of 16 is small, then
| [17] |
Equation [17] says that the error in estimating a phase discontinuity must be no greater than Δϕ to reduce the m = ± 1 ghosts below ασ, for an ni, shot acquisition. For example, if the ghost-to-noise ratio (α) = 1, ni = 1, then for an image with SNR = 50, the maximum phase discontinuity is 2.3°. For ni = 4, the maximum phase discontinuity is 3.5°.
Criteria for Time Delays
Time shifts of one sample point will cause a phase-roll spanning a full 2π, and shifts greater than one will cause phase wrapping. It is assumed that time delays can be corrected to less than one sample and consequently, ghosting artifacts from time delays are greatest at the edge of the object and should minimized here. For a centered object of size Sx and image resolution of Δx in the readout direction, it can be shown from Eq. [12] that
| [18] |
Multiplying both sides by the sample time, T, and noting that the bandwidth per pixel in the readout direction is BW = 1/NxT
| [19] |
where td = sT is the maximum allowable delay to reduce the m = ±1 ghosts below ασ for an ni shot acquisition and an object for which the edge sits at Sx/2Δx pixels from the center of the image. For example, if the ghost-to-noise ratio (α) = 1, ni = 1, then for an image with SNR = 50, Sx/2Δx = 64, Nx = 256, and T = 10 μs, the maximum time shift is 0.13 μs. For ni = 4, the maximum delay is 0.19 μs.
Criteria for Functional Imaging
As discussed previously, stringent criteria are required for functional imaging, where signal changes are on the order of 1–5%. In order to identify a signal change with 95% certainty, a signal change must be greater than two standard deviations (σs). Regions containing ghosts can be affected by these artifacts in several ways, best described with the aid of Fig. 9, which diagrams a simple hypothesis test. This figure sketches the probability distributions of signal intensities of a region with (H1) and wiihout (H0) activation. When no artifacts are present, the standard deviation, σs equals where σ is the standard deviation of the image noise and N is the number of pixels averaged in the region. If the goal is to detect the signal change ΔS with 95% certainty, then ΔS ≥ 2σs. In the presence of ghosting, several possibilities arise. If the corruption is constant through time, then the magnitude of the signal detected will be
| [20] |
where S is the signal (rotated to the real axis) and Gr and Gi are the real and imaginary components of the ghost artifact. If Gi, Gr ≪ S, then S′ = S + Gr, and the signal difference between the activated and unactivated regions will be unaffected by the ghost. Measurements of absolute signal will be biased by these artifacts.
FIG. 9.
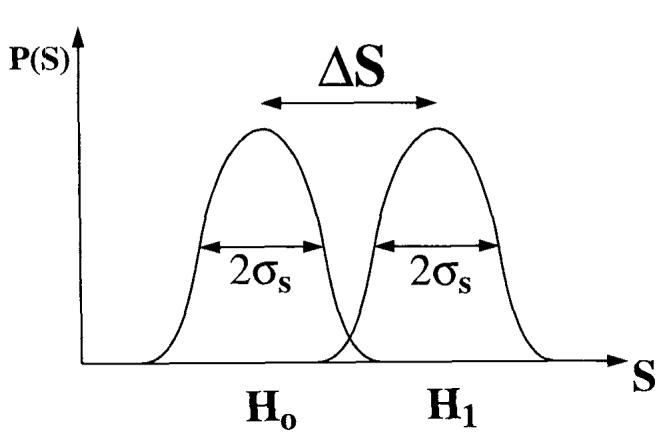
Gaussian distributions of signal intensities of a region in activated (H1) and non-activated (H0) states. The separation, ΔS is the signal difference between the two states, and σs is the standard deviation of each signal measurement.
Motion, system instabilities, and physiological fluctuations (19) may cause phase offsets and time delays to fluctuate between images. Postprocessing corrections from reference-scan measurements made at the beginning of an fMRI experiment may leave considerable ghosting that will affect the detection of signal enhancement. If the phase offsets and time delays are treated as Gaussian random variables, then Eqs. [10] and [12] can be used to determine the ghost-intensity fluctuations. For example, using Eq. [10] to describe the m = ±1 ghosts caused by phase offsets, normalizing for image intensity (Ny), and assuming sin(Δϕ/2) ≈ Δϕ/2
| [21] |
where σG is the standard deviation of the ghost intensity, and σϕ is the standard deviation of the phase discontinuity, modeled here as a Gaussian random variable with a mean of zero. This means that the effective standard deviation of a signal measurement is , and the minimum signal difference that can be detected with 95% certainty is
| [22] |
The value of σϕ depends on the particular experiment and might be caused, for example, by pulsatile flow in an ungated acquisition. A Similar analysis can be performed for time delays, using Eq. [12].
Reference Scan Estimation from Two Echoes
Reference scans are often used to estimate echo-time delays and constant-phase shifts between successive echoes, as part of a standard EPI exam. Various methods were described previously (1, 16). Briefly, two echoes are acquired with opposite polarity readout gradients and no phase encoding. After time reversal of one of the echoes and Fourier transform of both, the phase at each point in the resulting profile is subtracted. Delays in the time (k-space) domain will be seen as phase rolls in the frequency (spatial) domain. Constant-phase offsets between echoes will also be seen. If the echoes are acquired at the same time after two independent RF excitations, then phase shifts from off-resonance effects will cancel, eliminating biases in the time-delay and phase-shift estimates. The phase waveform is then linearly regressed to determine any time-delay and constant-phase terms. When reference scans are made from two echoes, limited SNR may require efficient estimators to make accurate estimates of delays.
The following analysis assumes that the reference echoes were collected in the same manner as the image data (e.g., same averaging), and that T1 saturation and T2 decay effects have been ignored.
Error on Time-Delay Estimations
Accordingly, the lower bound for the estimation error of time-delay measurements from two reference echoes is calculated using the Cramer-Rao bound (20-22). Extending from previous work on tag detection (23), the Cramer-Rao bound for a time-delay estimation from two signals in the presence of Gaussian noise is calculated in Appendix A.2 as
| [23] |
Equation [23] is the lower bound for the error in estimating the relative time delay between two echoes for a homogeneous rectangular object of dimension Sx by Sy, pixel dimensions Δx by Δy, image signal-to-noise ratio (SNR), bandwidth per pixel (BW), and Ny phase-encoding steps. From this equation, it follows that the estimate of the time delay can be improved by increasing the size of the object in both directions. Since the dependence is stronger in the readout direction, the object should also have its longest dimension oriented in this direction, which is usually done to prevent aliasing in the phase direction. This, however, is not optimal for reducing the ghosting artifact, as discussed later. It should also be noted that (24)
| [24] |
and substitution into 23
| [25] |
reveals that neither the voxel size in the phase direction nor the number of phase-encoding steps has any bearing on the estimation error, and that increasing the readout bandwidth per pixel improves the estimation error.
Monte Carlo computer simulations were performed to compare the estimation error with the theoretical lower bound (see Eq. [23]). Complex Gaussian noise was added to two profiles with opposite phase rolls. The phase of each point in the profile was added, and these points were linearly regressed to determine the time shift from the slope of the regression (25). The standard deviation of the errors from 100 trials is plotted against SNR in Fig. 10. Clearly, good agreement exists between the simulated error estimates and those predicted by the Cramer-Rao bound, allowing Eq. [23] to be written as an equality for this estimator, and indicating that this estimation method is efficient.
FIG. 10.
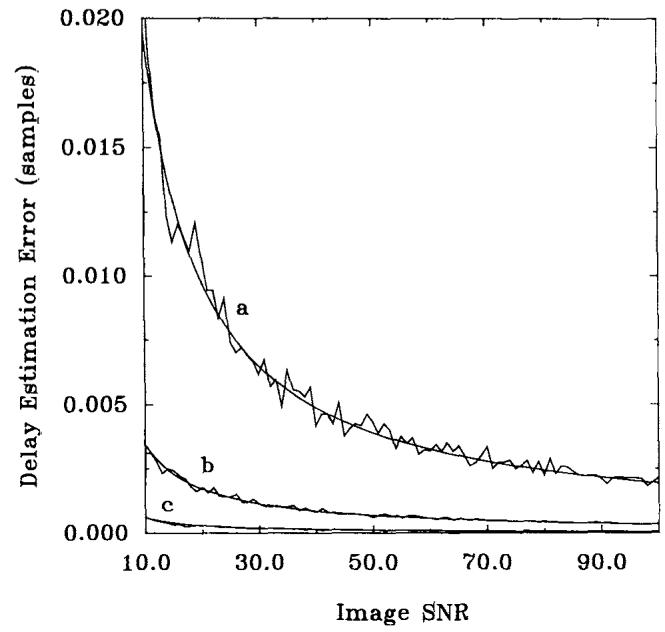
Estimation error of echo delays normalized by sample time (T) versus image SNR (Cramer-Rao bound (smooth) and simulated) for Nx = Ny = 128 and (a) Sy/Δy = Sx/Δx = 32, (b) 64, and (c) 128.
Taking Eq. [23] as the residual time delay after postprocessing calculations, this equation can be substituted into Eq. [19], and rearrangement for α gives
| [26] |
This expression is the minimum ghost-to-noise ratio (α) achievable for an artifact resulting from a time delay, considering the size of a homogeneous rectangular object of dimension Sx by Sy, the number of phase-encoding steps (Ny), and the image resolution Δx by Δy. Note that this expression is independent of image SNR and Nx. This expression also implies that the ghosting artifact can be reduced by orienting the object with the longest axis in the phase-encoding direction. In this orientation, the ghost artifact is smaller at the edges of the object for the same time delay, reducing the minimum achievable ghost-to-noise ratio. The greater SNR of a profile in this orientation improves the time-delay estimate, as well. These two effects outweigh the negative effect of reducing the number of regression points in the readout direction. This orientation, however, may not always be practical due to aliasing concerns in the phase-encoding direction. As an example, when Sy/Δy = Sx/Δx = 32, Ny = 128, and ni = 1, α is 0.15.
Error on Constant-Phase Shift Estimations
Extending from Conturo and Smith (26), the standard deviation of a constant-phase shift Δϕ, between two reference profiles, with complex Gaussian noise is
| [27] |
and has Gaussian behavior for large SNR (>10). The SNR of a projection (SNR1) obtained from a reference echo can be written in terms of the image SNR (SNR) for the homogeneous rectangular object
| [28] |
where Ny is the number of phase-encoding steps, and Sy and Δy are the size of the object and voxel dimension in the y-direction, respectively. Thus
| [29] |
representing the error in estimation of a constant-phase offset from one sample of a profile in the readout direction. If the phase extends over the entire profile, then this error can be reduced by averaging over all Sx/Δx points
| [30] |
Monte Carlo simulations like those described in the previous section were performed to verify this result. Figure 11 plots the estimation error of the phase shift against image SNR, for Sx/Δx = Sy/Δy = 32, 64, and 128, with Ny = 128. The simulated results are plotted against the estimation error calculated in Eq. [30], which uses all points along the profile in the readout direction for averaging.
FIG. 11.
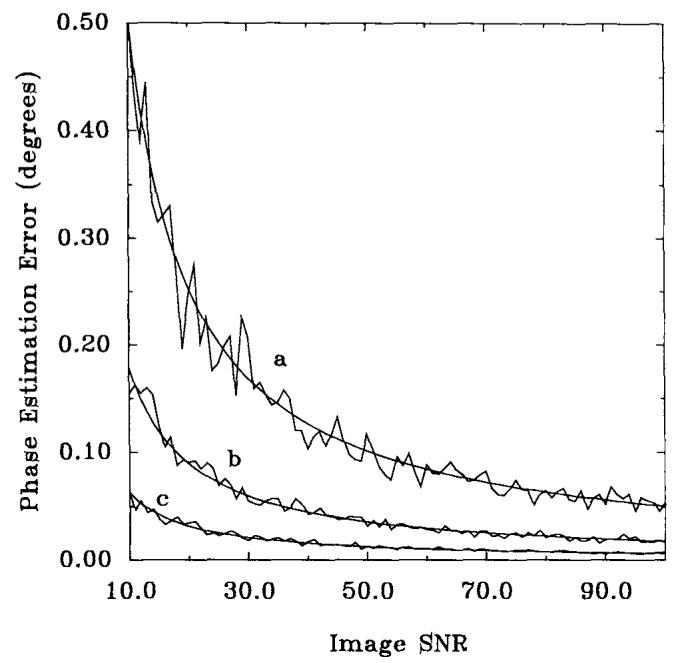
Estimation error of the phase shift (degrees) against image SNR, for Ny = 128 and Sx/Δx = Sy/Δy = (a) 32, (b) 64, (c) 128.
Clearly, there is excellent agreement between the simulated and theoretical estimation error on the phase of the signal, verifying Eq. [30]. This equation also shows that the estimation error from measuring a constant-phase shift is very low, and that the estimation method described above is efficient. In addition, phase-offset estimation error is minimized by orienting the object's long axis in the phase-encoding direction.
Taking Eq. [30] as the residual phase offset after postprocessing, this equation can be substituted into Eq. [17] and rearrangement for α gives
| [31] |
This expression is the minimum ghost-to-noise ratio (α) achievable for an artifact resulting from a phase discontinuity, for a homogeneous square object of dimension Sx by Sy image resolution Δx by Δy, Ny phase-encoding steps, and ni shots. Note that this equation implies that phase estimates are best made with the object's long axis oriented in the phase-encoding direction. For Sx/Δx = Sy/Δy = 32, Ny = 128, and ni = 1, α is 0.044. With no averaging, (Sx/Δx = 1), α is 0.25.
Summary
A thorough mathematical description of ghost artifacts often seen in interleaved imaging methods such as EPI, FSE, and GRASE was presented. Expressions describing the artifacts resulting from amplitude and phase discontinuities, as well as those resulting from k-space misregistrations due to echo-time delays, were derived. The first column of Table 1 contains the amplitude of the m = ±1 ghosts, which are positioned at ±(FOV/2ni) from the center of the image.
Table 1.
Summary for the Three Sources of Ghosting: Amplitude and Phase Discontinuities, and Time Delays. The first column is the amplitude of the m ± 1 ghosts normalized by the image intensity. The second column is the criteria of each source for reducing ghosts below the ghost to noise ratio, α. The third column is the minimum possible ghost to noise ratio using the reference method described in the text.
| Ghost amplitude (m = ± 1) | Discontinuity criteria | Ghost to noise ratio | |
|---|---|---|---|
| Amplitude | |||
| Phase | |||
| Time delay |
Using these expressions, criteria were presented for reducing artifact levels below a desired ghost-to-noise ratio (α). These criteria are summarized in the second column of Table 1.
The lower bounds on the estimation errors for measurement of time delays and constant-phase discontinuities were calculated and compared with computer simulations of estimators that used two reference echoes. Excellent agreement was found between the analytical expressions and the error performance of these estimators, indicating that these estimators are optimal for measuring time delays and phase estimates.
The analytical expressions for the estimation error of time delays and phase discontinuities were combined with the criteria that relate ghost artifact intensity to phase and timing errors. This revealed that ghosting caused by timing and phase errors can be reduced to very low levels, if efficient estimators are used. This has important implications for applications such as fMRI that rely on small changes in signal intensity. The minimum ghost-to-noise ratios for phase offsets and time delays are summarized in the third column of Table 1.
The effect of ghosting artifacts that is seen in fMRI experiments has also been described. Characterization of the processes that cause ghosting (e.g., phase offsets), will allow determination of the minimum sensitivity to signal enhancement.
An interesting observation can be made from the calculations about the ghost-to-noise ratio (α); namely, the orientation of the object with respect to the phase-encoding and readout directions has an effect on the minimum achievable ghosting. For both time delays and phase offsets, α can be minimized by orienting the object's long axis along the phase-encoding direction, so long as phase wrap is avoided. Notice, however, that the estimate of time delays is more accurate when the object is oriented in the readout direction (Eq. [25]). This means that the optimal way to reduce ghosting from time delays is to make reference measurements with the object's long axis in the readout direction and then flip the phase-encoding and frequency directions for imaging. This is only true if time delays are independent of image orientation and gradient configurations.
Finally, this analysis shows that additional averaging of reference scans is not required to reduce ghosting for commonly used imaging parameters. Therefore, reference scans need only take a small amount of acquisition time during an experiment or clinical examination.
ACKNOWLEDGMENTS
The authors thank the referees for their helpful comments.
This work was supported by NIH grant HL45683; S.B.R. is supported with a Medical Scientist Training Program (MSTP) Fellowship.
APPENDIX A: GHOST KERNEL CALCULATIONS
The ghost kernel GA[ny] can be written
| [A1] |
or
| [A2] |
where the DFT of g[ky] is,
| [A3] |
Expanding
| [A4] |
where ni determines the periodicity of the modulation. Simplifying further,
| [A5] |
and writing the closed form solution using the geometric series,
| [A6] |
The second fraction of Eq. [A6] is zero, unless ny = Nym/2ni where m is any integer, allowing the first fraction to be expressed as a train of delta functions, that determines ghost position and spacing. The coefficient of the delta functions is determined using l'Hôpital's Rule
| [A7] |
assuming Ny is even. Thus, the second fraction in Eq. [A6] can be written
| [A8] |
or
| [A9] |
if we limit ny to the interval −(Ny/2) ≤ ny ≤ (Ny/2) − 1, since was assume G[ny] is periodic with period Ny.
The first fraction of Eq. [A6] can be simplified to
| [A10] |
and summarizing, G[ny] can be written as
| [A11] |
Substitution of Eq. [A11] into Eq. [A2] determines the ghost kernel
| [A12] |
It is important to note that the m = 0 term is zero as expected, since the amplitude modulation did not change the DC (average) amplitude. GA[ny] is also zero for all other m even terms.
APPENDIX B: CRAMER-RAO BOUND CALCULATIONS FOR TIME-DELAY ESTIMATION
The Cramer-Rao bound for a time-delay estimation from two signals in the presence of Gaussian noise can be written (23)
| [B1] |
where T is the sampling rate, td is the time delay, and the summation is over the same number of points Nx that were collected in the echo. The denominator can be rewritten
| [B2] |
where
| [B3] |
and S[k] is the DFT of s(iT). This assumes s(iT) is periodic with NxT and is band-limited. Expanding Eq. [B2],
| [B4] |
and since
| [B5] |
Therefore
| [B6] |
For a centered homogeneous rectangular object with dimensions Sx by Sy, image voxel dimensions Δx by Δy, and amplitude A, the amplitude of the projection is ASy/NyΔy. Equation [B6] is then written
| [B7] |
Using the approximation (27)
| [B8] |
Equation [B7] can be simplified
| [B9] |
The numerator of Eq. [B1] is the variance on the noise in the time domain, and can be converted to the frequency domain as
| [B10] |
where σω is the standard deviation of the noise in the image domain. Substituting Eq. [B10] into [B1], and noting that the image SNR equals A/σω and readout bandwidth per pixel (BW) equals l/NxT
| [B11] |
Footnotes
In general, s is not an integer value.
REFERENCES
- 1.Bruder H, Fischer H, Reinfelder HE, Schmitt F. Image reconstruction for echo planar imaging with non-equidistant k-space sampling. Mogn. Reson. Med. 1992;23:311–323. doi: 10.1002/mrm.1910230211. [DOI] [PubMed] [Google Scholar]
- 2.Ogawa S, Lee T, Kay A, Tank D. Brain magnetic resonance imaging with contrast dependent on blood oxygenation. Proc. Natl. Acad. Sci. USA. 1990;87:9868–9872. doi: 10.1073/pnas.87.24.9868. [DOI] [PMC free article] [PubMed] [Google Scholar]
- 3.Kwong KK. Functional magnetic resonance imaging with echo planar imaging. Magn. Reson. Q. 1995;11(1):1–20. [PubMed] [Google Scholar]
- 4.Williams DS, Detre JA, Leigh JS, Koretsky AP. Magnetic resonance imaging of perfusion using spin inversion of arterial water. Proc. Natl. Acad. Sci. 1992;89:212–216. doi: 10.1073/pnas.89.1.212. [DOI] [PMC free article] [PubMed] [Google Scholar]
- 5.Edelman RR, Siewert B, Darby DG, Thangaraj V, Nobre AC, Mesulam MM, Warach S. Qualitative mapping of cerebral blood flow and functional 1ocalization with echo planar MR imaging and signal targeting with alternating radio frequency. Radiology. 1994;192:513–520. doi: 10.1148/radiology.192.2.8029425. [DOI] [PubMed] [Google Scholar]
- 6.Reeder SB, Atalay MK, McVeigh ER, Zerhouni EA, Forder JR. Quantitative cardiac perfusion—a non-invasive spin-labeling method exploiting coronary vessel geometry. Radiology. 1996;200:177–184. doi: 10.1148/radiology.200.1.8657907. [DOI] [PMC free article] [PubMed] [Google Scholar]
- 7.Farzaneh F, Riederer SJ, Pelc NJ. Analysis of T2, limitations and off-resonance effects on spatial resolution and artifacts in echo-planar imaging. Magn. Reson. Med. 1990;14:123–139. doi: 10.1002/mrm.1910140112. [DOI] [PubMed] [Google Scholar]
- 8.McKinnon GC. Ultrafast interleaved gradient-echo-planar imaging on a standard scanner. Magn. Reson. Med. 1993;30(5):609–616. doi: 10.1002/mrm.1910300512. [DOI] [PubMed] [Google Scholar]
- 9.Noll DC, Nishimura DG, Macovski A. Homodyne detection in magnetic resonance imaging. IEEE Transact. Med. lmag. 1991;10(2):154–163. doi: 10.1109/42.79473. [DOI] [PubMed] [Google Scholar]
- 10.Ahn CB, Cho ZH. Analysis of eddy currents in nuclear magnetic resonance imaging. Magn. Reson. Med. 1991;17(1):149–163. doi: 10.1002/mrm.1910170119. [DOI] [PubMed] [Google Scholar]
- 11.Wan X, Parker DL, Lee JN, Buswell HR, Gullberg GT. Reduction of phase error ghosting artifacts in thin slice fast spin-echo imaging. Magn. Reson. Med. 1995;34:632–638. doi: 10.1002/mrm.1910340422. [DOI] [PubMed] [Google Scholar]
- 12.Atkinson DJ, Edelman RR. Cineangiography of the heart in a single breath hold with a segmented turboflash sequence. Radiology. 1991;178:357–360. doi: 10.1148/radiology.178.2.1987592. [DOI] [PubMed] [Google Scholar]
- 13.Oshio K, Feinberg DA. GRASE (gradient- and spin-echo) imaging: a novel fast MRI technique. Magn. Reson. Med. 1991;20(2):344–349. doi: 10.1002/mrm.1910200219. [DOI] [PubMed] [Google Scholar]
- 14.Feinberg DA, Oshio K. Gradient echo shifting in fast MRI techniques (GRASE imaging) for correction of field inhomogenrity errors and chemical shift. J. Magn. Reson. 1992;97:177–183. [Google Scholar]
- 15.Feinberg DA, Oshio K. Phase errors in multi-shot echo planar imaging. Magn. Reson. Med. 1994;32:535–539. doi: 10.1002/mrm.1910320418. [DOI] [PubMed] [Google Scholar]
- 16.Jesmanowicz A, Wong EC, Hyde JS. Phase correction for EPI using internal reference lines; SMRM, 12th Annual Meeting; 1993. p. 1239. [Google Scholar]
- 17.King KF, Crawford CR, Maier JK. Correction for filter induced ghost in echo planar imaging; SMR, 3rd Annual Meeting; 1995. p. 105. [Google Scholar]
- 18.Wood ML, Xiang QS. The Physics of MRI. AAPM; New York: 1993. Motion artifacts and remedies. [Google Scholar]
- 19.Hu X, Kim SG. Reduction of signal fluctuation in functional MRI using navigator echoes. Magn. Reson. Med. 1994;31(5):495–503. doi: 10.1002/mrm.1910310505. [DOI] [PubMed] [Google Scholar]
- 20.Ljung L, Soederstrem T. Theory and Practice of Recursive Identification. The MIT Press; London: 1983. [Google Scholar]
- 21.Komo JJ. Random Signal Analysis in Engineering Systems. Academic: Press; London: 1987. [Google Scholar]
- 22.Sandell NR, Jr., Shapiro JH. Stochastic Processes and Applications. Dept. of Electrical Engineering and Computer Science, Massachusetts Institute of Technology; 1976. Lecture Notes. [Google Scholar]
- 23.Atalar E, McVeigh ER. Optimization of tag thickness for measuring of position with magnetic resonance imaging. IEEE Trans. Med. Imaging. 1994;13(1):152–160. doi: 10.1109/42.276154. [DOI] [PMC free article] [PubMed] [Google Scholar]
- 24.Reeder SB, McVeigh ER. The effect of high performance gradients on fast gradient echo imaging. Magn. Reson. Med. 1994;32:612–621. doi: 10.1002/mrm.1910320510. [DOI] [PMC free article] [PubMed] [Google Scholar]
- 25.Reeder SB, Atalar E, Bolster ER, McVeigh BD. Echo delay estimation in echo planar reference scans: implications for artifact reduction; Proc., ISMRM, 4th Annual Meeting; 1996. p. 1479. [Google Scholar]
- 26.Conturo TE, Smith GD. Signal to noise in phase angle reconstruction: Dynamic range extension using phase reference offsets. Magn. Reson. Med. 1990;15:420–437. doi: 10.1002/mrm.1910150308. [DOI] [PubMed] [Google Scholar]
- 27.Gradshteyn IS, Ryzhik IM. Tables of Integrals, Series, and Products. Academic Press; 1980. [Google Scholar]


