

Abstract
Phase-contrast (PC) MRI is a noninvasive method for imaging blood and tissue velocity. PC experiments are typically segmented into many cardiac cycles in order to obtain sufficient spatial and temporal resolution, and thus require a gating signal to properly combine the data from multiple cardiac cycles. Although the surface electrode ECG is the gating waveform of choice for cardiovascular MRI, alternative gating methods are required for fetal cardiac imaging (due to the unavailability of fetal ECG signals) and for cases of ECG contamination via the strong magnetic fields within the MR scanner. This study demonstrates the feasibility of using imaging data from flow-encoded MRI experiments to derive times for cardiac gating. An undersampled radial k-space acquisition method is used to measure an image-derived flow-gating waveform in real-time, from which the gating times are derived. These gating times are used to reconstruct a conventional gated-segmented image series by combining the real-time data from multiple heartbeats. Flow-gated PC experiments were performed on five normal volunteers with slice prescriptions in four anatomic regions. The standard deviation (SD) of the difference between the flow-gating and ECG gating times ranged from 5 ms to 12 ms. Published 2004 Wiley-Liss, Inc.†
Keywords: gating, flow, MRI, phase contrast, complex difference
Phase-contrast (PC) MRI is an established method for the noninvasive measurement of blood and tissue velocities (1,2). PC experiments are typically segmented over several heartbeats, and thus require a cardiac-gating signal in order to trigger the data acquisition for prospectively-gated exams, or to allow data rebinning for retrospectively-gated exams. In this study, we describe a gating method for PC imaging that uses information encoded from the blood motion itself as the gating signal. This method provides an alternative to conventional ECG gating for applications without available ECG signals, such fetal cardiac imaging, and for cases of severe degradation of the ECG via electrical interference from strong static and fast-switching magnetic fields in MR scanners. This “flow-gating” method is intended not only to eliminate the need for an electrical gating signal, but to allow gating from the blood motion in a target region as well. The proposed gating signal is derived using image data from a radial PC acquisition (3) with conventional k-space segmentation. A radial k-space PC experiment is used to allow the same data to be reconstructed first in real time, to derive gating times, and subsequently with conventional retrospective gating and segmentation. We validated this new method by comparing the relative timing of the recorded ECG R-waves with the calculated flow-gating times for the case of blood flow in the aorta, pulmonary artery, renal artery, and left ventricular (LV) cavity in five normal volunteers.
MATERIALS AND METHODS
A standard segmented, retrospectively-gated PC imaging protocol (shown in Fig. 1a) was used for all experiments in this study. Each segment of k-space was repeated for an interval that was ∼20% longer than the subject's average RR interval, to ensure sampling over a complete cardiac cycle. For retrospective reconstruction, each line of k-space was interpolated, or rebinned, uniformly across the cardiac cycle to generate a target number of image frames. Interpolation within the cardiac cycle used the cardiac phase of each acquired line of k-space, which is typically measured with respect to the ECG-gating times. In this study, these gating times were measured using information derived from the image data itself to allow reconstruction of gated-segmented images without the use of ECG information. In order to compare ECG and flow-derived gating times, the raw ECG signal was recorded during all experiments (400-Hz sampling rate). The ECG-gating time was selected as the peak value of the surface electrode potential (QRS complex). The accuracy of the measured ECG gating time with this method was measured to be ±3.0 ms using input from a synthetic ECG generator.
FIG. 1.

a: The data acquisition pattern for a retrospective flow-gated PC experiment is displayed with an ECG gating signal. Each block in the acquisition scheme represents a single segment of k-space, which is outlined in detail in b and c. Each segment of k-space contains evenly spaced projection angles of ∼180°. Note that the differential flow-encoding steps in the phase experiment are acquired sequentially. Signal from within a circular flow region from real-time complex-difference images, each of which was reconstructed with only the views in a given segment, was used to generate the flow-gating waveform, shown below the sample images. The magnitude image on the left shows the anatomy at the level of the slice prescription in the abdomen where both the aorta and inferior vena cava are visible. A template, shown in a, is extracted from the flow-gating waveform and is subsequently used for calculation of the flow-gating times.
Cardiac gating times are derived from image information using the intrinsic sensitivity of PC experiments to motion. For the purposes of measuring a flow-gating signal, the PC data were processed with complex-difference subtraction, as opposed to the phase difference, to retain signal from those spins moving in the flow-encoded direction while eliminating signal from stationary tissue (4-7). For a given set of experimental parameters (TE, TR, slice thickness, and flip angle), the complex-difference signal intensity is modulated by the blood velocity in the flow-encoding direction, as well as by the inflow of unsaturated spins into the imaging slice (4-7). A radial acquisition scheme was used to allow images to be reconstructed from highly undersampled k-space data with as few as four views, without severe loss of spatial resolution or field of view (FOV) as compared to the equivalent Cartesian k-space acquisition (8). As shown in Fig. 1, real-time images were reconstructed using only the lines of k-space acquired within a single segment, which ranged from four to eight lines in this study. It is this modulation of the complex-difference signal intensity throughout the cardiac cycle that is the flow-gating waveform from which the flow-gating times can be derived. The series of real-time complex-difference images in Fig. 1a illustrates the variation of the signal intensity in the abdominal aorta of a normal volunteer over the course a single cycle of systolic flow. The flow-gating waveform signal intensity is measured from each image frame from the region of interest (ROI) shown on the first complex-difference image.
The gradient waveforms for a two-step flow-encoded radial acquisition scheme are shown in Fig. 1b. Note that the two differential flow-encoding steps were acquired sequentially and with the same projection angle. While the flow-encoding gradients shown in Fig. 1b generate sensitivity to motion in the slice way, the methods developed in this study are applicable for motion encoding in all directions. As shown in Fig. 1c, the projection angles, or views, within a segment were interleaved evenly across 180° to achieve uniform angular k-space coverage for that segment. The collection of projection angles were offset with each new segment to provide uniform coverage of k-space over the multisegment experiment, which is a standard approach for segmented experiments (9). The real-time complex-difference images always incorporated only the number of views in an image segment, although they were updated with every new projection angle (sliding window) for an apparent sampling interval of 2*TR = 9.0–10.0 ms in this study. The use of a radial sampling scheme in combination with a sliding-window reconstruction allowed the center of k-space to be updated with each new projection angle (10).
Both image-space and k-space methods were used to generate the flow-gating waveform. For the image-based method, pixel intensities were summed from an ROI selected by the user from the real-time complex-difference images, as shown in Fig. 1a. The k-space method uses the sum of pixel intensities from all of k-space to generate the flow-gating waveform, again after complex-difference subtraction. Since the k-space method requires no regridding or Fourier transformation of the raw data, it has the advantage of drastically reduced image processing and requires no user interaction. The image-space method has the advantage of targeting a region of space, such as a vessel or chamber of interest, for measurement of the flow-gating waveform. For all experiments, flow-gating waveforms were calculated using both image-space- and k-space-based methods for a comparison of the two approaches. The flow-derived gating times were calculated from the flow-gating waveform using a template matching method to correlate the cyclic patterns of flow to a reference or template pattern. Figure 1a shows a sample template waveform. For all flow-gating studies (both image-based and k-space-based), the template pattern was extracted from approximately one cardiac cycle from the flow waveform. Correlation coefficients were calculated for each offset of the reference waveform with respect to the flow waveform to give a correlation value with every image update (∼10.0 ms with the sliding-window reconstruction). To minimize the sensitivity of the correlation coefficients to the duration of any given cardiac cycle, the length of the template was set to be less than the duration of a cardiac cycle.
All of the MR measurements were performed on a Siemens 1.5 T Sonata scanner (Siemens Medical Systems, Erlangen, Germany). Through-plane PC experiments were performed at several locations in each volunteer, including the ascending aorta, pulmonary artery, and renal artery. Additionally, in-plane flow measurements were made for a three-chamber view orientation. The raw ECG signal was recorded with a sampling rate of 400 Hz during all of the experiments for a timing comparison with the flow-derived gating time. The PC experiments incorporated the following parameters: FOV = 360 mm, 176 readout points with 64–88 projections and four to eight views per segment, slice thickness = 5 mm, bandwidth (BW) = ±44 kHz, flip angle = 20° and Venc = 80–160 cm/s. TE/TR values ranged from 2.6 ms/4.4 ms to 3.0 ms/4.8 ms over this range of Venc's and the different flow-encoding directions. Flow compensation was applied for directions perpendicular to the flow-encoding direction for all experiments. Through-plane flow experiments incorporated eight views per segment, and in-plane flow experiments used only four views per segment. All experiments were performed during a breath-hold. The resampling of the radial k-space data to a Cartesian grid for both real-time images and the subsequent retrospectively gated PC images was performed by means of a lookup table approach with a 5 × 5 Kaiser-Bessel kernel.
To study the impact of the accuracy of the trigger timing, we reconstructed a high-temporal-resolution, ECG-gated, segmented, radial PC data set with a variable amount of artificial jitter in the timing of each trigger pulse. An axial slice prescription above the heart was used for this portion of the study with the measurement of through-plane velocities. The high-temporal-resolution data set was acquired with the same parameters listed above, and with two views per segment and 88 projections, for an effective temporal resolution of 4*4.6 ms = 18.4 ms. The same raw data were reconstructed with an increasing amount of error in the trigger timings. The instantaneous flow rate in the ascending aorta throughout a cardiac cycle was measured for each level of trigger jitter. All image processing and reconstruction, including the addition of the timing errors, was done in the MATLAB (The Mathworks, Natick, MA) programming environment.
RESULTS
Figure 2 displays a sample real-time, flow-gating waveform measured in the LV cavity of a normal volunteer, a sample template from this data set, and the corresponding correlation coefficients. Figure 2a shows the slice orientation with a single frame from a standard, gated-segmented, cine steady-state free precession (SSFP) protocol, as well as eight sample complex difference image frames. Each complex difference image was reconstructed using only four projection angles. Gating times were calculated as the local maxima of the correlation coefficients or as a constant offset from these times, as shown in Fig. 2c. The offset provides the option of correlating the gating times to a key feature in the template, such as the time of peak signal intensity. The time of peak systolic flow was selected in this example to illustrate the ability to reproducibly gate at the time of a flow feature over several heartbeats, as shown in Fig. 2b.
FIG. 2.
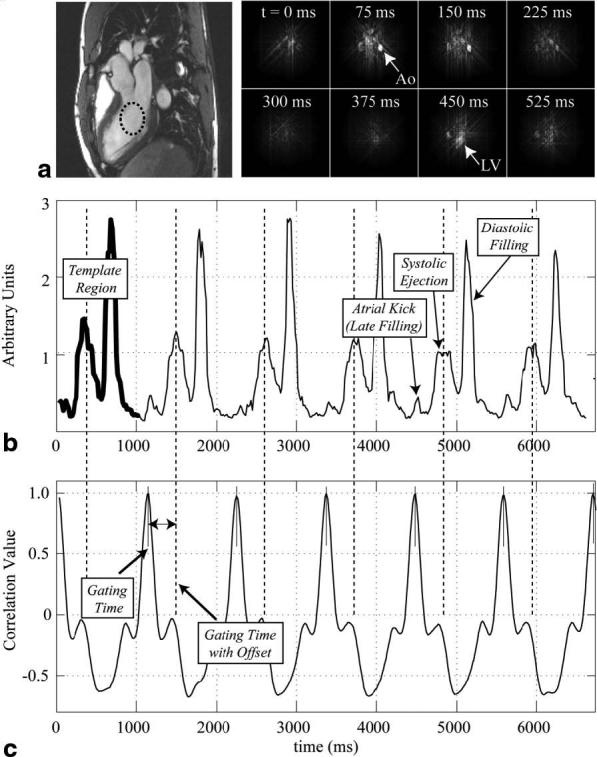
a: A series of real-time complex-difference images acquired with a three-chamber view image orientation from a normal volunteer highlight the flow weighting in the descending aorta and LV cavity for several time frames across systole and early diastole. A magnitude image is shown on the left. b: A real-time flow-gating waveform from the LV cavity, from a region shown in part a, is displayed with a template region highlighted with a thick line. LV filling and ejection flow features are identified. c: The correlation of the template waveform and the real-time flow-gating waveform in b is shown for each offset of the template with respect to the flow data. Gating times shown in c were calculated as the local maxima of the correlation coefficients, or as a constant offset from these times.
Figure 3a displays a series of real-time complex-difference images that highlight the flow in the ascending aorta at the level of the aortic valve plane. Each image was reconstructed using the views from a single segment of k-space (eight lines), as outlined in Fig. 1. Figures 3b and 3c display magnitude and PC images that were retrospectively reconstructed from the real-time data using the flow-gating timings derived from the complex difference data, as shown in Fig. 3a. The flow-gating waveform in the lower half of Fig. 3d was calculated using the complex-difference signal intensities from within a circular region surrounding the ascending aorta from Fig. 3a. The vertical lines plotted with the flow-gating waveform indicate the timing of the maximum correlation coefficient between the template region and the flow waveform. Figure 3d also displays the raw ECG signals recorded throughout the same PC experiment. The difference between the timing of the ECG and flow-gating times (Δt in Fig. 3d) was measured for each pair of times. This analysis was repeated for five normal volunteers, for each of the four regions considered in this study. Table 1 displays the mean standard deviations (SDs) between the timing of the ECG gating and flow-derived gating times for each region. Figure 3e displays flow-gating waveforms from within the ascending and descending aortas, from the same data set shown in Fig. 3a-d. The two waveforms are offset by ∼47 ms, which most likely reflects the delay in the pressure wavefront from the aortic valve plane to the location in the descending aorta. These results clearly illustrate the ability of this method to resolve the spatial location of the gating signal. The flow-gating waveform calculated using the complex-difference k-space data is also plotted in Fig. 3e. Note that there is a contribution from the diastolic flow phase in this waveform that is not present in the other two spatially localized flow-gating waveforms. Additionally, notice that the timing of the rising edge of the k-space-derived waveform falls in between the ascending and descending aorta curves.
FIG. 3.
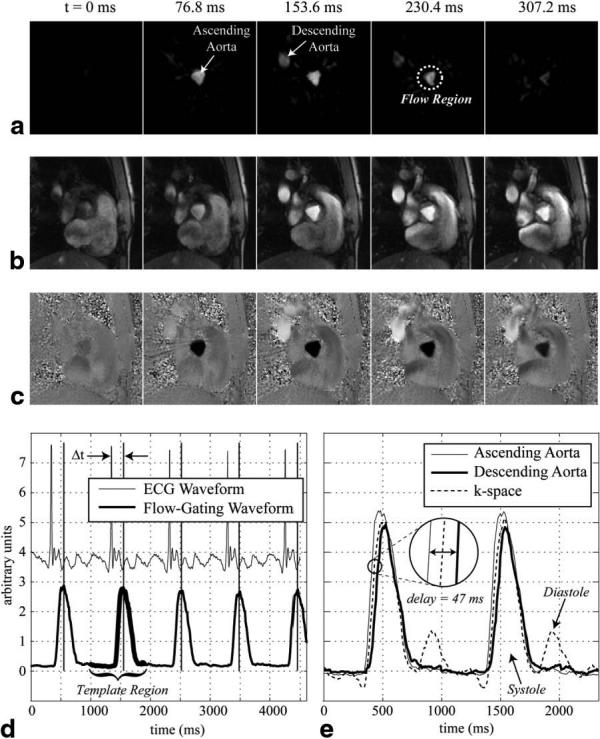
a: A series of real-time complex-difference images acquired from the level of the aortic valve plane in a normal volunteer clearly show the flow weighting in both the ascending and descending aortas for several time frames across systole. Retrospectively reconstructed magnitude and PC images with matching cardiac phases are shown in b and c. A flow-gating waveform, measured from the ascending aorta shown in part a, is plotted in d. A portion of the flow-gating waveform used as a template to derive the times of the gating impulses is highlighted. The corresponding gating times are indicated in d by the vertical lines. The ECG waveform recorded throughout the PC experiment is also plotted in d. Three different flow-gating waveforms measured from this same experiment are shown in e. Two image space measurements, from the ascending and descending aortas, are compared with a k-space measurement. The waveforms were normalized to fall on an axis with the same scale.
Table 1.
SD of the Difference Between ECG and Flow-Derived Gating Times
| Aorta | Pulmonary artery | LV chamber | Renal artery | |
|---|---|---|---|---|
| Image space (N = 5) | 4.2 ± 1.5ms | 5.1 ± 1.9ms | 10.9 ± 2.5ms | 11.6 ± 10.2ms |
| k-space (N = 5) | 4.5 ± 1.7ms | 5.0 ± 0.9ms | 9.5 ± 3.6ms | 12.5 ± 11.5ms |
Figure 4a displays a diastolic three-chamber view magnitude image acquired with a standard gated-segmented, cine SSFP protocol. Figure 4b-e display magnitude and velocity images acquired with the retrospective flow-gating PC method for the same slice prescription as in Fig. 4a. The PC images display velocity in the up–down direction for systolic and diastolic phases in Fig. 4d and e, respectively, with matching magnitude images in Fig. 4b and c. Velocity images sensitive to motion in the left–right direction (not displayed) were acquired in the same experiment using a three point flow-encoding scheme (11). A real-time complex-difference signal from within LV cavity (ROI #2 in Fig. 4a) was used to generate the flow-gating waveform for this experiment. Figure 4f displays a sample of the real-time complex-difference flow waveform from the ROI within the LV cavity (ROI #2 in Fig. 1a) and from within the descending aorta (ROI #1). Note that the LV signal shows sharp increases in intensity during systole and again during diastole, while the aortic signal shows only a systolic peak, with a slight delay as compared to the ventricular signal, as expected. Figure 4g displays the velocity of a single pixel from the gated-segmented PC experiment showing the systolic and diastolic phases of the blood flow in the LV cavity. The location of the pixel is shown in Fig. 4d and e. The velocity curve from a single cardiac cycle was repeated for a comparison of the results with the real-time complex-difference patterns in Fig. 4f. The systolic and diastolic phases of the cardiac cycle are clearly visualized in Fig. 4f and g, with very similar patterns visible in both figures.
FIG. 4.
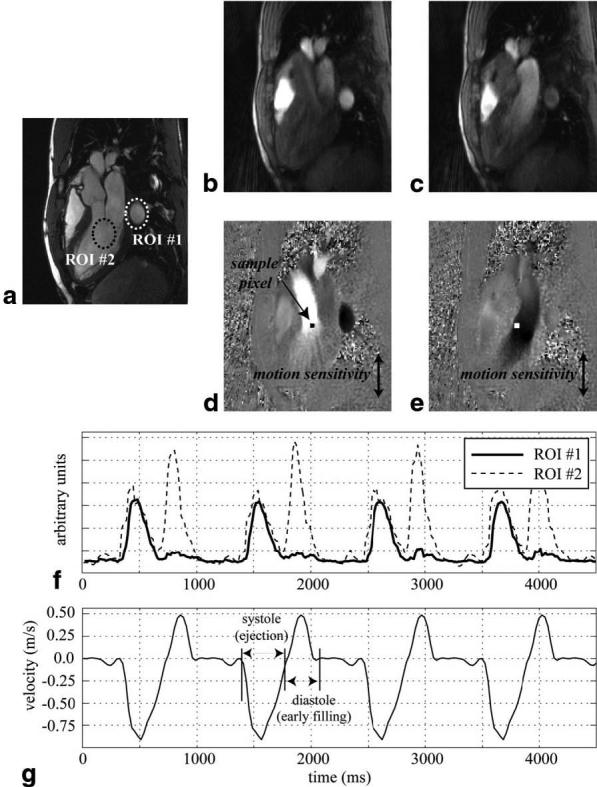
a: An SSFP three-chamber view image displays the locations of two ROIs used to extract flow-gating waveforms from a self-gating PC experiment with the same slice orientation. Two frames from the PC experiment, during (d) systole and (e) diastole, display the velocity in the up–down direction (white–black), with matching magnitude images in b and c. Flow-gating waveforms from the two ROIs are shown in f. The velocity from a sample pixel from the retrospectively reconstructed PC experiment is plotted in g. The location of the pixel is indicated in d and e. The PC images were reconstructed using gating times derived from the flow-gating waveform from ROI #2.
Figure 5a displays a single magnitude image, at peak systole, from the high-temporal-resolution ECG-gated PC experiment. The flow rate through the ascending aorta was calculated with five variable magnitudes of ECG trigger jitter in the retrospective reconstruction. Figure 5b shows that there is negligible impact for a random error of ≤15 ms, with noticeable differences for the 30-ms case and significant differences for trigger jitters of 50 and 80 ms.
FIG. 5.
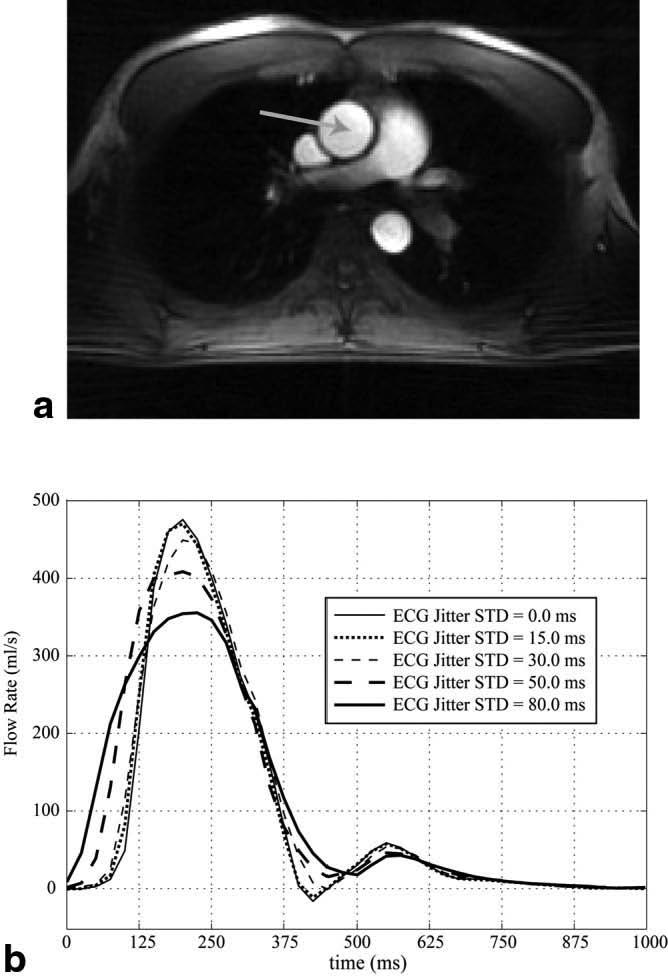
a: An axial magnitude image from a retrospectively gated PC experiment shows a cross section of the ascending aorta, indicated by the arrow. b: The integrated flow rate from the ascending aorta is shown throughout a cardiac cycle for five different amounts of random error (jitter) in the timing of the ECG R-wave.
DISCUSSION
PC experiments with radial k-space sampling patterns can be used to reconstruct images in real time as well as with conventional gating and segmentation, using the real-time information to derive the gating times for retrospective reconstruction. The gating signal was calculated from a flow-gating waveform that was measured from the series of real-time images. Complex-difference processing of the PC data simplified the image content sufficiently to provide adequate image quality for regional segmentation with as few as four projection angles. Specifically, the image information that remained after complex-difference subtraction was performed was limited to simple shapes from vessel and chamber cross sections. The real-time complex-difference data were processed using the raw k-space or image-space information. The k-space method allowed for very fast, user-independent calculations of the flow-gating waveform with no spatially-dependent information, while the image-space methods required regridding and Fourier transformation of the k-space data and user interaction to select a ROI. Despite the additional overhead involved, the ability to target blood flow from a localized region to measure the gating waveform is a valuable feature of this method, and will be especially useful for measuring fetal blood flow in order to differentiate between the maternal and fetal cardiac cycles. For free-breathing applications, such as fetal cardiac imaging, the selection of ROIs that encompass the range of breathing motion of the target vessel could be used to keep the vessel in the localized region.
The accuracy of the trigger timings measured from the flow-derived gating signals was quantified by comparison with recorded ECG traces. The SD of the difference between the two methods ranged from 5 to 12 ms in five normal volunteers, and flow-gating times were successfully measured for all of the flow regions studied in the volunteers. The accuracy of the flow-derived trigger times was lower in the LV cavity for a three-chamber slice orientation and the renal arteries, most likely due to the lower signal-to-noise ratios (SNRs) in these regions as compared to the aorta and pulmonary artery. In particular, cross-sectional imaging of the great vessels offers the advantage of significant inflow signal enhancement and large through-plane velocities during systole, both of which modulate the complex-difference signal intensity.
A template matching method was used to derive the gating times for all cases in this study. While several of the examples used in this study had simple flow waveforms with very high SNR, these ideal conditions will not exist for all slice orientations, target vessels, and patients. Lower SNR due to lower flow rates and waveforms with multiple peaks in the flow waveform, from systole and diastole or from multiple contributing vessels, make simple peak detection using the raw flow waveforms problematic. Correlation methods, such as the template matching method used in this study, can take complex waveforms into consideration, and can actually benefit from complex coherent waveforms in identifying the repetition of patterns.
The success of the methods developed in this study benefited greatly from the unique characteristics of the non-Cartesian k-space trajectories. In particular, the radial acquisition method allowed the center of k-space to be measured for every line acquired, and thus to be updated very rapidly, every 9–10 ms in this study. Also, we have shown that regions of space (such as the LV chamber or a desired artery) can be selectively targeted for real-time, flow-weighted imaging with as few as four projections. While the true temporal resolution of the real-time, complex-difference images are not simply defined with the sliding-window reconstruction method, we nonetheless illustrated that trigger times can be identified within 5–12 ms of those measured with the ECG R-wave. A study of the impact from the error of trigger timings illustrated that errors with SD < 15 ms are negligible for the case of blood flow in the ascending aorta. All regions considered in this study gave rise to <15 ms of trigger jitter, as compared to the timing of the ECG R-wave, and thus most likely would allow retrospective reconstruction of segmented images without significant artifact.
Presently, the flow-gating approach is limited to single-slice acquisitions, and the region used to derive the gating timings is thus limited to this slice. A potential pitfall of the flow-gated method is limitations in SNR. In particular, if the ROI has very limited flow, with very low velocities, the complex-difference signal intensity from only four to eight projections will have reduced SNR, which will contribute to uncertainty in the trigger times. As with all PC experiments, the user must take care to select an appropriate Venc to ensure an optimal velocity to noise ratio. Although this study focused on the use of radial acquisitions, it is feasible to generate a flow-gating waveform using data from conventional Cartesian PC experiments. In particular, the drastic image simplification achieved with complex-difference processing allows for imaging with significant reductions in FOV, which may allow real-time imaging for generation of the flow-gating signal. While this study was limited to applications of retrospective gating, the flow-gating signal is appropriate for prospective triggering. In particular, the methods described in this study could be used in conjunction with other imaging methods, with the flow-gating tools used solely to wait for and detect a flow-derived trigger. This approach would have to incorporate a shorter-duration template in order to provide a correspondingly shorter window for the detection of the targeted flow waveform. Studies of myocardial deformation—particularly those employing tissue tagging—could benefit from the use of a tunable gating tool to allow triggering at the time of the atrial kick (following the electrical P-wave, and prior to the QRS) in order to capture the onset of contraction.
Footnotes
This article is a US Government work and, as such, is in the public domain in the United States of America.
REFERENCES
- 1.Nayler GL, Firmin DN, Longmore DB. Blood flow imaging by cine magnetic resonance. J Comput Assist Tomogr. 1986;10:715–722. doi: 10.1097/00004728-198609000-00001. [DOI] [PubMed] [Google Scholar]
- 2.Pelc NJ, Herfkens RJ, Shimakawa A, Enzmann DR. Phase-contrast cine magnetic resonance imaging. Magn Reson Q. 1991;7:229–254. [PubMed] [Google Scholar]
- 3.Barger AV, Peters DC, Block WF, Vigen KK, Korosec FR, Grist TM, Mistretta CA. Phase-contrast with interleaved undersampled projections. Magn Reson Med. 2000;43:503–509. doi: 10.1002/(sici)1522-2594(200004)43:4<503::aid-mrm3>3.0.co;2-0. [DOI] [PubMed] [Google Scholar]
- 4.Wedeen VJ, Rosen BR, Buxton R, Brady TJ. Projective MRI angiography and quantitative flow-volume densitometry. Magn Reson Med. 1986;3:226–241. doi: 10.1002/mrm.1910030206. [DOI] [PubMed] [Google Scholar]
- 5.Bernstein MA, Ikezaki Y. Comparison of phase-difference and complex-difference processing in phase-contrast MR angiography. J Magn Reson Imaging. 1991;1:725–729. doi: 10.1002/jmri.1880010620. [DOI] [PubMed] [Google Scholar]
- 6.Polzin JA, Alley MT, Korosec FR, Grist TM, Wang Y, Mistretta CA. A complex-difference phase-contrast technique for measurement of volume flow rates. J Magn Reson Imaging. 1995;5:129–137. doi: 10.1002/jmri.1880050202. [DOI] [PubMed] [Google Scholar]
- 7.Thompson RB, McVeigh ER. Real-time volumetric flow measurement with complex-difference MRI. Accepted for publication in Magn Reson Med. 2003;50:1248–1255. doi: 10.1002/mrm.10637. [DOI] [PMC free article] [PubMed] [Google Scholar]
- 8.Peters DC, Korosec FR, Grist TM, Block WF, Holden JE, Vigen KK, Mistretta CA. Undersampled projection reconstruction applied to MR angiography. Magn Reson Med. 2000;43:91–101. doi: 10.1002/(sici)1522-2594(200001)43:1<91::aid-mrm11>3.0.co;2-4. [DOI] [PubMed] [Google Scholar]
- 9.Atkinson DJ, Edelman RR. Cineangiography of the heart in a single breath hold with a segmented turbo FLASH sequence. Radiology. 1991;178:357–360. doi: 10.1148/radiology.178.2.1987592. [DOI] [PubMed] [Google Scholar]
- 10.Riederer SJ, Tasciyan T, Farzaneh F, Lee JN, Wright RC, Herfkens RJ. MR fluoroscopy: technical feasibility. Magn Reson Med. 1988;8:1–15. doi: 10.1002/mrm.1910080102. [DOI] [PubMed] [Google Scholar]
- 11.Pelc NJ, Bernstein MA, Shimakawa A, Glover GH. Encoding strategies for three-direction phase-contrast MR imaging of flow. J Magn Reson Imaging. 1991;1:405–413. doi: 10.1002/jmri.1880010404. [DOI] [PubMed] [Google Scholar]