Summary
Magnetic resonance imaging with tissue tagging is a noninvasive technique for measuring three-dimensional motion and deformation in the human heart. Tags are regions of tissue whose longitudinal magnetization has been altered before imaging so that they appear dark in subsequent magnetic resonance images. They then move with the underlying tissue and serve as easily identifiable landmarks within the heart for the detailed detection of motion. Many different motion and strain parameters can be determined from tagged magnetic resonance imaging. Strain components that are based on a high density of tag data, such as circumferential and longitudinal shortening, or parameters that are combinations of multiple strain components, have highest measurement precision and tightest normal ranges. The pattern of three-dimensional motion and strain in the heart is important clinically, because it reflects the basic mechanical function of the myocardium at both local and global levels. Localized abnormalities can be detected and quantified if the pattern of deformation in a given heart is compared to the normal range for that region, because normal motion and strain in the left ventricle is spatially heterogeneous. Contraction strains typically are greatest in the anterior and lateral walls and increase toward the apex. The direction of greatest contraction lies along a counter clockwise helix from base to apex (viewed from the base) and approximates the epicardial muscle fiber direction. This fiber geometry also results in long-axis torsion during systole. Ejection is accomplished primarily by radially inward motion of the endocardium and by descent of the base toward the apex during systole.
Keywords: Magnetic resonance imaging, Human heart, Three-dimensional strain, Tissue tagging
Accurate three-dimensional (3D) measurement of myocardial deformation throughout the heart during contraction is critical to a fundamental understanding of myocardial function (1). Such an analysis is valuable clinically because most ischemic heart disease, the leading cause of death in the United States, typically affects localized regions of the myocardium (2). The time-resolved local strain map of a heart, as compared to a normal database, permits quantification of both the degree and the physical extent of mechanical dysfunction. In addition, it can be used to improve cardiac analytic and finite element models (3-5), which may help characterize tissue properties and predict the effects on the heart of specific abnormalities and surgical treatments.
There are two main problems associated with measuring cardiac deformation. First is the scarcity of readily identifiable landmarks on, and especially within, the heart wall. The second difficulty is that the complex 3D motions of the heart through tomographic images prevent tracking of the same section of tissue throughout the cardiac cycle with a fixed image plane. Computed tomography, conventional magnetic resonance imaging (MRI), and two-dimensional (2D) ultrasound all suffer from this through-plane motion.
Tagged MRI, however, can evaluate local 3D mechanical function throughout the normal and ischemic heart. Because it also is noninvasive and nonionizing, it may have great potential as a clinical screening or diagnostic test. Furthermore, concurrent advances in myocardial perfusion and coronary angiography with magnetic resonance (MR) may permit the long-term goal of a comprehensive cardiac examination with MRI, able to identify stunned and hibernating tissue and to differentiate viable from nonviable myocardium. If many of the current diagnostic modalities, such as echocardiography, thallium imaging, and coronary catheterization, can be replaced with MRI in a sufficient proportion of patients, this long-term goal may become a reality in the current cost-driven environment of health care.
METHODS OF CARDIAC MOTION DETECTION
Because of the lack of detectable intramyocardial landmarks, many earlier studies used 2D motion data from endocardial or epicardial surfaces. The best-characterized anatomic feature of the heart in two dimensions is the epicardial surface. Earlier methods included X-ray video tracking of the heart borders using multiple projections (6). Later, tomographic data were used for surface contour information. By analyzing simple contour position and curvature evolution from multiple image planes, heart surface motion could be detected in the radial direction and estimated within the myocardium by using continuum mechanics assumptions (7).
Improvement over surface shape analysis involved detecting identifiable landmarks on the heart surfaces. Cine angiography allows detection of epicardial vessel bifurcation points, and these have been used by several groups to directly measure 2D deformation of the epicardium (8-10). Both the contour and vessel bifurcation methods are limited by low information density; therefore, the spatial resolution of the measurable strain is severely limited.
An early and successful solution to the limited landmark problem was to implant radiopaque markers (11-15) into the myocardium followed by cine X-ray visualization. In humans, such invasive techniques have been limited to heart transplant recipients (16-18). Implantation of sonomicrometers (19-23), which use ultrasound to measure changes in distance between crystals or between a crystal and the heart surface, also have been used in animals, but this method is too invasive for clinical use.
Inhomogeneities within the myocardium have been used for detecting deformation. This texture information in cardiac images can be analyzed using the principles of optical flow (24) and originally were applied to 2D motion, as for cine ultrasound images of the heart (25,26). In this method, intensity features in an image plane are assumed to persist through multiple times and not change their intensity, called the brightness constraint. In addition, a smoothness constraint is imposed on the velocity field because the heart is assumed to behave as a continuous structure, not a cluster of independent points. The optimized solution to the velocity field at a point in the heart is calculated by minimizing a cost function containing a smoothness term and the brightness error. A problem with this method is the assumption that an intensity feature in a fixed image plane can be identified through time, despite the through-plane motion of the heart.
Magnetic resonance is unique among imaging modalities in that it can be tuned to measure many different tissue properties, such as proton density, diffusion, velocity, acceleration, temperature, and spectroscopic properties, in addition to the magnetic relaxation times T1 and T2. Velocity imaging, with phase-contrast MRI techniques (27-30), has been used to measure motion throughout the heart. MRI also is unique because it permits the alteration of signal properties of the sample before imaging. This is the basis for myocardial tissue tagging.
Tissue tagging
Myocardial tissue tagging was first described by Zerhouni et al. (31) in 1988. A tag is a region of the sample where the longitudinal magnetization has been altered before imaging, so that there is contrast between that region and the rest of the sample. Because the actual protons in this region have been magnetically perturbed, these tags move with the underlying tissue (32-34). Tag generation uses the same magnetic field gradients and radiofrequency (RF) emissions used in standard MRI and can be carried out using any clinical scanner.
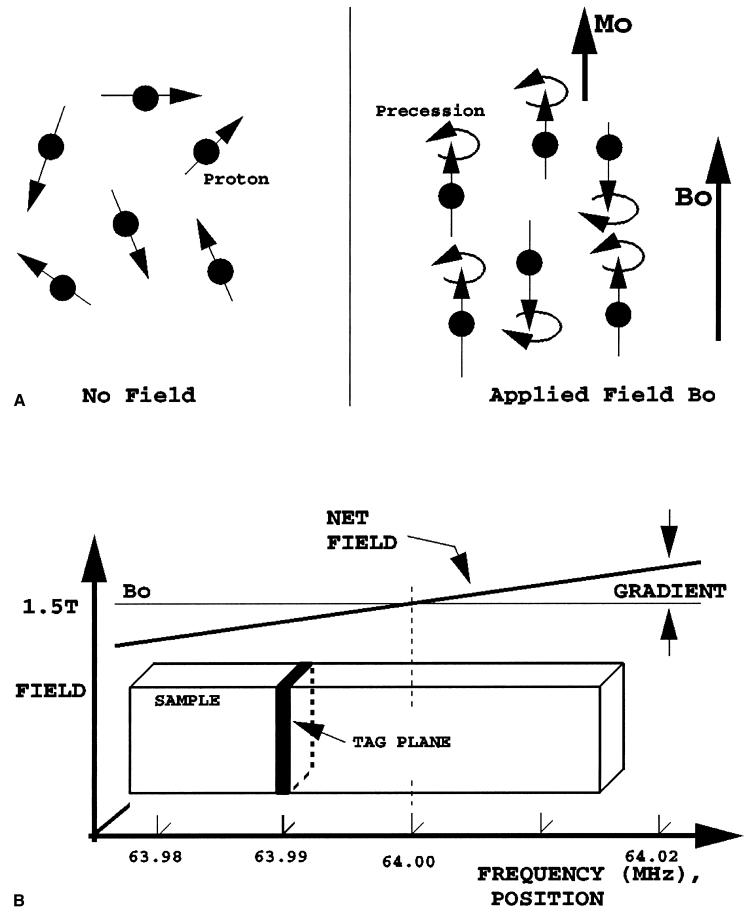
Because tags are alterations in longitudinal magnetization, they are transient and decay exponentially with longitudinal relaxation time constant T1. In the heart, T1 is about 600 ms, which permits tracking of tags from end-diastole to end-systole or beyond. Typically, the tagging imaging sequence is gated to the electrocardiographic QRS complex, with repeat tagging with each heartbeat. A diagram of the basic tagging process is shown in Fig. 1.
FIG. 1.
Tag plane generation. A: Protons that initially are oriented randomly (left) become aligned and polarized (Mo) in the static field (Bo) of the scanner. They then begin to precess about the field at a frequency proportional to the field strength, just as a gyroscope begins to trace out a circular path when standing on its end. B: Magnetic field gradient and radiofrequency energy are used to select and invert the magnetization only on the resonant tag plane, where the local field strength causes proton precession to occur at the same frequency as the applied radiofrequency pulse (63.99 MHZ in this example).
The first MR tissue tagging protocol by Zerhouni et al. used radially oriented tag planes sequentially generated about the cardiac long axis, followed by orthogonal spinecho imaging in the short axis. This radially oriented geometry was chosen because it was well suited to the heart geometry. The addition of long-axis images with tags parallel to the short axis permitted detection of 3D motion throughout the heart. Example short- and long-axis images from the radial tagging protocol are shown in Fig. 2.
FIG. 2.
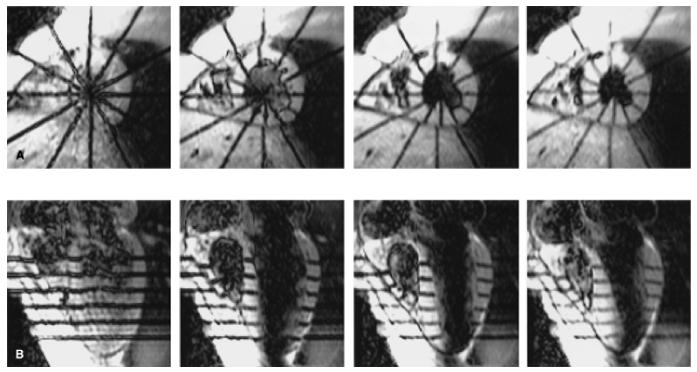
Tagged human heart images. A: Short-axis images from an equatorial image plane at 15, 90, 165, 240 ms (left to-right) after the end of the tagging sequence. Six tags are radially oriented and centered about the long axis of the left ventricle. B: Long-axis section at the same times shown with tags parallel to the short axis. The right ventricle is to the left on all images.
The sequential tag plane generation method was modified by Bolster et al. (35) to have intensity modulation along tag planes, so that tag lines would appear as sequential dark tagged points. This modification allowed identification of intramyocardial positions, without the need to rely on the intersection of tag lines with the endocardial and epicardial surfaces, which often were more difficult to define. An example of a short-axis image with these striped tags at early, middle, and late systole is shown in Fig. 3.
FIG. 3.

Striped radial tagging. Short-axis section at early, middle, and late systole is shown. Individual points along the tags can be identified within the heart wall, permitting evaluation of endocardial and epicardial thickening. The endocardial and epicardial surfaces are not needed to define three-dimensional strain. The right ventricle and chest wall are located to the upper left.
Axel and Dougherty (36) described a major advancement in tagging, called SPAMM (spatial modulation of magnetization), that permitted the simultaneous and rapid generation of multiple parallel tags across the sample. This sequence generated parallel waves of dark and light bands across the entire image. In this tagging sequence, the entire sample is excited with a 90° RF pulse, followed by a gradient pulse to generate a linear phase shift across the sample along the direction of the gradient. The gradient area determines the spatial frequency of the phase roll and, hence, the closeness of the tag stripes. The second 90° RF pulse rotates a component of the transverse magnetization back to the longitudinal direction, such that there is a sinusoidal modulation to the longitudinal magnetization. This modulation will produce the tag pattern in subsequent images. The major disadvantages were a wide tag width and indistinct edges, leading to limited tag density and loss of about half the image signal due to the tagging.
The tag profiles soon were improved by using multiple RF pulses and more intervening gradient lobes to narrow the tag widths (37). Original SPAMM had two RF pulses with a 1:1 amplitude pattern and an intervening gradient, generating a sinusoidal magnetization variation. Instead of considering these two pulses as an excitation and a reversal to restore longitudinal magnetization, they can be thought of as a short spike train. Because a spike train in one domain maps to a spike train in the Fourier domain, using more RF pulses will make tags better approximating an impulse train themselves (multiple thin tag planes). It is a basic principle in tagging sequence design that the Fourier transform of the desired tag pattern can be used to determine the RF pulse shape and gradient trajectory required (38,39). With these narrow tags, two sequential tagging sequences oriented at 90° often are used, creating a grid pattern.
Mosher and Smith (40) further narrowed the tag width by using a rapid, constant-amplitude train of eight or 32 RF pulses in the presence of a continuous gradient. This tagging sequence is called DANTE (delays alternating with nutations for transient excitation). This variant has the advantages of narrow tags and rapid generation, because the gradients are held constant, but has the disadvantage that the tagging pattern is attenuated at the edges of the field of view.
Cardiac imaging
Although MRI of the brain and body became established early, cardiac MR has been much more challenging. The major technical problems are associated with the complex motions of the heart, blood, and lungs that produce phase artifacts, blurring, and misregistration. The development of motion-insensitive sequences with short echo times greatly reduced the phase artifacts and sped up the imaging so that it could be completed in a breath-hold.
A prototype tagging and breath-hold imaging sequence described by McVeigh et al. (41,42) was one of the first to solve these motion and speed issues for tagged cardiac imaging. The sequence is cardiac gated, using parallel plane tagging (a hybrid of DANTE and SPAMM) and blood saturation (43) with each cardiac cycle. Blood saturation reduces the magnetization of atrial blood just before it enters the ventricles, making ventricular blood dark and greatly improving the definition of the endocardial surface. Cine imaging immediately follows, using only half of a gradient-recalled echo (partial echo) to minimize the echo time and repetition time (TE ≈ 2.3 ms and TR ≈ 6.5 ms on a 1.5-T standard Signa scanner). It also generated multiple echoes for each image frame during the heart cycle (segmented k-space) to reduce the number of heartbeats required to make a cine sequence of images. With the typical segmentation factor of 5 and partial echo generation, the imaging is sped up by a factor of almost 10, permitting breath-hold imaging. The number of heartbeats needed equals the phase-encoding resolution divided by the segmentation factor, rounded up to the next integer. With the typical phase-encoding pixel resolution of 110, 22 heartbeats are required, taking about 25 seconds. The time between sequential images in the cine sequence (temporal resolution) is the product of the segmentation number and the TR. For typical heart rates, 9-12 images spaced every 32.5 ms were acquired during systole.
The major trade-off of this fast imaging technique is that the images have a lower signal-to-noise ratio (SNR) than the earlier spin-echo images. Because of the rapidity with which the same section is excited (short TR), there is less time to allow longitudinal magnetization to recover between excitations. Therefore, the tip angles must be low (typically 10-15°), using less magnetization with each excitation so that longitudinal magnetization would persist long enough to complete the imaging. For typical images in this sequence (field of view 30 cm, thickness 7-8 mm, 110 phase-encoding steps with 256 × 110 matrix, ±32-kHz bandwidth, 12° flip angle, surface coil) SNR was 10-15, compared to the earlier spin-echo images, which had an SNR of about 50-100.
A typical imaging tagging protocol for the left ventricle (LV) with this sequence uses three sets of tagged cine MR images with 32.5-ms temporal resolution. There are two sets of six parallel short-axis sections with mutually orthogonal tags, and one radially oriented set of six long-axis sections spaced every 30° with tags perpendicular to the long axis. Representative short- and long-axis images at early, middle, and late systole are shown in Fig. 4 to illustrate the image and tag orientation and the ability of tags to depict the underlying myocardial deformation.
FIG. 4.
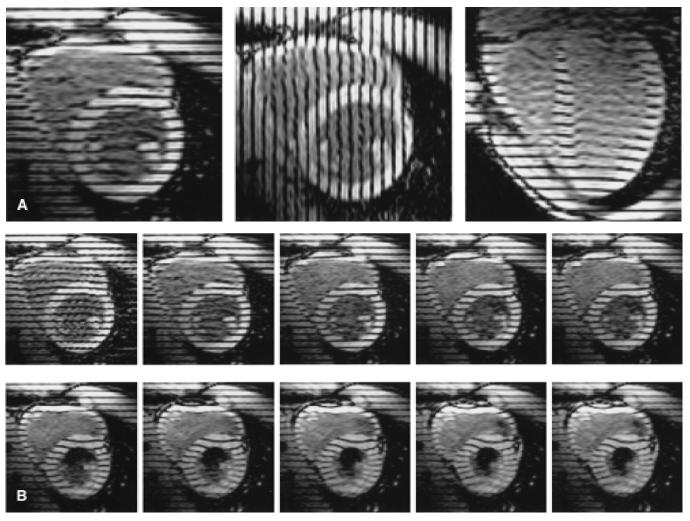
Parallel tagged images. Three sets of cine images are acquired to obtain three-dimensional displacement data throughout the heart: two sets in the short axis with mutually perpendicular tags, and a third set oriented radially about the long axis with tags parallel to the short axis. A: Early systolic time frame from one image plane of each set (long-axis image to the right). B: Ten consecutive images from a basal short-axis plane demonstrate tag motions during systole. The right ventricle is to the upper left in each image.
Three-dimensional motion and strain calculation
Once the tagged cine sequences of images are acquired, the tag displacement data at each time frame are used to calculate the 3D displacement and deformation throughout the heart. First, the heart contours and positions of tags within the images are determined. Because there typically are several hundred images, semiautomated algorithms have been developed to speed the image segmentation (44,45).
A deformed tag line in an image gives only one-dimensional displacement information along a direction perpendicular to the undeformed tag plane. Such points of tagged myocardium need not have originated in that image plane; they could have come from anywhere on the original tag plane. Thus, the one-dimensional displacement data from at least three sets of tagged images must be integrated to calculate true 3D motion. The 3D reconstruction must interpolate spatially among tag lines and image sections in order to allow tracking of any point of myocardium, called a material point, through time. Multiple 3D reconstruction methods exist, including local spatial interpolation (46,47), optimization to a mathematical 3D displacement expression (48,49), finite element analysis (50), optical flow techniques (51,52), and, most recently, harmonic phase analysis (53-55). The harmonic phase technique is much more rapid than the previous methods, because image segmentation to define the contours and tags, which requires significant manual input, is not needed. This advance may permit strain analysis to be carried out at the time of the scan, which would be of enormous clinical benefit. Finally, the deformations are calculated from the spatial variations of 3D displacement.
The mechanical description of deformation at a point of myocardium, relative to a reference time such as end-diastole, is contained in a 3D displacement term (called a vector), a 3D rotation term, and a 3D strain term (called a tensor). Displacement describes how a material point translates in 3D space. Rotation describes how an object spins about three coordinate axes. Strain is a description of the 3D shape changes of a small volume element. Strain includes length changes along each coordinate direction (normal or axial strains) as well as relative angle changes (shears) between pairs of vectors that originally were oriented along coordinate directions. A cube, for example, undergoing three differing axial stretches would become a larger rectangular block. A cube undergoing 3D shear would have its square faces turned into diamonds but would maintain the same volume.
Once strain is calculated, it can be expressed in any coordinate system. Usually the radial-circumferential-longitudinal system is used, because it is well suited to the cardiac geometry. Radial is perpendicular to the epicardial surface, directed outward. Circumferential lies in the short-axis plane and is tangent to the heart surface, directed counterclockwise as viewed from the base. Longitudinal is perpendicular to the first directions, directed to increase toward the base. A second useful coordinate system is the principal coordinate system, which is a set of three mutually perpendicular axes along which the axial strain magnitudes are maximized and the shears are zero. In general, each material point will have its own set of principal directions (called eigenvectors), because it has a unique 3D strain. Finally, the axial strains can be expressed as fractional or percent length changes, which often are easier to understand than true Lagrangian strain that is a nonlinear function of length change.
Additional strain-based parameters have been studied. One is a radial length change that is calculated to conserve the volume of the myocardial tissue, given the measured contractions and within the plane of the heart wall and the shears (46,56). This measure is helpful when the heart contours (especially the endocardial contour) are difficult to define precisely or there are not enough tags across the heart wall to directly measure radial strain accurately or precisely. Indices of contraction within the plane of the heart wall have demonstrated high measurement precision (56). Torsion of the LV, which reflects differential rotation between the heart base and apex, has been measured with tagging (56-58). Torsion changes have been shown clinically to correlate with graft rejection in heart transplant recipients (17,59).
NORMAL HUMAN LEFT VENTRICULAR DEFORMATION
Tagged MRI has greatly improved the understanding of normal strain in the human heart, particularly in the LV. A recent study in 31 normal human volunteers using the breath-hold, parallel tagging method described earlier is the basis for the following summary of normal human left ventricular motion and strain (56). Data reported by other groups of investigators who evaluated selected components of left ventricular motion and with tagging also are presented.
Displacement
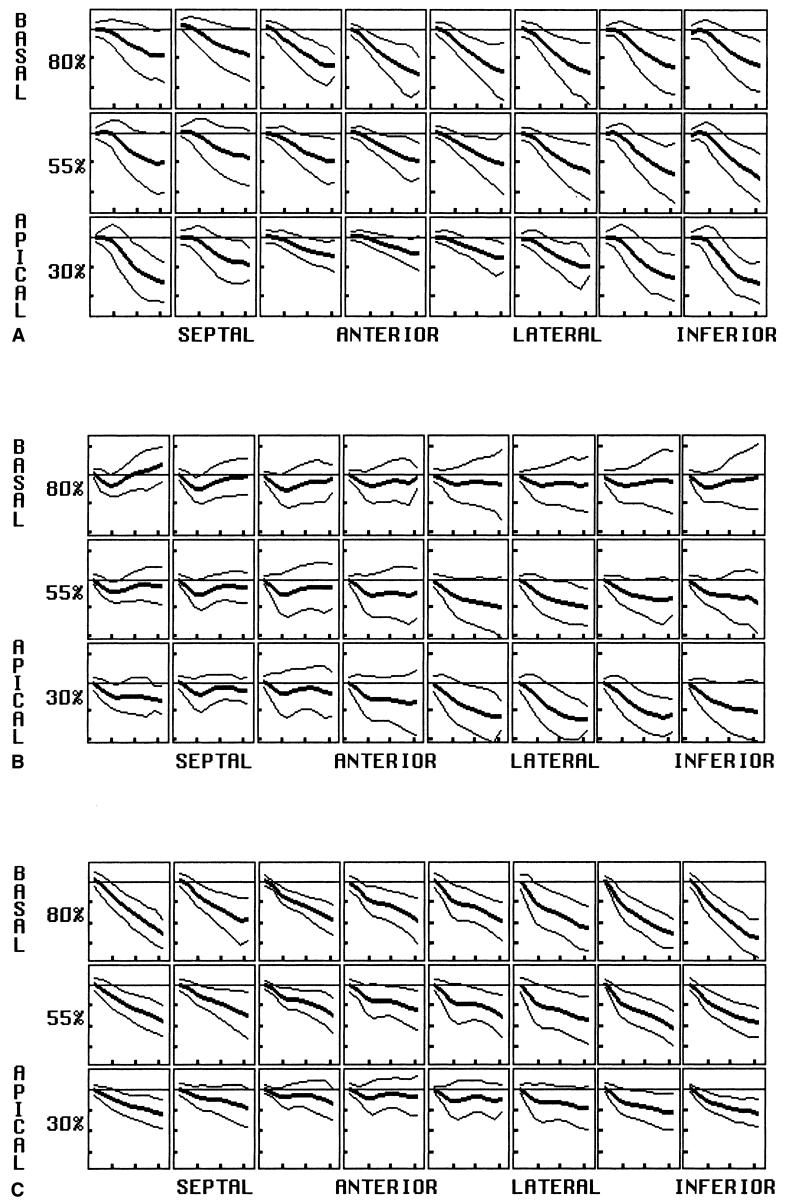
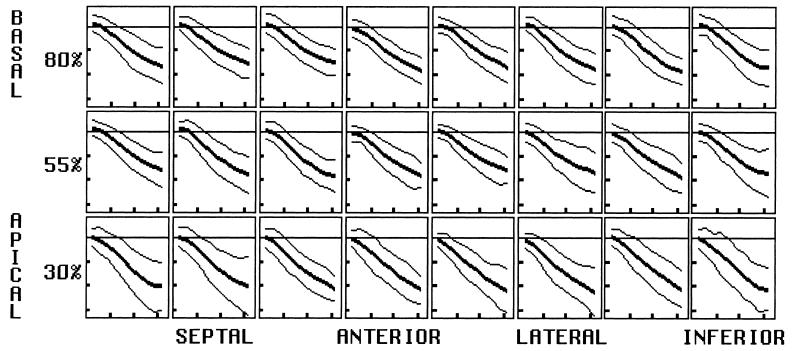
Displacement evolution in the radial, circumferential, and longitudinal directions for an array of midwall material points is shown in Fig. 5. For each displacement, rows represent levels of material points from the base (top) to the apex (bottom), and columns represent material point circumferential position as labeled. Within each box, material point displacement is plotted versus time, and mean and two ±2-SD curves are shown. Displacement demonstrated significant spatial variation, even within individual sectors and levels.
FIG. 5.
Displacement. Plots of displacement for midwall arrays of material points are shown for the radial (A), circumferential (B), and longitudinal (C) directions. Material point position varies by row from basal (top) to apical (bottom), and circumferential position varies as labeled. The percent before each row represents the row’s position as a percent of the distance from the apex to the base. Within each box, displacement is plotted versus time into systole with mean and both 2-SD curves shown. Horizontal tic marks represent 100 ms, and vertical tic marks represent 4 mm. Negative values are below the baseline.
Radial
Radial displacement is directed inward (negative) throughout the LV, despite significant spatial heterogeneity both circumferentially and longitudinally. The magnitude, on average, is smallest in the septum than greatest in the inferior (p < 0.01) and lateral (p < 0.05) walls. It is greatest at the apical inferior wall and least at the anteroapical wall (p < 0.0001). This variation reflects contraction as well as a component of bulk rotation about a transverse (septolateral) axis, with anterior motion of the apex.
Longitudinal
Longitudinal motion throughout the LV is directed toward the apex (negative sign) throughout, except for an early transient at the anterior apex. Bulk rotation about the transverse axis results in displacement magnitudes significantly greater inferiorly (and posteriorly) than anteriorly (p < 0.0001). There is also a strong longitudinal gradient, with displacement magnitudes greatest at the base and decreasing linearly to approximately zero at the apex. Thus, long-axis compression occurs by descent of the base toward the apex.
Circumferential
Circumferential midwall displacement is variable, both spatially and temporally. Circumferential motion, viewed from the base, is clockwise (negative in sign) for the initial 100 ms, before reversing direction to end up nearly unchanged at end-systole. More apically, the initial rotation becomes more prominent and the reverse rotation smaller. At the apex, no significant reversal occurs, except at the septum. This longitudinal gradient of circumferential motion is highly significant from the base to apex (p < 0.0001) and results in prominent torsion of the LV during systole. Circumferential displacement varies to a small extent about the circumference, but angular rotation of material points about the long is homogeneous circumferentially, due to the adjustment made for bulk heart motion.
Torsion
Torsion angle is the rotation of a level about the long axis with respect to the base, with relative clockwise rotation of a level being positive as viewed from the base. The maximal torsion angle at midwall increases linearly toward the apex, by 0.255° ± 0.006° (SEM) per percent of the distance from the base to the apex. The average torsion angle between the basal (80%) and apical (30%) levels also varies significantly across the heart wall. It increases from 10.0° ± 1.6° at the epicardium, to 12.3° ± 2.3° at midwall, to 13.9° ± 3.2° at the endocardium (p < 0.005 for both).
Using radial tagging, Azhari et al. (60) reported that the apical endocardial torsion angle (14.5°) exceeded that at the epicardium (9.2°). Using the same tagging protocol, Buchalter et al. (58) reported endocardial torsion of 12.2° ± 1.3° and epicardial torsion of 11.2° ± 3° at the apex. Based on 2D MRI with grid tagging, Young et al. (50) demonstrated torsion angles of 4-7° at the midventricular level and 12-14° at the apex, with endocardial torsion (16.5°) also exceeding that at the epicardium (10.3°).
Axial strain
Radial
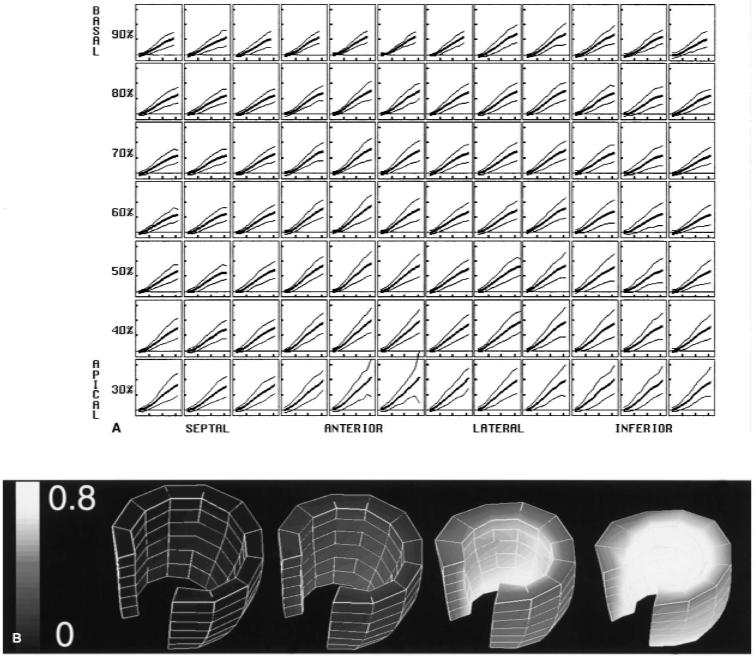
Directly measured radial strain has poor precision, because only two or three tags span the wall of the heart. Where only two tags exist across the wall, only a transmural average can be calculated, despite the presence of true variation across the wall. Using the assumption that the myocardial tissue volume is constant, however, radial strain can be calculated from the remaining strain tensor terms (46,61). Because the radial thickening calculated with the incompressibility constraint is supported by both circumferential and longitudinal tag displacement data, it has greater precision than either one alone. This radial thickening parameter is shown in Fig. 6. Like circumferential strain and longitudinal strain, it is greatest apically. It also is greatest anterolaterally, like the circumferential strain. Average midwall thickening ranged from 46-80%. These data are in good agreement with the other wall thickening estimates based on cine computed tomography [50% ± 15% basally to 72 ± 18% apically (62)], short-axis cine MRI [56% ± 24% basally and 91% ± 29% apically (63)], and radially tagged MRI [55% ± 4%(64)]. Radial strain increases steadily from epicardium to endocardium, as expected from geometric constraints and tissue incompressibility. During heart contraction, inner concentric shells of myocardium have greater percentage decreases in the circumferential and longitudinal directions, requiring greater thickening to maintain a constant tissue volume.
FIG. 6.
Radial strain, calculated with the incompressibility constraint, is expressed as a fractional length change. A: Normal mean and ±2-SD curves are shown throughout the midwall, using a high-resolution material point array. Horizontal tic marks represent 100 ms, and vertical tic marks represent 0.4 (40% thickening). B: Three-dimensional surface rendering of the left ventricle, with the gray scale encoding the mean radial strain (black = 0.0, white = 0.8). Four time frames are shown from end-diastole to end-systole. The base is up, and the anteroseptal wall was removed to demonstrate the variation across the wall. The strain increases toward the endocardium and toward the apex.
Circumferential
Circumferential strain at the midwall is shown in Fig. 7, expressed as a fractional change relative to end-diastole. Normal values are negative, reflecting contraction. Circumferential strain magnitude is greatest in the anterior and lateral walls, and greater apically than basally. Like radial strain, average circumferential contraction increased from the epicardium to the midwall to the endocardium (16% ± 4%, 23% ± 4%, 32% ± 4%, respectively; p < 0.005 for each). Kramer et al. (65) and Palmon et al. (66) each studied 10 volunteers and Young et al. (50) studied 12 volunteers with grid tagging, producing circumferential strains in close agreement. Clark et al. (67), who used grid tagging only in the short axis, reported corresponding values of 22% ± 5%, 30% ± 6%, and 44% ± 6%. Although their values were slightly larger, they also found circumferential contraction, on average, to double from epicardium to endocardium, and to increase toward the apex.
FIG. 7.
Circumferential strain (mean and both 2-SD deviation curves) plotted as fractional length change. Values are negative, representing contraction. The magnitude is greatest in the anterolateral wall and increases toward the apex. Horizontal tics represent 100 ms, and vertical tics represent 0.1 (10 contraction).
The variability across 31 hearts of normal peak circumferential contraction was less than 25% of the average peak value, representing a tight normal range. Circumferential strain is detected with high precision, because there are many tags around the perimeter of the heart to provide a high density of displacement data.
Longitudinal
Longitudinal strain is shown in Fig. 8. It is also greatest apically, but is homogeneous about the circumference. The measurement precision also is high. Longitudinal shortening data reported by Kramer et al. (65), Palmon et al. (66), and Young et al. (50) also are in close agreement.
FIG. 8.
Longitudinal strain (mean and both 2-SD deviation curves) plotted as fractional length change. Values are negative, representing contraction. The magnitude is homogeneous about the circumference but increases toward the apex. Horizontal tics represent 100 ms, and vertical tics represent 0.1 (10% contraction).
Principal strains
The principal strain of greatest elongation is directed approximately radially through out the LV, representing wall thickening. Thus, it is almost identical to radial strain in the normal heart.
The principal strain of greatest contraction is oriented within the plane of the heart wall, at an angle spiraling counterclockwise from base to apex, as viewed from the base. This angle approximates the muscle fiber direction at the epicardium (68,69). Having the maximal contraction at an angle from circumferential results in torsion of the LV. This angle of principal contraction becomes progressively less steep from the epicardium (43° ± 25°) to the midwall (29° ± 22°) to the endocardium (16° ± 19°), with both differences significant (p < 0.005). The angle change across the wall, however, is much less than that of the fibers, which are angled 60-80° at the epicardium, near 0° (circumferential) at the midwall, and 60-80° the opposite direction at the endocardium (68). The principal strain angle varies less due to mechanical interactions (tethering) among the layers of the heart wall. MacGowan et al. (64) studied 10 normal hearts with radially oriented tag planes and found this strain angle to vary from 75° ± 12° at the epicardium to 6° ± 9°at the endocardium. Although this transmural angle change is slightly greater, it also demonstrated a smaller change than that of the fiber angle. The magnitude is greatest in the anterior and lateral walls and least in the septum, like the circumferential and longitudinal strains.
Shear strain
The variability of the shear strains across 31 normal LVs was large compared to their average magnitudes, with the 1-SD curves including 0.0 for all three components. The circumferential-longitudinal Lagrangian shear strain (ECL), however, tended to be positive in sign and was homogeneous circumferentially and increased apically (p = 0.04). This shear term is dominated by the long-axis torsion, which causes an increase in angle circumferentially as a function of position in the long axis. The average circumferential-longitudinal shear angles ranged from 0.01° ± 0.05° to 0.04° ± 0.04°.
Use of normal strain measurements
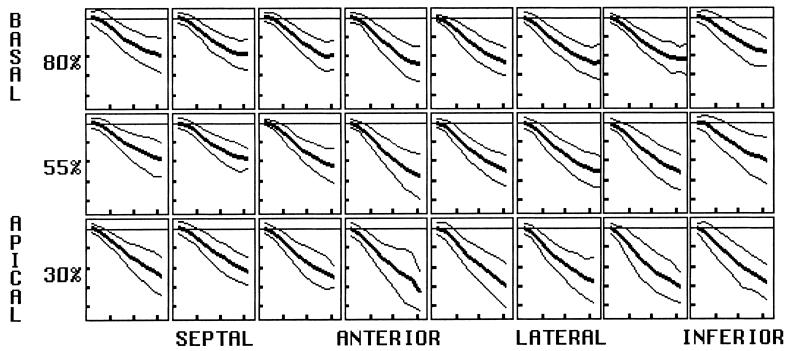
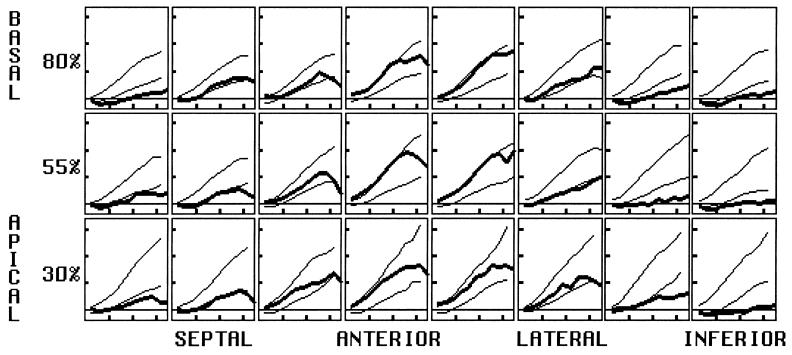
Knowledge of the normal range for 3D strain is essential for quantifying the degree of strain abnormality in an individual LV. Figure 9 plots the radial thickening in a patient, 3 months after a non-q-wave inferior myocardial infarction, against the normal 2-SD ranges. The patient had inferior ST segment elevations that resolved after thrombolysis. The location and degree of residual inferior dysfunction are readily seen.
FIG. 9.
Quantifying strain abnormality. Radial strain evolution at the midwall, calculated using tissue incompressibility and expressed as a fractional length change, plotted from a postinfarct left ventricle versus the normal ± 2-SD deviation limits. The degree and extent of mechanical dysfunction 3 months after a non-q-wave inferior infarction is evident by the regionally decreased thickening. Horizontal tic marks represent 100 ms, and vertical tic marks represent 0.4 (40% thickening).
CONCLUSION
Tagged MRI is a technique to rapidly determine 3D motion and deformation in the human heart. It can be used to measure the temporal evolution of many mechanical parameters, with the measurement precision depending largely on the density and orientation of the tags. Direct measures of radial strain have relatively low precision, compared to circumferential and longitudinal strain, but can be improved using the incompressibility constraint. When parameters with high measurement precision are used, such as radial strain calculated using tissue incompressibility, circumferential strain, or longitudinal strain, the normal strain ranges in the human LV are small compared to their magnitudes.
Although the detailed 3D displacement and strain evolution of the normal LV are complex, there are several dominant patterns. Displacement reflects both regional deformation and bulk motion, producing high spatial variability. A global rotation occurs about a transverse axis near the base, with anterior displacement of the apex. In additional to radial inward motion of the endocardium, compression of the LV along the long axis is an important contributor to ejection. The base descends toward the apex, which remains nearly fixed in long-axis position.
Torsion about the long axis is another dominant mode of deformation. During systole, the base undergoes a transient clockwise rotation, as viewed from the base, before rotating back to its original position by end-systole. The apex, however, rotates steadily clockwise throughout systole and results in a linearly increasing angle with position from base to apex. This torsion is produced by the epicardial muscle fibers, which spiral counterclockwise from base to apex as viewed from the base. Despite reversal of fiber angle at the endocardium, the epicardial fibers dominate because of a larger muscle mass and a greater moment arm about the long axis. This fiber geometry produces an axis of greatest contraction oriented an angle from circumferential, in the direction of the epicardial fibers. Mechanical tethering among layers of the heart limits the change in angle of maximal contraction to be much smaller than the change in fiber angle across the heart wall. Torsion also results in a prominent circumferential-longitudinal shear strain, because there is a gradient of circumferential displacement as a function of longitudinal position. Functionally, torsion tends to equalize sarcomere shortening across the heart wall, optimizing the physiology of actin-myosin interaction. Because the endocardial and epicardial fibers have different orientations, torsion serves to increase fiber contraction at the epicardium and decrease it at the endocardium. This transmural variation counters the geometric constraint of increasing fractional strain with decreasing radius that is required to maintain a constant volume of myocardium.
Axial strain varied predictably in the longitudinal and circumferential directions, with increasing magnitudes apically and in the free wall (except longitudinal strain, which was homogeneous about the circumference). The spatial heterogeneity of strain indicates that strain values should be compared to what is normal for that region instead of being compared to a remote normal zone as has been done traditionally done. This normal heterogeneity in individual hearts and the regional nature of ischemic dysfunction both support the need for high spatial resolution in left ventricular strain analysis. Tagged MRI is unique in permitting such detailed measurement and doing so in a noninvasive and nonionizing manner.
Acknowledgments
I gratefully acknowledge Walter O’Dell, Ph.D., for work on the reconstruction technique; Carlos Lugo-Olivieri, M.D., for acquiring and processing tagged images; Ergin Atalar, Ph.D., for his work on the MRI tagging and imaging pulse sequence; and Michael Guttman, M.S., for providing image segmentation software.
REFERENCES
- 1.Hunter WC, Zerhouni EA. Imaging distinct points in left ventricular myocardium to study regional wall deformation. In: Anderson JH, editor. Innovations in diagnostic radiology. Springer-Verlag; Berlin: 1989. pp. 169–190. [Google Scholar]
- 2.American Heart Association . Heart and stroke facts: 1995 statistical supplement. American Heart Association; Dallas, TX: 1995. [Google Scholar]
- 3.Arts T, Reneman R, Veenstra P. A model of the mechanics of the left ventricle. Ann Biomed Eng. 1979;7:299–318. doi: 10.1007/BF02364118. [DOI] [PubMed] [Google Scholar]
- 4.Arts T, Meerbaum S, Reneman R, et al. Torsion of the left ventricle during the ejection phase in the intact dog. Cardiovasc Res. 1984;18:183–93. doi: 10.1093/cvr/18.3.183. [DOI] [PubMed] [Google Scholar]
- 5.Guccione JM, McCulloch AD. Finite element modeling of ventricular mechanics. In: Glass L, Hunter P, McColluch A, editors. Theory of heart: Biomechanics, biophysics, and nonlinear dynamics of cardiac function. Springer-Verlag; New York: 1991. pp. 121–44. [Google Scholar]
- 6.Kazamias TM, Gander MP, Ross J, Jr, et al. Detection of left ventricular wall motion disorders in coronary artery disease by radarkymography. N Engl J Med. 1971;63:285. doi: 10.1056/NEJM197107082850201. [DOI] [PubMed] [Google Scholar]
- 7.Owen RL, Staib LH, Anandan P, et al. Measurement of left ventricular wall motion from contour shape deformation. Prog Clin Biol Res. 1991;363:541–56. [PubMed] [Google Scholar]
- 8.Potel MJ, Rubin JM, MacKay SA, et al. Methods for evaluating cardiac wall motion in three dimensions using bifurcation points of the coronary artery tree. Invest Radiol. 1983;18:47–57. doi: 10.1097/00004424-198301000-00009. [DOI] [PubMed] [Google Scholar]
- 9.Kim HC, Min BG, Lee MM, et al. Estimation of local cardiac wall deformation and regional stress from biplane coronary angiograms. IEEE Trans Biomed Eng. 1985;7:503–11. doi: 10.1109/TBME.1985.325567. [DOI] [PubMed] [Google Scholar]
- 10.Young AA, Hunter PJ, Smaill BH. Estimation of epicardial strain using the motions of coronary bifurcations in biplane cineangiography. IEEE Trans Biomed Eng. 1992;39:526–31. doi: 10.1109/10.135547. [DOI] [PubMed] [Google Scholar]
- 11.Ingels NB, Daughters GT, Stinson EB, et al. Measurement of midwall myocardial dynamics in intact man by radiography of surgically implanted markers. Circulation. 1975;52:859–67. doi: 10.1161/01.cir.52.5.859. [DOI] [PubMed] [Google Scholar]
- 12.Shoukas AA, Sagawa K, Maughan WL. Chronic implantation of radiopaque beads on endocardium, midwall, and epicardium. Am J Physiol. 1981;241:H104–7. doi: 10.1152/ajpheart.1981.241.1.H104. [DOI] [PubMed] [Google Scholar]
- 13.Waldman LK, Fung YC, Covell JW. Transmural myocardial deformation in the canine left ventricle. Circ Res. 1985;57:152–63. doi: 10.1161/01.res.57.1.152. [DOI] [PubMed] [Google Scholar]
- 14.McCulloch AD, Smail BH, Hunter PJ. Regional left ventricular epicardial deformation in the passive dog heart. Circ Res. 1989;64:721–33. doi: 10.1161/01.res.64.4.721. [DOI] [PubMed] [Google Scholar]
- 15.Douglas AS, Rodriguez EK, O’Dell WG, et al. Unique strain history during ejection in canine left ventricle. Am J Physiol. 1991;260:H1596–611. doi: 10.1152/ajpheart.1991.260.5.H1596. [DOI] [PubMed] [Google Scholar]
- 16.Hansen D, Daughters G, II, Alderman E, et al. Torsional deformation of the left ventricular midwall in human hearts with intramyocardial markers: Regional heterogeneity and sensitivity to the inotropic effects of abrupt rate changes. Circ Res. 1988;62:941–52. doi: 10.1161/01.res.62.5.941. [DOI] [PubMed] [Google Scholar]
- 17.Ingels NB, Jr, Hansen DE, Daughters GT, II, et al. Relation between longitudinal, circumferential, and oblique shortening and torsional deformation in the left ventricle of the transplanted human heart. Circ Res. 1989;64:915–27. doi: 10.1161/01.res.64.5.915. [DOI] [PubMed] [Google Scholar]
- 18.Yun KL, Niczyporuk MA, Daughters GT, II, et al. Alterations in left ventricular diastolic twist mechanics during acute human cardiac allograft rejection. Circulation. 1991;83:962–73. doi: 10.1161/01.cir.83.3.962. [DOI] [PubMed] [Google Scholar]
- 19.Osakada G, Sasayama S, Kawai C, et al. The analysis of left ventricular wall thickness and shear by ultrasonic triangulation technique in the dog. Circ Res. 1980;47:173. doi: 10.1161/01.res.47.2.173. [DOI] [PubMed] [Google Scholar]
- 20.Canty JM, Giglia J, Kandath D. Effect of tachycardia on regional function and transmural myocardial perfusion during graded coronary pressure reduction in conscious dogs. Circulation. 1990;82:1815–25. doi: 10.1161/01.cir.82.5.1815. [DOI] [PubMed] [Google Scholar]
- 21.Stirling MC. Effects of ischemia on epicardial segment shortening. J Surg Res. 1991;50:30–9. doi: 10.1016/0022-4804(91)90006-8. [DOI] [PubMed] [Google Scholar]
- 22.Hartley CJ, Litowitz H, Rabinovitz RS, et al. An ultrasonic method for measuring tissue displacement: Technical details and validation for measuring myocardial thickening. IEEE Trans Biomed Eng. 1991;38:735–47. doi: 10.1109/10.83585. [DOI] [PubMed] [Google Scholar]
- 23.Lima JA, Jeremy R, Guier W, et al. Accurate systolic wall thickening by nuclear magnetic resonance imaging with tissue tagging: Correlation with sonomicrometers in normal and ischemic myocardium. J Am Coll Cardiol. 1993;21:1741–51. doi: 10.1016/0735-1097(93)90397-j. [DOI] [PubMed] [Google Scholar]
- 24.Horn BKP, Schunck BG. Determining optical flow. Artif Intell. 1981;17:185–203. [Google Scholar]
- 25.Mailloux GE, Bleau A, Bertrand M, et al. Computer analysis of heart motion from two-dimensional echocardiograms. IEEE Trans Biomed Eng. 1987;34:356–64. doi: 10.1109/tbme.1987.325967. [DOI] [PubMed] [Google Scholar]
- 26.Mailloux GE, Langlois F, Simard P, et al. Restoration of the velocity field of the heart from two-dimensional echocardiograms. IEEE Trans Biomed Eng. 1989;8:143–53. doi: 10.1109/42.24862. [DOI] [PubMed] [Google Scholar]
- 27.Pelc LR, Sayre J, Yun K, et al. Evaluation of myocardial motion tracking with cine-phase contrast magnetic resonance imaging. Invest Radiol. 1994;29:1038–42. doi: 10.1097/00004424-199412000-00005. [DOI] [PubMed] [Google Scholar]
- 28.Zhu Y, Pelc NJ. A spatiotemporal model of cyclic kinematics and its application to analyzing nonrigid motion with MR velocity images. IEEE Trans Med Imaging. 1999;18:557–69. doi: 10.1109/42.790456. [DOI] [PubMed] [Google Scholar]
- 29.Drangova M, Zhu Y, Bowman B, et al. In vitro verification of myocardial motion tracking from phase-contrast velocity data. Magn Reson Imaging. 1998;16:863–70. doi: 10.1016/s0730-725x(98)00100-3. [DOI] [PubMed] [Google Scholar]
- 30.Zhu Y, Drangova M, Pelc NJ. Estimation of deformation gradient and strain from cine-PC velocity data. IEEE Trans Med Imaging. 1997;16:840–51. doi: 10.1109/42.650880. [DOI] [PubMed] [Google Scholar]
- 31.Zerhouni EA, Parish DM, Rogers WJ, et al. Human heart: Tagging with MR imaging—A method for noninvasive assessment of myocardial motion. Radiology. 1988;169:59–63. doi: 10.1148/radiology.169.1.3420283. [DOI] [PubMed] [Google Scholar]
- 32.Pipe JG, Boes JL, Chenevert TL. Method for measuring three-dimensional motion with tagged MR imaging. Radiology. 1991;181:591–5. doi: 10.1148/radiology.181.2.1924810. [DOI] [PubMed] [Google Scholar]
- 33.Young AA, Axel L, Dougherty L, et al. Validation of tagging with MR imaging to estimate material deformation. Radiology. 1993;188:101–8. doi: 10.1148/radiology.188.1.8511281. [DOI] [PubMed] [Google Scholar]
- 34.Moore CC, Reeder SB, McVeigh ER. Tagged MR imaging in a deforming phantom: Photographic validation. Radiology. 1994;190:765–9. doi: 10.1148/radiology.190.3.8115625. [DOI] [PMC free article] [PubMed] [Google Scholar]
- 35.Bolster BD, McVeigh ER, Zerhouni EA. Myocardial tagging in polar coordinates with striped tags. Radiology. 1990;177:769–72. doi: 10.1148/radiology.177.3.2243987. [DOI] [PMC free article] [PubMed] [Google Scholar]
- 36.Axel L, Dougherty L. MR imaging of motion with spatial modulation of magnetization. Radiology. 1989;171:841–9. doi: 10.1148/radiology.171.3.2717762. [DOI] [PubMed] [Google Scholar]
- 37.Axel L, Dougherty L. Heart wall motion: Improved method of spatial modulation of magnetization for MR imaging. Radiology. 1989;172:349–50. doi: 10.1148/radiology.172.2.2748813. [DOI] [PubMed] [Google Scholar]
- 38.Ljunggren S. A simple graphical representation of fourier-based imaging methods. J Magn Reson. 1983;54:338–43. [Google Scholar]
- 39.Twieg DB. The k-trajectory formulation of the NMR imaging process with applications in analysis and synthesis of imaging methods. Med Phys. 1983;10:610–21. doi: 10.1118/1.595331. [DOI] [PubMed] [Google Scholar]
- 40.Mosher TJ, Smith MB. A DANTE tagging sequence for the evaluation of translational sample motion. Magn Reson Med. 1990;15:334–9. doi: 10.1002/mrm.1910150215. [DOI] [PubMed] [Google Scholar]
- 41.McVeigh ER, Atalar E. Cardiac tagging with breath hold CINE MRI. Magn Reson Med. 1992;28:318–27. doi: 10.1002/mrm.1910280214. [DOI] [PMC free article] [PubMed] [Google Scholar]
- 42.McVeigh ER. MRI of myocardial function: Motion tracking techniques. Magn Reson Imag. 1996;14:137–50. doi: 10.1016/0730-725x(95)02009-i. [DOI] [PubMed] [Google Scholar]
- 43.Croisille P, Guttman MA, Atalar E, et al. Precision of myocardial contour estimation from tagged MR images with a “black-blood” technique. Acad Radiol. 1998;5:93–100. doi: 10.1016/s1076-6332(98)80128-1. [DOI] [PMC free article] [PubMed] [Google Scholar]
- 44.Guttman MA, Zerhouni EA, McVeigh ER. Analysis and visualization of cardiac function from MR images. IEEE Comp Graph Appl. 1997;17:30–8. doi: 10.1109/38.576854. [DOI] [PMC free article] [PubMed] [Google Scholar]
- 45.Bundy JM, Lorenz CH. TAGASIST: A post-processing and analysis tools package for tagged magnetic resonance imaging. Comput Med Imaging Graph. 1997;21:225–32. doi: 10.1016/s0895-6111(97)00019-0. [DOI] [PubMed] [Google Scholar]
- 46.Azhari H, Sideman S, Weiss JL, et al. Three-dimensional mapping of acute ischemic regions using MRI: Wall thickening versus motion analysis. Am J Physiol. 1990;259(5 pt 2):H1492–503. doi: 10.1152/ajpheart.1990.259.5.H1492. [DOI] [PubMed] [Google Scholar]
- 47.Moore CC, O’Dell WG, McVeigh ER, et al. Calculation of three-dimensional left ventricular strains from biplanar tagged MR images. J Magn Reson Imaging. 1992;2:156–75. doi: 10.1002/jmri.1880020209. [DOI] [PMC free article] [PubMed] [Google Scholar]
- 48.Young AA, Axel L. Three-dimensional motion and deformation of the heart wall: Estimation with spatial modulation of magnetization—A model-based approach. Radiology. 1992;185:241–7. doi: 10.1148/radiology.185.1.1523316. [DOI] [PubMed] [Google Scholar]
- 49.O’Dell WG, Moore CC, Hunter WC, et al. Three-dimensional myocardial deformations: Calculation with displacement field fitting to tagged MR images. Radiology. 1995;195:829–35. doi: 10.1148/radiology.195.3.7754016. [DOI] [PMC free article] [PubMed] [Google Scholar]
- 50.Young AA, Imai H, Chang CN, et al. Two-dimensional left ventricular deformation during systole using magnetic resonance imaging with spatial modulation of magnetization. Circulation. 1994;89:740–52. doi: 10.1161/01.cir.89.2.740. [DOI] [PubMed] [Google Scholar]
- 51.Denney TS, McVeigh ER. Model-free reconstruction of three-dimensional myocardial strain from planar tagged MR images. J Magn Reson Imaging. 1997;7:799–810. doi: 10.1002/jmri.1880070506. [DOI] [PMC free article] [PubMed] [Google Scholar]
- 52.Prince JL, Gupta SN, Osman NF. Bandpass optical flow for tagged MRI. Med Phys. 2000;27:108–18. doi: 10.1118/1.598862. [DOI] [PubMed] [Google Scholar]
- 53.Osman NF, Kerwin WS, McVeigh ER, et al. Cardiac motion tracking using CINE harmonic phase (HARP) magnetic resonance imaging. Magn Reson Med. 1999;42:1048–60. doi: 10.1002/(sici)1522-2594(199912)42:6<1048::aid-mrm9>3.0.co;2-m. [DOI] [PMC free article] [PubMed] [Google Scholar]
- 54.Garot J, Bluemke DA, Osman NF, et al. Fast determination of regional myocardial strain fields from tagged cardiac images using harmonic phase MRI. Circulation. 2000;101:981–8. doi: 10.1161/01.cir.101.9.981. [DOI] [PubMed] [Google Scholar]
- 55.Osman NF, McVeigh ER, Prince JL. Imaging heart motion using harmonic phase MRI. IEEE Trans Med Imaging. 2000;19:186–202. doi: 10.1109/42.845177. [DOI] [PubMed] [Google Scholar]
- 56.Moore CC, Lugo-Olivieri CH, McVeigh ER, et al. Three-dimensional systolic strain patterns in the normal human left ventricle: Characterization with tagged MR imaging. Radiology. 2000;214:453–66. doi: 10.1148/radiology.214.2.r00fe17453. [DOI] [PMC free article] [PubMed] [Google Scholar]
- 57.Shapiro EP, Buchalter MB, Rogers WJ, et al. LV twist is greater with inotropic stimulation and less with regional ischemia. Circulation. 1988;78(suppl II):466. [Google Scholar]
- 58.Buchalter MB, Weiss JL, Rogers WJ, et al. Noninvasive quantification of left ventricular rotational deformation in normal humans using magnetic resonance imaging myocardial tagging. Circulation. 1990;81:1236–44. doi: 10.1161/01.cir.81.4.1236. [DOI] [PubMed] [Google Scholar]
- 59.Hansen DE, Daughters GT, II, Alderman EL, et al. Effect of acute human cardiac allograft rejection on left ventricular systolic torsion and diastolic recoil measured by intramyocardial markers. Circulation. 1987;76:998–1008. doi: 10.1161/01.cir.76.5.998. [DOI] [PubMed] [Google Scholar]
- 60.Azhari H, Buchalter M, Sideman S, et al. A conical model to describe the nonuniformity of left ventricular twisting motion. Ann Biomedl Eng. 1992;20:149–65. doi: 10.1007/BF02368517. [DOI] [PubMed] [Google Scholar]
- 61.Moore CC, McVeigh ER, Zerhouni EA. Non-invasive measurement of three dimensional myocardial deformation with MRI tagging during graded local ischemia. J Cardiovasc Magn Reson. 1999;1:207–22. doi: 10.3109/10976649909088333. [DOI] [PMC free article] [PubMed] [Google Scholar]
- 62.Lessick J, Fisher Y, Beyar R, et al. Regional three-dimensional geometry of the normal human left ventricle using cine computed tomography. Ann Biomed Eng. 1996;24:583–94. doi: 10.1007/BF02684227. [DOI] [PubMed] [Google Scholar]
- 63.vanRugge FP, Holman ER, van der Wall EE, et al. Quantification of global and regional left ventricular function by cine magnetic resonance imaging during dobutamine stress in normal human subjects. Eur Heart J. 1993;14:456–63. doi: 10.1093/eurheartj/14.4.456. [DOI] [PubMed] [Google Scholar]
- 64.MacGowan GA, Shapiro EP, Azhari H, et al. Noninvasive measurement of shortening in the fiber and cross-fiber directions in the normal human left ventricle in idiopathic dilated cardiomyopathy. Circulation. 1997;96:535–41. doi: 10.1161/01.cir.96.2.535. [DOI] [PubMed] [Google Scholar]
- 65.Kramer CM, Reichek N, Ferrari VA, et al. Regional heterogeneity of function in hypertrophic cardiomyopathy. Circulation. 1994;90:186–94. doi: 10.1161/01.cir.90.1.186. [DOI] [PubMed] [Google Scholar]
- 66.Palmon LC, Reichek N, Yeon SB, et al. Intramural myocardial shortening in hypertensive left ventricular hypertrophy with normal pump function. Circulation. 1994;89:122–31. doi: 10.1161/01.cir.89.1.122. [DOI] [PubMed] [Google Scholar]
- 67.Clark NR, Reichek N, Bergey P, et al. Circumferential myocardial shortening in the normal human heart: Assessment by magnetic resonance imaging using spatial modulation of magnetization. Circulation. 1991;84:67–74. doi: 10.1161/01.cir.84.1.67. [DOI] [PubMed] [Google Scholar]
- 68.Streeter DD. Gross morphology and fiber geometry of the heart. In: Berne RM, editor. Handbook of physiology. Section 2, the cardiovascular system. Vol. 1. American Physiological Society; Washington, DC: 1979. pp. 61–112. [Google Scholar]
- 69.Nielsen PMF, LeGrice IJ, Smaill BH, et al. Mathematical model of geometry and fibrous structure of the heart. Am J Physiol. 1991;29:H1365–78. doi: 10.1152/ajpheart.1991.260.4.H1365. [DOI] [PubMed] [Google Scholar]


