Abstract
Intracardiovascular blood pressure differences can be derived from velocity images acquired with phase-contrast (PC) MRI by evaluating the Navier-Stokes equations. Pressure differences within a slice of interest can be calculated using only the in-plane velocity components from that slice. This rapid exam is proposed as an alternative to the lengthy 3D velocity imaging exams. Despite their good spatial coverage, the 3D exams are prone to artifacts and errors from respiratory motion and insufficient temporal resolution, and are unattractive in the clinical setting due to their excessive scan times (>10 min of free breathing). The proposed single-slice approach requires only one or two breath-holds of acquisition time, and the velocity data can be processed for the calculation of pressure differences online with immediate feedback. The impact of reducing the pressure difference calculation to two dimensions is quantified by comparison with 3D data sets for the case of blood flow within the cardiac chambers. The calculated pressure differences are validated using high-fidelity pressure transducers both in a pulsatile flow phantom and in vivo in a dog model. There was excellent agreement between the transducer and PC-MRI results in all of the studies. Published 2003 Wiley-Liss, Inc.†
Keywords: blood pressure measurement, MRI, phase contrast imaging, hemodynamics, systolic function, diastolic function
Estimation of blood pressure differences (ΔP) within the cardiovascular system is an essential element of the clinical evaluation of cardiovascular disease. For example, the drop in pressure across a stenotic valve provides a direct measure of the severity of the restriction, and is a decisive factor in surgical planning (1). More subtle changes in intracardiac pressure differences reflect ventricular relaxation and compliance, and atrial filling pressures (2,3). While catheterization with high-fidelity pressure transducers remains the gold standard for pressure measurement in the heart, noninvasive prediction of ΔP is of considerable value as a means to reduce both the cost and risk associated with invasive measurements. Noninvasive imaging also offers the ability to accurately resolve the locations of the pressure measurement with respect to the relevant anatomy. Finally, noninvasive approaches eliminate pressure measurement artifacts due to the presence of catheters in regions of restricted blood flow.
It is well known that pressure gradients within a Newtonian fluid can be calculated from velocity field data using the Navier-Stokes (NS) equations or various simplified forms of these equations, such as Euler's and Bernoulli's equations (4). While Doppler ultrasound velocity imaging is the present standard for noninvasive pressure estimation, ultrasound methods suffer from limited anatomic access windows and are sensitive to motion in a single direction, parallel to the beam path. These limitations give rise to potential errors in the estimated pressure differences due to insufficient sampling of the blood velocity field (5-8). Phase contrast (PC) MRI, on the other hand, can measure 3D velocity vectors in three spatial dimensions with unrestricted image orientation. It has previously been shown that blood velocities measured noninvasively with PC-MRI can be used to estimate pressure gradients in vivo (9-14). Despite the appeal of imaging 3D velocity vectors in three spatial dimensions, a number of factors make this approach impractical in the clinical setting. First, long imaging times make 3D acquisitions prone to artifacts from respiratory motion. Respiratory gating can be used to reduce the influence of breathing, although at the expense of a further increase in experiment length. Excessive PC experiment lengths will limit the time available for complementary imaging protocols, to study morphology and function (myocardial perfusion, dynamics, and viability) due to restrictions in the total length of the MRI session. Second, substantial postprocessing is required to evaluate ΔP from the 3D velocity fields. In particular, image regions containing blood must be segmented from tissue, for all slices and cardiac phases of interest, because the NS equations are valid only in liquid media. Segmentation is also required for pressure difference calculation algorithms that utilize boundary conditions within the blood pool (9,11,13). Ideally, analysis of the velocity image data would require no user input to both eliminate user variability and significantly reduce processing time.
In this study the applicability of reduced data acquisitions with PC-MRI for fast noninvasive estimation of pressure differences is examined. In particular, we propose a flexible reduced-acquisition approach that limits the region of interrogation to a single slice with the collection of in-plane velocities. In addition to fast acquisition times, it will be shown that pressure differences calculated with a single-slice exam can be processed with minimal user input and short processing times to allow fast online display. In a previous study, velocity data from a single slice were used to calculate in-plane pressure gradients (13); however, that technique was limited in application to within the aorta, and the potential impact of the loss of through-plane motion, while acknowledged, was not examined. To assess the single-plane strategy, multislice three-velocity-direction PC data were acquired from several normal volunteers to determine the contributions from both the in-plane and through-plane velocities and velocity gradients to the total in-plane pressure differences. In this work the relative contributions from the local acceleration and convective acceleration terms to the total pressure differences are assessed. In addition, the impact of temporal resolution is considered and minimum requirements are identified. PC-MRI-derived pressure differences are validated using high-fidelity pressure catheters (Millar, Houston, TX) both in a pulsatile flow phantom and in vivo, in a canine model. With a single-slice examination, the length of the total experiment for pressure difference measurements is reduced to one or two breath-holds, and the pressure difference calculation can be made with minor user interaction and without the need for image segmentation.
THEORY
The motion of a nonturbulent Newtonian fluid is governed by the Navier-Stokes equations, a 3D set of nonlinear equations that express the conservation of momentum of the fluid. The Cartesian form of the NS equations is
| [1] |
The xi's are the x-, y-, and z-axes in the image frame and the vi's are the corresponding velocities, μ is the coefficient of viscosity (μblood = 4 cP), and ρ is the fluid density (ρblood = 1060 kg/m3). From left to right in Eq. [1], the NS equations relate the pressure gradients to the local and convective accelerations as well as to the viscosity or frictional effects, and finally to the global body force terms, the Fi's. It is common to omit the viscous terms for regions outside of the thin boundary layer that exists at the blood–tissue interface (4). The extent of the boundary layer within the cardiac chambers cannot be determined analytically, although the layer thickness has been calculated to be within 1 mm of the vessel wall for blood flow in the aorta (13). All of the in vivo experiments in this study indicate that the viscous friction terms are negligible for normal blood flow within the cardiac chambers, by direct evaluation of the viscosity term in Eq. [1], and are not reported. The body force term, which includes gravity for this application, are also neglected in this study.
For the calculation of pressure gradients within a single (x,y) plane, neglecting the friction and body force terms, the NS equations can be expressed in terms of the two orthogonal in-plane contributions, shown in Eqs. [2a] and [2b]. Each in-plane pressure gradient has contributions from a single local acceleration component and three separate convective components that will be referred to as the x-, y-, and z-convective terms, respectively.
| [2a] |
| [2b] |
The z-convective or through-plane terms, indicated by boxes in Eqs. [2a] and [2b], are the contributions to the in-plane pressure gradients that arise from the through-plane velocity gradients, the ∂v/∂z. These terms are distinct in that they are the only contributions to Eqs. [2a] and [2b] that cannot be calculated exclusively from in-plane velocity data, and are of specific interest because of the disproportionate amount of imaging time required for their calculation. In particular, the computation of through-plane velocity derivatives requires the acquisition of either multislice or 3D velocity data. The relative importance of each of the component terms identified in Eqs. [2a] and [2b] will be considered for the case of blood flow within the cardiac chambers.
MATERIALS AND METHODS
All MR measurements were performed on a 1.5 T GE CV/i MRI scanner (GE Medical Systems, Waukesha, WI) with high-performance gradients (40 mT/m amplitude, 150 T/m/s slew rate) and a four-element phased array receiver coil. A fast-gradient-recalled-echo PC sequence was used for all velocity imaging exams. For the human experiments, the typical scan parameters were as follows: slice thickness = 8 mm slice, FOV = 36 × 27 cm, matrix = 192 × 96 matrix, receiver bandwidth = ±62.5 kHz, and flip angle = 15°. With these acquisition parameters the repetition time (TR) was 5.5 ms and echo time (TE) was 2.8 ms. Multislice experiments were performed for all volunteers (N = 5) with the collection of each velocity direction, for each slice, in a separate breath-hold using the conventional single-direction flow-encoding scheme (15). Three to five slices were acquired for each volunteer, with no gap between neighboring slices. The in-plane velocities (vx,vy) from the center slice were used for the reduced acquisition (single-slice) pressure-difference calculations within this slice. The multislice data were used for the calculation of the z-convective terms, the boxed terms in Eqs. [2a] and [2b], for this center slice. A similar protocol was used for the canine and phantom experiments with = slice thickness = 5 mm, FOV = 20 × 15 cm, and matrix = 192 × 120. Velocity-encoding strengths (Venc) ranging from 80 to 160 cm/s were used for all phantom, canine, and human experiments. For the animal studies, respiratory gating was used to eliminate the need for breath-holding.
A prospectively ECG-gated, retrospectively sorted acquisition/reconstruction method, similar to cardiac phase to order reconstruction (CAPTOR) (16), was used for all PC experiments. A view-sharing method, similar to the block regional interpolation scheme for k-space (BRISK) (17), was used to increase the temporal resolution around the center of k-space for a given breath-hold length. For all human experiments, the center 16 lines of k-space were acquired with two views per segment (VPS). The next outer 32 lines of k-space (16 on each side of the center) were sampled with VPS = 4, and the final outer 48 lines (24 on each side of the center) were sampled with VPS = 6. For this sampling strategy, the center of k-space is sampled every 2*VPS*TR = 22 ms, and the total breath-hold length is 24 heartbeats. The factor of 2 is due to the interleaving of the differentially flow-encoded acquisitions. A similar scheme, with VPS = 1, 2, and 3 for the inner, middle, and outer sections of k-space, respectively, was used for the canine experiments, which resulted in a sampling interval of 12 ms for the center 20 lines of k-space. In order to study the impact of temporal resolution on calculated pressure differences, reduced temporal resolution data sets were extracted from higher temporal resolution experiments.
All phase differences were calculated as the angle of the complex conjugate multiplication of the two differentially flow-encoded experiments (18). The residual phase in the PC images arising from eddy currents, and Maxwell terms were automatically calculated, with no user input, using in-house software. The spatial and temporal derivatives for the evaluation of all terms in the NS equations were calculated using a second-order central difference approximation (19).
Integration of the Pressure Gradient Fields
For all experiments, the pressure differences (ΔP) were calculated by directly integrating the in-plane pressure gradients over space:
| [3] |
The constant of integration from Eq. [3] is equal to the absolute pressure, which cannot be derived from the calculated pressure gradients. To evaluate Eq. [3] for a given path of integration, the selected path is broken up into linear segments, each of which has a vector length defined by dx → Δxi and dy → Δyi. The calculated pressure gradient fields, the ∂P/∂x and ∂P/∂y, are resampled to the center of each linear segment, and the total pressure drop, across all the segments, is calculated as a sum using
| [4] |
For all examples in this study, the path of integration used to evaluate ΔP with Eq. [4] was selected interactively by the user with a mouse and a simple graphic-user interface on which arbitrary lines could be drawn on PC and magnitude images. Issues of path dependency have been addressed previously (9,11,13) with solution methods that incorporated an iterative refinement of the pressure difference field using the global pressure gradient fields. An example of such an iterative solution method, previously described by Tyszka et al. (11), is shown in Eq. [5]. In this study we examine the sensitivity of the calculated pressure differences to the selected integration paths by comparing intracardiac pressure differences calculated with the direct integration method from Eq. [4] with the iterative approach given in Eq. [5]:
| [5] |
In Eq. [5], ΔPn is the pressure difference field at the Nth iteration, and i is the index for each of the six voxels that directly neighbor the current voxel. (∂P/∂r)i is the pressure gradient at the ith neighboring voxel, and Δri is the vector displacement from the current voxel to the ith neighboring voxel. For all calculations α was set to 0.5. The iterative procedure was repeated until the integrated pressure difference between consecutive steps was < 0.1% of the total integrated pressure. The starting values for ΔP, for N = 1, were calculated using Eq. [4], wherein all pressures in the field are relative to a single reference voxel. Note that the iterative methods require that a single contiguous area or volume be segmented, for all cardiac phases of interest, to limit the calculation to within the blood pool.
The total time required for computations and interactive user operations for the calculation of pressure differences was ∼30 s using the direct integration approach from Eq. [4]. The iterative solution method from Eq. [5] required at least 30 min of user time to segment the blood pool for each slice and each image frame, and to calculate the pressure field for each slice and iterate to the final solution.
Flow Phantom
A flexible tube flow phantom, which was capable of generating pulsatile flow patterns (20), was used to validate the pressure difference calculations. The tube assembly was formed into a return loop in a coronal plane to limit the flow to within a single plane for a coronal slice orientation. Two MR-compatible 6-F catheters with high-fidelity pressure transducers (Millar Instruments, Houston, TX) were inserted into the flow phantom with 5-cm tip separation. The output of the probes was sampled at 1000 Hz with the use of a personal computer. The same cyclic flow patterns and transducer locations were maintained for PCMRI experiments and transducer recording. The synthetic EKG signal used to gate the voltage-controlled pinch valve and the PC-MRI data acquisition was also recorded to synchronize the MR and pressure transducer data. For the phantom experiments, a single view per segment was acquired to reduce the sampling interval to 2*TR = 11.4 ms, which resulted in an experiment length of 192 trigger cycles per velocity direction.
In Vivo: Canine
Parallel PC velocity imaging and in vivo pressure measurements, using high-fidelity pressure transducers (Millar, SSD-911, 5F), were performed on six dogs (beagles, 7–12 kg). The animals were anesthetized and placed on a ventilator (∼1.5% isofluorane) for the duration of the experimental protocols. The animals were paced at rates of 100–150 BPM with a right atrial (RA) electrode, inserted through the jugular vein, and ventilated at a rate of 10 breaths/min. Carotid and venous lines were used to monitor arterial pressure and administer fluids, respectively. The minute ventilation (∼1.8 L/min) was varied such that blood CO2 and pH were within 30–40 mmHg and 7.34–7.43, respectively, while respirating at 10 breaths/min with a 25% inspiratory duration. For three animals, a dual head pressure transducer was inserted into the left ventricle (LV) via the left carotid artery, and the location was verified with MRI (Fig. 1a). The locations of the proximal and distal transducers were well visualized on the magnitude images because of the magnetic susceptibility-induced signal voids caused by the pressure transducers. Experiments were repeated in the descending aorta (Fig. 1b) in three additional animals, with catheter access from the femoral artery. The transducer location was assumed to be at the center of the signal void for all cases. Pressures from the two transducers and the timing of cardiac stimulation from the pacing electrode were recorded on a laboratory PC. The timing of the pacing signal was needed to synchronize the pressure difference curves measured with the catheters and calculated with PC-MRI velocity data. Prior to imaging, the Millar catheter was pulled out of the imaging region to remove the magnetic susceptibility source. Multislice PC-MRI was preformed on the same slice used to localize the catheter tips, along with several parallel slices. Pressure transducers were calibrated for each experiment using a water column system.
FIG. 1.
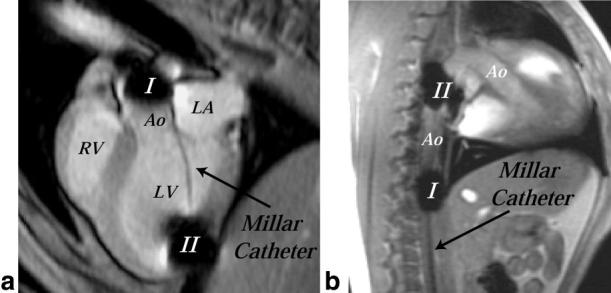
a: MR image of a canine heart (three-chamber view) showing placement of dual head Millar catheter across the aortic valve for in vivo measurement of pressures. Signal voids exist at the locations of the transducers, which are separated by 6 cm. b: MR image of a canine heart and aorta (sagittal slice) showing placement of dual head Millar catheter in the descending aorta for in vivo measurement of pressures.
In Vivo: Human
Multislice cine PC imaging was performed on five normal volunteers (26–42 years old) who had no contraindications for MRI. All of the subjects provided informed consent. The three velocity components were collected for each slice. Sagittal and long- and short-axis breath-hold EKG-triggered multislice localizers were used to prescribe various two- and three-chamber long-axis views for the PC scans. Three-chamber views, used to visualize both the inflow and outflow tracts, were prescribed from basal short-axis images at the level of the mitral valve plane.
RESULTS
Flow Phantom
Figure 2 displays the difference of the pressures measured with the Millar catheters in the flow phantom as a function of the flow cycle. The pressure differences calculated with Eqs. [2a], [2b], and [4] using PC velocity data are also displayed in Fig. 2. The experimental results show excellent agreement with the measured pressure transducer results, with a small deviation of 0.5 mmHg at 300 ms, and a similar deviation at 550 ms. These differences may have been caused by movement of the transducer tips over the course of the flow cycle due to the changing flow rate, or by contact with the tube wall. The z-convective terms were found to be negligible for all phantom studies, due to insignificant through-plane velocities (< 2 cm/s).
FIG. 2.
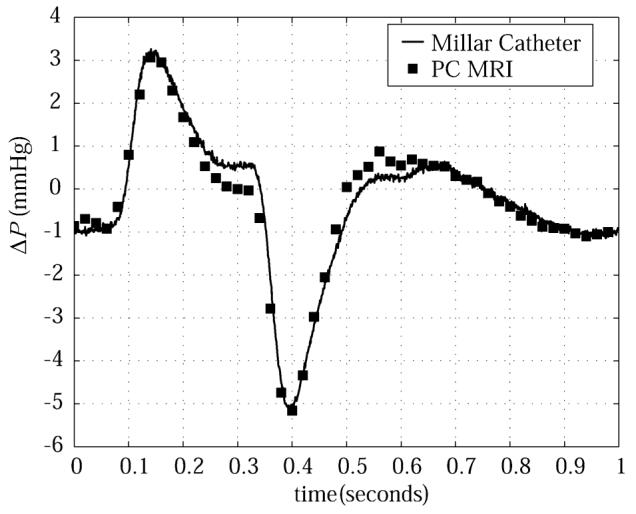
Comparison of pressure differences in a pulsatile flow phantom measured with Millar catheters (solid line) and calculated with PC-MRI velocity data (squares).
In Vivo: Canine
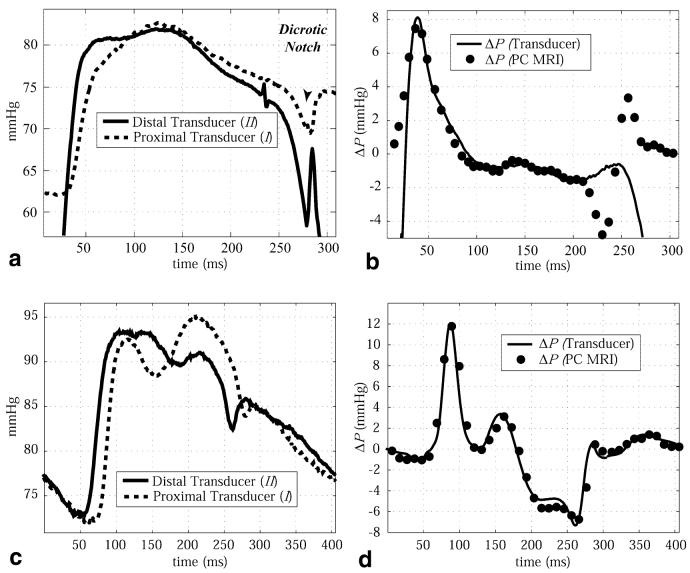
Figure 3a displays sample absolute pressures from an animal experiment (I: proximal transducer; II: distal transducer) recorded during systole, for a single cardiac cycle, with the dual head Millar pressure transducer. Transducer locations for the pressures displayed in Fig. 3 are shown in Fig. 1. The solid line in Fig. 3b displays the average △P curve over 60 heartbeats. Averaging the pressure difference waveform over many cycles had very little impact on the △P curve due to the stability of the cardiac function under the pacing protocol, with a maximum variability of ∼0.5 mmHg for any given cardiac phase over the 60 heartbeats. The calculated △P's, using the measured PC-MRI velocity data and Eqs. [2a], [2b], and [4], are also displayed in Fig. 3b, which shows good agreement between the methods. The velocity data were linearly interpolated to 75 frames over the 500-ms cardiac cycle, which resulted in a displayed temporal resolution of 6.67 ms for the △P data. Note that the NS equations are valid across the aortic valve only when the valve is open, which corresponds to ∼25 ms to ∼ 235 ms in Fig. 3a and b. Valve opening and closure were measured with velocity and magnitude imaging.
FIG. 3.
a: Absolute blood pressures measured in the ascending aorta and LV cavity in a canine subject using the dual head Millar pressure catheter. Pressure transducer locations are shown in Fig. 1a. Note that only 300 ms of the total 500-ms cardiac cycle is shown. b: The transvalvular pressure differences between the transducer tips, measured with the Millar catheters (solid line), are compared with the pressure differences calculated with PC-MRI velocity data (circles). c: Absolute blood pressures measured at two locations in the descending aorta of a canine subject using the dual head Millar pressure catheter. Pressure transducer locations are shown in Fig. 1b. d: The pressure differences between the transducer tips, measured with the Millar catheters (solid line), are compared with the pressure differences calculated with PC-MRI velocity data (circles).
The validation experiment was repeated in the descending aorta of three animals. Figure 3c shows a sample of the absolute pressures recorded at the distal and proximal transducer locations throughout the cardiac cycle. The pressure difference curve, averaged over 60 cardiac cycles, is shown in Fig. 3d. The pressure differences calculated with PC-MRI velocity data, displayed as the black circles in Fig. 3d, are in excellent agreement with the measured catheter values. Comparison of the two methods is valid across the entire cardiac cycle because there is no valve between the transducers, as was the case for the previous example. For both validation locations, in the outflow tract and the descending aorta, the z-convective terms were small contributors to the total pressure differences. They reached a maximum of 10% for the aortic valve case, and <5% for the descending aorta case in all animals studied.
In Vivo: Human
For the human studies, the in vivo △P's calculated from PC-MRI velocity data are displayed as pressure differences between sample locations over time, and as pressure-difference maps at key times in the cardiac cycle. A standard three-chamber-view image orientation was used for all normal volunteer exams to allow both the inflow and outflow tracts to be captured in a single slice. Figures 4 and 5 display calculated pressure drops between several sample locations in the LA, LV, and outflow tract for filling and ejection cardiac phases in a single representative normal volunteer. For all cases, the paths of integration are shown on PC velocity images, and the total pressure drop and the contributions from the local and convective terms are displayed.
FIG. 4.
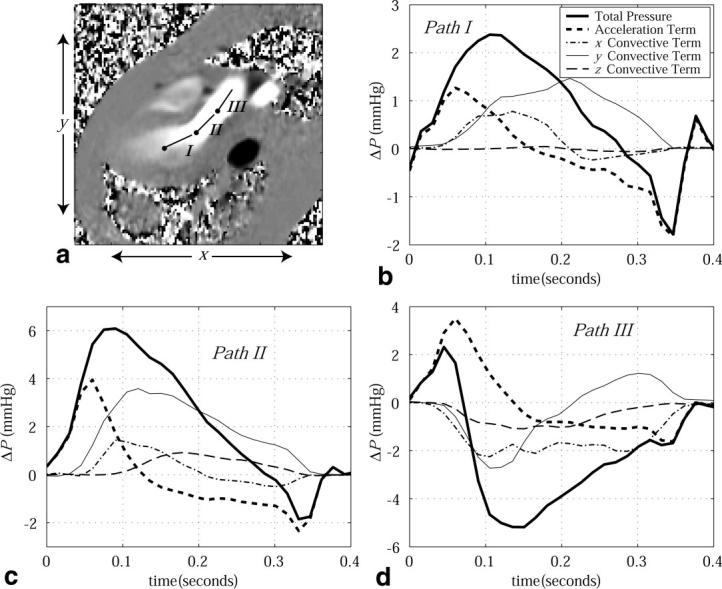
a: A PC image displays the x-directed velocity component during ejection (outflow tract) at ∼150 ms following the QRS trigger. Pressure drops across three paths (labeled I, II, and III) are displayed as a function of time throughout systole in b–d. For all cases, the component pressure drops from the local acceleration and three orthogonal convective terms are displayed, along with the total pressure drop. The pressure reference location for each path is indicated by a node.
FIG. 5.
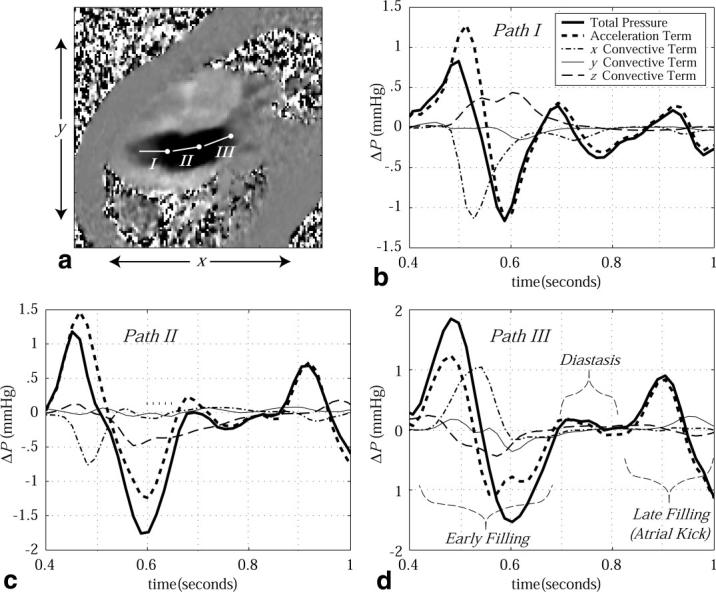
a: A PC image displays the x-directed velocity component during LV filling (inflow tract) at ∼500 ms following the QRS trigger. Pressure drops across three paths (labeled I, II, and III) are displayed as a function of time throughout diastole in b–d. For all cases, the component pressure drops from the local acceleration and three orthogonal convective terms are displayed, along with the total pressure drop. Three stages of diastole (early filling, diastasis and late filling) are labeled. The pressure reference location for each path is indicated by a node.
Figure 4a displays the paths of integration for each of three 2.5-cm sample lines in the LV outflow path used to examine pressure differences during systole. The corresponding pressure differences are shown in Fig. 4b-d. Similar pressure-difference patterns have previously been observed in healthy subjects using velocities measured with Doppler methods (21). The peak ejection △P along a 2.5-cm path in the outflow tract (path II in Fig. 4a) was found to be 4.90 ± 1.10 mmHg for the five normal subjects studied. The peak contribution from the z-convective term over the same path was ≤1 mmHg, and was always <0.2 mmHg at the time of the peak △P in all volunteers. The peak contribution from the z-convective term was typically delayed 100 ms as compared to the total peak △P. Figure 5 displays diastolic pressure differences across the inflow tract of the same normal volunteer, using the same imaging slice, again over 2.5-cm linear paths. Both PC-MRI (9) and Doppler methods (21,22) have previously been used to measure comparable LV filling pressure differences. The peak filling △P along a 2.5-cm path across the mitral valve (path II in Fig. 5a) was found to be 1.55 ± 0.25 mmHg for the five normal subjects studied. The contribution from the z-convective term during filling typically lasted 150–200 ms with a peak value ≤ 0.5 mmHg, with a consistent delay of 100–150 ms from the onset of filling. The onset of these through-plane terms is consistent with the formation of flow vortices, which follows the time of peak filling (20).
In order to estimate the magnitude of the random error in the calculated △P, we measured the standard deviation (SD) of pressure differences over time, for a 2.5-cm path in stationary chest wall tissue for all volunteers. The location was selected to have a signal-to-noise ratio (SNR) comparable to that in the chamber blood pool. The SD in △P in the five volunteers ranged from 0.03 to 0.08 mmHg, and was thus too small to be displayed with △P curves.
To assess the sensitivity of the calculated pressure differences to the selected paths, as in Figs. 4a and 5a, we compared pressure differences calculated with the direct integration approach from Eq. [4] to values calculated with the iterative method defined by Eq. [5]. The pressure-difference fields evaluated with Eq. [5] were also used to display the relative contribution of the z-convective terms to the total pressure drops over space at a given time. Again, a standard three-chamber-view image orientation was used to allow inflow and outflow paths to be considered in a single slice. Figure 6a and d displays the calculated pressure-difference images for cardiac phases at 75 ms and 210 ms, respectively, following the ECG trigger. These two phases were examined to highlight the changes in the pressure-difference field over time. To generate these △P images, Eq. [5] was applied within a region containing only blood, which was segmented for each slice and each image frame. Figure 6b and e displays the pressure-difference maps from Fig. 6a and d, with signal wrap every 1.0 mmHg to provide a sense of the local pressure gradients. The segmented regions are overlaid on the corresponding magnitude images. The pressure maps in Fig. 6c and f show the contribution to the total ΔP maps in Fig. 6b and e that arise from the through-plane components of motion (i.e., the boxed terms in Eqs. [2a] and [2b]). Comparable ΔP maps for diastolic cardiac phases are shown in Fig. 7, at 500 ms and 650 ms following the QRS trigger, with signal wrap every 0.5 mmHg. These phases correspond to early and late peak filling or phases of high acceleration and high deceleration, respectively.
FIG. 6.
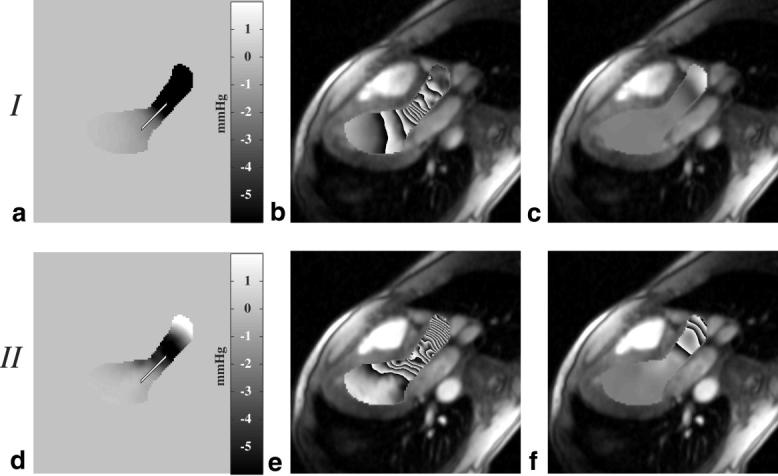
Pressure difference maps calculated with Eq. [5] are displayed during ejection at (a) 75 ms after the QRS trigger and (d) 210 ms after the QRS trigger. The pressure difference fields from a and d are displayed using a phase representation in b and e, where each cycle from black to white and back to black corresponds to a change in pressure of 1 mmHg. The contributions to the total pressure field from the z-convective term for these two sample frames are displayed in c and f.
FIG. 7.
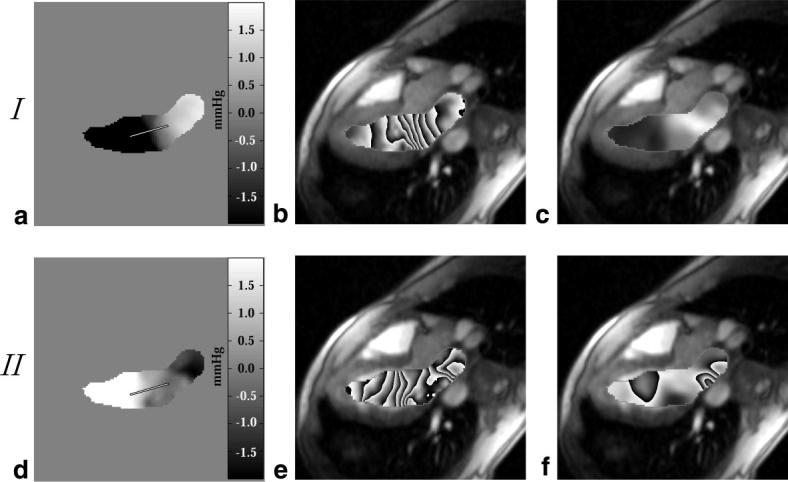
Pressure difference maps calculated with Eq. [5] are displayed during LV filling at (a) 500 ms after the QRS trigger and (d) 650 ms after the QRS trigger. The pressure difference fields from a and d are displayed using a phase representation in b and e, where each cycle from black to white and back to black corresponds to a change in pressure of 0.5 mmHg. The contributions to the total pressure field from the z-convective term for these two sample frames are displayed in c and f.
Pressure differences calculated with the two methods (the direct integration method of Eq. [4] and the global iterative method of Eq. [5]) are directly compared in Fig. 8. The pressure differences plotted in Fig. 8a are between the endpoints of the line shown in Fig. 6a and d, across the aortic valve, during the ejection portion of the cardiac cycle. The calculated pressure differences are also compared for the filling phase of the cardiac cycle in Fig. 8b, using the paths shown in Fig. 7a and d. The direct integration and global iterative methods have an excellent correlation for all locations studied (r2 > 0.99). For all results shown in Fig. 8, only the in-plane velocities from the plane of interest were used in the ΔP calculations.
FIG. 8.
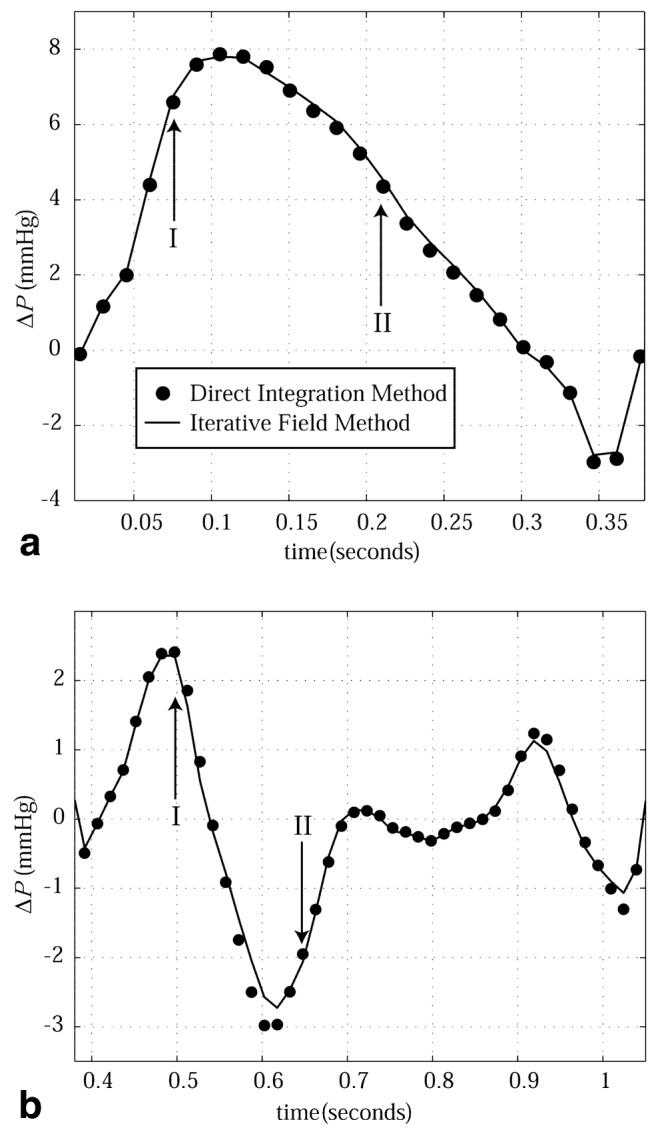
Intracardiac pressure differences calculated with the direct integration method (circles) and the iterative field method (solid line) are compared. The outflow tract pressure differences shown in a are between the endpoints of the path displayed in Fig. 6a and d. The filling pressure differences shown in b are between the endpoints of the path displayed in Fig. 7a and d.
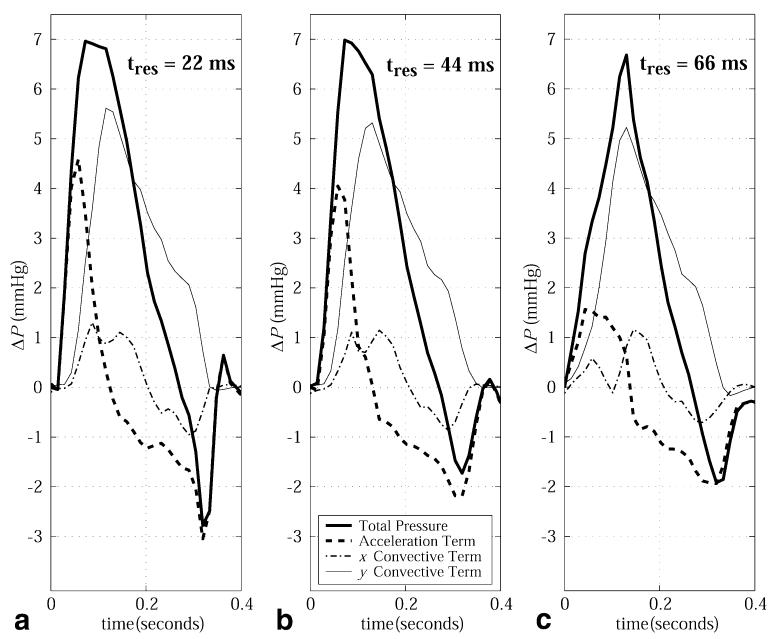
The impact of the temporal resolution of the velocity data on the calculated pressure differences is illustrated in Fig. 9 for the case of systolic flow across the aortic valve for temporal resolutions of 22 ms, 44 ms, and 66 ms. Increasing the sampling interval from 22 ms to 44 ms resulted in a 10% underestimation of the acceleration term in the outflow tract, which increased to 65% with an interval of 66 ms. To maintain consistency of the slice prescription between the cases, the highest-resolution data were re-sampled to generate the lower-resolution velocity images.
FIG. 9.
Outflow tract pressure differences, including the local and in-plane convective acceleration terms as well as the total pressure difference, are calculated with PC-MRI velocity data with three temporal resolutions: (a) 22 ms, (b) 44 ms, and (c) 66 ms.
DISCUSSION
We have demonstrated that accurate intracardiac pressure differences can be calculated noninvasively with PC-MRI velocity data from a single plane. Pressure gradients within a plane of interest are calculated from velocity data using the Navier-Stokes equations, which are simplified by neglecting the contributions from the through-plane or z-convective terms. The impetus to neglect the z-convective contribution to the total calculated pressure difference was a substantial reduction in total experiment length, with only two breath-holds required for the collection of the two in-plane velocity components (vx, vy). The experiment length can be further reduced to a single breath-hold at the cost of a 50% increase in the sampling interval (from 22 ms to 33 ms for all in vivo results presented in this study). Combining the two breath-holds into a single experiment has the advantage of eliminating errors resulting from breath-hold misalignment. The single-slice experiment also has the advantage of significantly smaller data sets and simplified image processing as compared to multidimensional approaches. In particular, it was shown that direct integration of the pressure gradient field data provides equivalent calculated pressure differences in comparison with global optimization methods that require image segmentation. High-fidelity Millar pressure transducers were used to validate the pressure differences calculated with PC-MRI velocity data for both phantom and animal experiments, with excellent agreement for all cases studied.
For blood flow during systole, it was shown that the z-convective terms contribute a relatively small pressure drop within the chamber and along the outflow tract for slice orientations parallel to the outflow tract (<1 mmHg over 2.5 cm). Spatial interrogation of the through-plane components of motion during systole showed that the pressure drops from these terms becomes significant only as the ascending aorta curves out of the imaging plane. This result was as expected, given the through-plane velocities and velocity gradients associated with blood flow in a vessel curving out of a plane. The diastolic pressure differences within the left heart are characterized predominantly by the local acceleration terms. The relatively smaller contribution from the convective terms during filling is due to the unobstructed path provided by a fully opened mitral valve, and the associated uniform distribution of velocities across the valve plane. The maximum contribution from the z-convective term was delayed compared to the local acceleration terms. This pattern of delayed through-plane pressure gradient formation is not unexpected, given the transition from plug flow during early filling to complex vorticle flow just after the time of peak filling (22-24). Diastasis, which follows the early filling phase, is characterized by vanishing pressure differences with the chambers, which is followed finally by the late filling phase (A-wave), the result of atrial contraction. For all volunteers studied, this late filling phase displayed pressure differences that were dominated by the local acceleration terms.
For the calculation of in vivo pressure differences in the clinical setting, single-plane experiments offer several advantages over multislice or 3D experiments. The single-plane experiments drastically reduce the postprocessing burden compared to 3D acquisitions, particularly if direct integration methods are used to process the pressure gradient fields (as opposed to iterative methods, which require image segmentation). No significant difference between direct integration and iterative field methods was found when the calculated pressure differences were compared. The short examination times reduce hemodynamic variability over the course of the experiment and allow breath-holding to be used. Breath-holding is desirable to eliminate respiration-induced artifacts from bulk motion and blood flow variability across the respiratory cycle (25,26). In addition, the single-slice examination allows higher temporal resolutions to be achieved due to the reduced demands on the total amount of information collected (as compared to 3D experiments). For normal blood flow patterns, it was found that a minimum temporal resolution of ∼44 ms is required to avoid significant underestimation of the local acceleration contribution to the total intracardiac pressure differences. In this study we improved temporal resolution by a factor of 2, without increasing breath-hold length, by the use of view sharing. Our results indicate that sampling the edges of k-space less frequently is an appropriate strategy for pressure-difference measurements with MRI. In particular, the convective terms do not contain high temporal frequency information, but require high spatial frequency information for their calculation, whereas the acceleration terms have high temporal frequency information, but do not vary rapidly over space. While the minimum sampling interval in this study was 22 ms, it has previously been shown that blood velocities and accelerations in the normal heart have components of motion that require sampling intervals of at least 10 ms for their resolution (20). However, pressure drops of pathologic significance are most commonly associated with flow restrictions, and will thus be dominated by the convective components as opposed to the local accelerations, and are thus less sensitive to temporal resolution. There are, of course, limitations to a single-slice technique as compared to 3D approaches. With a single-slice acquisition there is always the possibility that flow events will be underestimated due to incomplete spatial coverage. For example, aortic insufficiency can result in eccentric jets that will be misrepresented with a single-slice experiment that is not oriented along the jet direction. For this reason, it is important to obtain comprehensive scout images to allow for appropriate slice prescriptions. Alternatively, multiple slices can be acquired to provide additional coverage in significantly less time than a 3D exam. Future studies will examine the ability of the single-slice pressure-difference imaging method to assess clinically relevant phenomena, such as flow-limiting stenosis and altered LV filling in the presence of diastolic dysfunction.
ACKNOWLEDGMENTS
We thank J. Andrew Derbyshire and Daniel B. Ennis for expert technical development, and the Natural Sciences and Engineering Research Council of Canada for financial support (to R.B.T.).
Grant sponsor: Natural Sciences and Engineering Research Council of Canada.
Footnotes
This article is a US Government work and, as such, is in the public domain in the United States of America.
REFERENCES
- 1.Carabello BA, Crawford FA., Jr Valvular heart disease. N Engl J Med. 1997;337:32–41. doi: 10.1056/NEJM199707033370107. [DOI] [PubMed] [Google Scholar]
- 2.Smiseth OA, Steine K, Sandbaek G, Stugaard M, Gjolberg T. Mechanics of intraventricular filling: study of LV early diastolic pressure gradients and flow velocities. Am J Physiol. 1998;275:H1062–H1069. doi: 10.1152/ajpheart.1998.275.3.H1062. [DOI] [PubMed] [Google Scholar]
- 3.Ohno M, Cheng CP, Little WC. Mechanism of altered patterns of left ventricular filling during the development of congestive heart failure. Circulation. 1994;89:2241–2250. doi: 10.1161/01.cir.89.5.2241. [DOI] [PubMed] [Google Scholar]
- 4.Wood NB. Aspects of fluid dynamics applied to the larger arteries. J Theor Biol. 1999;199:137–161. doi: 10.1006/jtbi.1999.0953. [DOI] [PubMed] [Google Scholar]
- 5.Isaaz K. Expanding the frontiers of Doppler echocardiography for the noninvasive assessment of diastolic hemodynamics. J Am Coll Cardiol. 2000;36:1950–1952. doi: 10.1016/s0735-1097(00)00957-8. [DOI] [PubMed] [Google Scholar]
- 6.Haugen BO, Berg S, Brecke KM, Torp H, Slordahl SA, Skjaerpe T, Samstad SO. Blood flow velocity profiles in the aortic annulus: a 3-dimensional freehand color flow Doppler imaging study. J Am Soc Echocardiogr. 2002;15:328–333. doi: 10.1067/mje.2002.117292. [DOI] [PubMed] [Google Scholar]
- 7.Thomas N, Taylor P, Padayachee S. The impact of theoretical errors on velocity estimation and accuracy of duplex grading of carotid stenosis. Ultrasound Med Biol. 2002;28:191–196. doi: 10.1016/s0301-5629(01)00498-7. [DOI] [PubMed] [Google Scholar]
- 8.Weber G, Strauss AL, Rieger H, Scheffler A, Eisenhoffer J. Validation of Doppler measurement of pressure gradients across peripheral model arterial stenosis. J Vasc Surg. 1992;16:10–16. doi: 10.1067/mva.1992.34216. [DOI] [PubMed] [Google Scholar]
- 9.Ebbers T, Wigstrom L, Bolger AF, Engvall J, Karlsson M. Estimation of relative cardiovascular pressures using time-resolved three-dimensional phase contrast MRI. Magn Reson Med. 2001;45:872–879. doi: 10.1002/mrm.1116. [DOI] [PubMed] [Google Scholar]
- 10.Tasu JP, Jolivet O, Bittoun J. From flow to pressure: estimation of pressure gradient and derivative by MR acceleration mapping. MAGMA. 2000;11:55–57. doi: 10.1007/BF02678495. [DOI] [PubMed] [Google Scholar]
- 11.Tyszka JM, Laidlaw DH, Asa JW, Silverman JM. Three-dimensional, time-resolved (4D) relative pressure mapping using magnetic resonance imaging. J Magn Reson Imaging. 2000;12:321–329. doi: 10.1002/1522-2586(200008)12:2<321::aid-jmri15>3.0.co;2-2. [DOI] [PubMed] [Google Scholar]
- 12.Tasu JP, Mousseaux E, Delouche A, Oddou C, Jolivet O, Bittoun J. Estimation of pressure gradients in pulsatile flow from magnetic resonance acceleration measurements. Magn Reson Med. 2000;44:66–72. doi: 10.1002/1522-2594(200007)44:1<66::aid-mrm11>3.0.co;2-#. [DOI] [PubMed] [Google Scholar]
- 13.Yang GZ, Kilner PJ, Wood NB, Underwood SR, Firmin DN. Computation of flow pressure fields from magnetic resonance velocity mapping. Magn Reson Med. 1996;36:520–526. doi: 10.1002/mrm.1910360404. [DOI] [PubMed] [Google Scholar]
- 14.Urchuk SN, Plewes DB. MR measurement of pulsatile pressure gradients. J Magn Reson Imaging. 1994;4:829–836. doi: 10.1002/jmri.1880040615. [DOI] [PubMed] [Google Scholar]
- 15.Pelc NJ, Bernstein MA, Shimakawa A, Glover GH. Encoding strategies for three-direction phase-contrast MR imaging of flow. J Magn Reson Imaging. 1991;1:405–413. doi: 10.1002/jmri.1880010404. [DOI] [PubMed] [Google Scholar]
- 16.Feinstein JA, Epstein FH, Arai AE, Foo TK, Hartley MR, Balaban RS, Wolff SD. Using cardiac phase to order reconstruction (CAPTOR): a method to improve diastolic images. J Magn Reson Imaging. 1997;7:794–798. doi: 10.1002/jmri.1880070505. [DOI] [PubMed] [Google Scholar]
- 17.Doyle M, Walsh EG, Blackwell GG, Pohost GM. Block regional interpolation scheme for k-space (BRISK): a rapid cardiac imaging technique. Magn Reson Med. 1995;33:163–170. doi: 10.1002/mrm.1910330204. [DOI] [PubMed] [Google Scholar]
- 18.Bernstein MA, Grgic M, Brosnan TJ, Pelc NJ. Reconstructions of phase contrast, phased array multicoil data. Magn Reson Med. 1994;32:330–334. doi: 10.1002/mrm.1910320308. [DOI] [PubMed] [Google Scholar]
- 19.Jaluria Y. Computer methods for engineering. Allyn and Bacon, Inc.; Needham Heights: 1998. p. 85. [Google Scholar]
- 20.Thompson RB, McVeigh ER. High temporal resolution phase contrast MRI with multiecho acquisitions. Magn Reson Med. 2002;47:499–512. doi: 10.1002/mrm.10079. [DOI] [PMC free article] [PubMed] [Google Scholar]
- 21.Bermejo J, Antoranz JC, Yotti R, Moreno M, Garcia-Fernandez MA. Spatio-temporal mapping of intracardiac pressure gradients. A solution to Euler's equation from digital postprocessing of color Doppler M-mode echocardiograms. Ultrasound Med Biol. 2001;27:621–630. doi: 10.1016/s0301-5629(01)00349-0. [DOI] [PubMed] [Google Scholar]
- 22.Tonti G, Pedrizzetti G, Trambaiolo P, Salustri A. Space and time dependency of inertial and convective contribution to the transmitral pressure drop during ventricular filling. J Am Coll Cardiol. 2001;38:290–292. doi: 10.1016/s0735-1097(01)01355-9. [DOI] [PubMed] [Google Scholar]
- 23.Yang GZ, Mohiaddin RH, Kilner PJ, Firmin DN. Vortical flow feature recognition: a topological study of in vivo flow patterns using MR velocity mapping. J Comput Assist Tomogr. 1998;22:577–586. doi: 10.1097/00004728-199807000-00013. [DOI] [PubMed] [Google Scholar]
- 24.Fyrenius A, Wigstrom L, Ebbers T, Karlsson M, Engvall J, Bolger AF. Three dimensional flow in the human left atrium. Heart. 2001;86:448–455. doi: 10.1136/heart.86.4.448. [DOI] [PMC free article] [PubMed] [Google Scholar]
- 25.Karam M, Wise RA, Natarajan TK, Permutt S, Wagner HN. Mechanism of decreased left ventricular stroke volume during inspiration in man. Circulation. 1984;69:866–873. doi: 10.1161/01.cir.69.5.866. [DOI] [PubMed] [Google Scholar]
- 26.Thompson RB, Ennis DB, Derbyshire JA, Arai AE, McVeigh ER. Respiratory resolved cine phase contrast MRI: measurement of right and left heart cardiac output during inspiration and expiration; Proceedings of the 10th Annual Meeting of ISMRM; Honolulu. 2002. p. 516. [Google Scholar]


