Abstract
Background
Regional performance of the hypertrophied left ventricle (LV) in hypertrophic cardiomyopathy (HCM) is still incompletely characterized with studies variably reporting that the hypertrophied myocardium is hypokinetic, akinetic, or has normal function. Different imaging modalities (M-mode or two-dimensional echocardiography) and methods of analysis (fixed or floating frame of reference for wall motion analysis) yield different results. We assessed regional function in terms of systolic wall thickening and shortening and related these parameters to end-diastolic thickness using tagged magnetic resonance imaging and the three-dimensional volume-element approach.
Methods and Results
In 17 patients with HCM and 6 healthy volunteers, four parallel short-axis images with 12 radial tags and two mutually orthogonal long-axis images with four parallel tags were obtained at end diastole and end systole. After the LV endocardial and epicardial borders were traced, three-dimensional volume elements were constructed by connecting two matched planar segments in two adjacent short-axis image planes, accounting for translation, twist, and long-axis shortening. A total of 72 such volume elements encompassed the entire LV. From each of these elements, end-diastolic thickness and systolic function (fractional thickening and circumferential shortening) were calculated. The average end-diastolic thickness was 15.8±4.2 mm in patients with HCM, which was significantly greater than that in healthy subjects (8.6±2.1 mm, P<.001). Fractional thickening was significantly less in patients with HCM than in healthy subjects (0.31±0.22 versus 0.56±0.23, P<.001). There was a highly significant inverse correlation between fractional thickening and end-diastolic thickness that was independent of the type of hypertrophy or age group. Similar inverse relations were observed between circumferential shortening and end-diastolic wall thickness.
Conclusions
The myocardium in patients with HCM is heterogeneously thickened and the fractional thickening and circumferential shortening of the abnormally thickened myocardium are reduced compared with healthy subjects. The decrease in fractional thickening and shortening is inversely related to the local thickness.
Keywords: Wall thickness, magnetic resonance imaging, left ventricle, cardiomyopathy
The left ventricle (LV), approximately two thirds of which is free wall and one third is septum, normally shows small regional differences in geometry, wall thickness, and load1 that may cause nonuniform myocardial mechanical performance across the wall thickness and throughout the regions.2-4 In hypertrophic cardiomyopathy (HCM), heterogeneities in wall thickness as well as composition and fiber structure are greater and therefore may be associated with greater variation in regional myocardial performance. Regional systolic function of the hypertrophied myocardium has been a subject of extensive studies with controversial results. Some studies show that the hypertrophied myocardium is hypokinetic or akinetic,5-8 whereas others show normal systolic wall motion of the hypertrophic muscle.9,10 Two recent studies8,10 reached opposite conclusions. Maier et al,8 using magnetic resonance imaging (MRI) tagging, found that the wall motion of the hypertrophied septum was significantly reduced, whereas Betocchi et al,10 using biplane left ventriculography, showed that the septum exhibited normal wall motion. In addition, different echocardiographic approaches (M-mode or two-dimensional echocardiography) and different methods of analysis (fixed or floating frame of reference for assessment of wall motion) also yield differing results.9
The limitation of all the previous methods for regional function analysis stems from the inadequacy of a single two-dimensional image to truly represent the complex three-dimensional geometry, the inability to follow the myocardium from end diastole to end systole, and, because of a lack of myocardial markers, inability to correctly measure wall thickness and segmental shortening.
MRI tagging is a recently developed technique9-11 by which presaturation tags or markers can be noninvasively placed at any location in the myocardium and at any phase of the cardiac cycle. Tagging the myocardium at end diastole and following it to end systole allows the investigator to directly measure regional systolic myocardial deformation and overcomes the limitation of tracing a point from end diastole to end systole.2,8,14,15 A recent study8 used a modification of this new technique to investigate the regional LV function in HCM in terms of rotation and regional wall motion and found decreased rotation in posterior region and decreased wall motion in septal and posterior regions. However, how wall motion relates to regional function and how these observations relate to the hypertrophied regions are still unclear. The aims of the present study therefore were (1) to describe regional function in terms of systolic wall thickening and shortening using the advantage of three-dimensional reconstruction and the volume-element approach and (2) to relate regional function to end-diastolic wall thickness in individual patients as well as in the entire group.
Methods
Patient Selection
Seventeen patients with HCM were studied (Table 1; 12 men and 5 women; age range, 21 to 72 years; mean±SD age, 46±14 years). Hypertrophy was asymmetrical septal in 9 patients, symmetrical in 6 patients, and apical in 2 patients. All patients had regular cardiac rhythms, were in either NewYork Heart Association functional class I or II, and had no contraindication for MRI. A septal myotomy/myectomy had been performed in 1 patient, and catheterization studies had been performed in 7 patients. A control group of 6 healthy volunteers (5 men and 1 woman; age range, 31 to 40 years) was also studied for comparison.
Table 1.
Clinical Data From Patients With HCM
| Patient | Sex/Age,
y |
Diagnosis | S/P
Thickness |
SAM | Gradient |
|---|---|---|---|---|---|
| 1 | M/32 | ASH | 18/9 | + | − |
| 2 | F/31 | SH | 17/14 | + | 23 |
| 3 | M/56 | ASH | 21/12 | + | 25 |
| 4 | M/38 | SH | 15/12 | − | − |
| 5 | F/46 | ASH | 23/8 | − | − |
| 6 | M/47 | SH | 15/14 | − | − |
| 7 | M/65 | ASH | 18/12 | + | − |
| 8 | M/48 | AH | 12/12 | − | − |
| 9 | M/47 | SH | 17/14 | + | 15 |
| 10 | M/46 | SH | 15/12 | − | − |
| 11 | M/21 | ASH | 20/11 | + | − |
| 12 | M/28 | AH | 19/14 | − | − |
| 13 | M/64 | ASH | 16/12 | + | 63 |
| 14 | M/44 | ASH | 27/10 | + | 13 |
| 15 | F/53 | SH | 22/20 | + | − |
| 16 | F/72 | ASH | 19/14 | − | 50 |
| 17 | F/40 | ASH | 26/8 | + | − |
HCM indicates hypertrophic cardiomyopathy; S/P thickness, left ventricular septal/posterior thickness; SAM, systolic anterior motion; ASH, asymmetrical septal hypertrophy; SH, symmetrical hypertrophy; AH, apical hypertrophy; +, phenomenon that was present; and −, phenomenon that was not present.
MRI Acquisition
MRI was performed on a Signa 1.5-T scanner (General Electric Company Medical Systems). After the patient had been positioned in the magnet, six series of images were acquired. First, four series were planning scans to determine the orientation of the heart, the location of the image and tag planes for series 5 and 6, and the timing of end systole; series 5 and 6 were performed to obtain the final images for the study.
A sagittal single-slice, single-phase image was acquired that encompassed the entire LV (series 1). From this sagittal image, the silhouette of the heart was identified, and a multislice (8 to 10 slices) coronal scan was performed through the heart at a single time point (series 2). A cine image sequence (series 3) was also generated from a coronal slice that traversed the largest LV cavity area (including aortic valves). End systole was then identified as the moment at which the LV cavity was the smallest, immediately preceding flow reversal. From the coronal image with the largest LV cavity area in series 2 or 3, we selected an oblique long-axis image plane that passed through both the LV apex and the aortic orifice, and we acquired images at both end diastole and end systole (series 4).
From the oblique long-axis images, four parallel short-axis image planes (perpendicular to the long axis) were identified (series 5). Basal and apical planes were first located. The basal plane passed just below the mitral valves and cut through the muscular septum, and the apical plane passed just above the apical endocardium on both end-diastolic and end-systolic images. The remaining two midventricular image planes were then defined to trisect equally the interval between the basal and apical planes. Two mutually orthogonal long-axis image planes (series 6) were identified from the short-axis images; one plane was superimposed on the tag plane that cut through the middle of the ventricular septum. Acquisition of the four parallel short-axis and two orthogonal long-axis images was triggered by the R wave and accomplished using a multislice, multiphase spin-echo technique (time to echo, 14 milliseconds; time to repetition, the RR interval). The gated images were acquired by entering the desired delay after the R wave. Because each final image (series 5 and 6) required 256 cardiac cycles, a total of 1024 cardiac cycles were required for the four short-axis image acquisitions, and 512 cardiac cycles were required for the two long-axis acquisitions. The parameters for these images were a 256×128 matrix, two averages, 32- to 44-cm field of view, and 10-mm slice thickness. The tag lines were placed perpendicularly to the image plane at end diastole and persisted (for about 500 milliseconds) to end systole. During acquisition of the short-axis images, six tag planes separated by 30° of arc were made to intersect along the long axis of the LV, which produced 12 radial tag lines in each short-axis image. During acquisition of the long-axis images, four parallel tags were placed at the end-diastolic short-axis image planes; therefore, by following the motion of the tags, we could assess the magnitude of short-axis through-plane motion. The thickness of each tag plane was 3.0 mm. Fig 1 shows an example of such short-axis and long-axis images.
Fig 1.
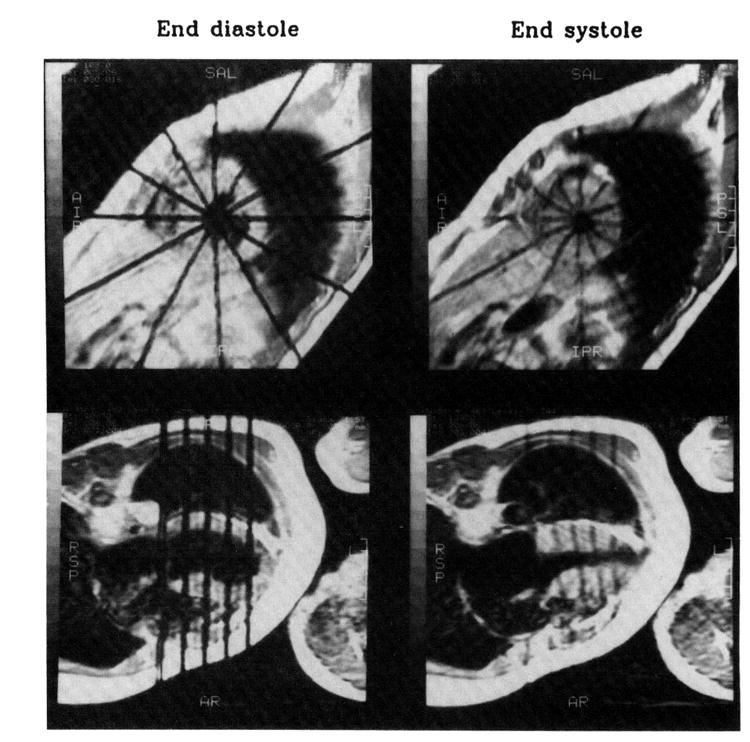
Short-axis and long-axis images from a patient with hypertrophic cardiomyopathy. Tags (black lines) were placed at end diastoleand persisted to end systole. The short-axis images correspond to the second slice from the base, and long-axis images correspond to the plane that cuts through the middle of the ventricular septum at both end diastole and end systole. Note that at end diastole, the tag lines are straight, and at end systole, the tag lines are displaced because of myocardial contraction. In long-axis images, during systole parallel tags moved downward toward the apex, which hardly moved at all. (The fifth tag line at mitral valve level is an extra one thatwas not used in the analysis.)
Data Analysis
Image Processing
The files containing the digitized MRI data were transferred through a network to an IBM-compatible personal computer (Pack-Mate 386X/25, Packard Bell), where the original MRI data were linearly converted to a PC image file (an array of 256×256 gray levels), and image processing and data analysis were performed.
LV endocardial and epicardial borders on the short-axis images were manually marked at the intersection with each of the 12 tags. An Akima16 smoothing algorithm was used to interpolate between the points of intersection, and one interpolated point was created midway between adjacent marked points. The resulting smooth contour was superimposed on the image for comparison. The contour point was adjusted until satisfactory matches were obtained with the endocardial and epicardial borders. The tracing procedure resulted in two (LV endocardial and epicardial) sets of four (slice) contours at both end diastole and end systole. Each of these output files contained 24 data points: 12 manually marked points of intersection and 12 interpolated points. (Twenty-four segments were then produced by connecting corresponding endocardial and epicardial points.)
We also traced the endocardial and epicardial borders of the long-axis LV images to calculate the degree of base-to-apex translation of the short-axis images.
Correction for Base-to-Apex Translation of Short-Axis Images
As seen in the long-axis images in Fig 1 (bottom), as the heart contracted the myocardial tag lines moved downward toward the apex, which hardly moved at all. The magnitude of this systolic descent (which was calculated as the pixel difference between end diastole and end systole multiplied times pixel size) decreased from the basal to the apical slice (Table 2) and was linearly related to the end-diastolic (tag) distance from epicardial apex (Fig 2). Therefore, the image-acquisition technique produced end-diastolic and end-systolic images that were identical in location but were obtained from different myocardial segments due to base-to-apex translation.
Table 2.
Myocardial Systolic Descent (Through-Plane Shortening) at Different Regions and Different Slices
| HCM (n=17) | Healthy Controls (n=6) | |||||||||
|---|---|---|---|---|---|---|---|---|---|---|
| Slice | Anterior | Lateral | Posterior | Septal | Mean | Anterior | Lateral | Posterior | Septal | Mean |
| 1 | 5.4±2.4 | 7.1±3.1 | 7.7±3.4 | 6.6±2.3 | 6.7±2.9 | 10.2±5.2 | 11.9±3.4 | 12.3±3.4 | 10.8±3.1 | 11.3±3.7 |
| 2 | 3.9±2.1 | 4.5±2.6 | 5.7±2.8 | 5.6±1.9 | 4.9±2.4 | 8.0±4.8 | 9.2±3.4 | 9.6±2.9 | 8.7±2.0 | 8.9±3.3 |
| 3 | 2.4±1.7 | 2.9±2.3 | 4.7±2.3 | 3.8±1.3 | 3.5±2.1 | 5.9±5.2 | 6.6±3.4 | 7.0±3.0 | 5.8±2.8 | 6.3±3.5 |
| 4 | 1.0±1.8 | 1.4±2.0 | 2.3±1.9 | 1.0±1.2 | 1.4±1.8 | 2.4±3.1 | 3.6±2.9 | 3.8±3.1 | 2.4±2.9 | 3.1±2.9 |
HCM indicates hypertrophic cardiomyopathy.
Slice 1 is basal, and slice 4 is apical. There were significant differences in systolic descent between different regions at each level of slices in HCM: posterior>lateral and septal (P<.005, no significant difference between lateral and septal)>anterior (P<.05). Although a similar trend existed (posterior>lateral and septal>anterior), no significant differences were observed between different regions in healthy controls. At each region, this descent was significantly greater in controls than that of patients with HCM (P<.01). The systolic descent decreased from basal to apical slice (P<.001) in both HCM and healthy groups.
Fig 2.
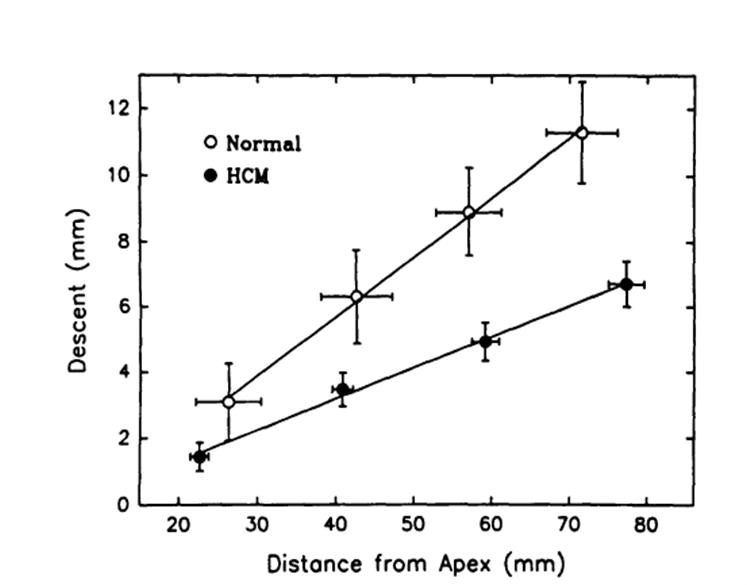
Plot of relations between the longitudinal descent of the tags and their end-diastolic distance from the epicardial apex for healthy subject sand for patients with hypertrophic cardiomyopathy (HCM). Note that there were very good linear descent-distance relations for both sets of data and that the slope of the relation in HCM was significantly less than that in healthy controls (P<.05), indicating that the longitudinal shortening in HCM was smaller than that in controls.
To correct for this longitudinal translation, we developed a program that uses an algorithm that matches the short- and long-axis images to obtain complete three-dimensional information throughout the cycle. A similar matching algorithm is reported in the recent literature.17 A linear-interpolation algorithm is used to calculate the corrected position of the tag-endocardial and tag-epicardial intersections of the end-systolic short-axis images (see “Appendix”). The new interpolated points are the physical points that have translated with the muscle, both in the short-axis plane and in the long-axis direction, to its end-systolic location. This procedure was performed to calculate all the endocardial and epicardial points for all four slices. Fig 3 shows the three-dimensional end-diastolic and corrected end-systolic profiles (data are from the same patient with HCM as in Fig 1).
Fig 3.
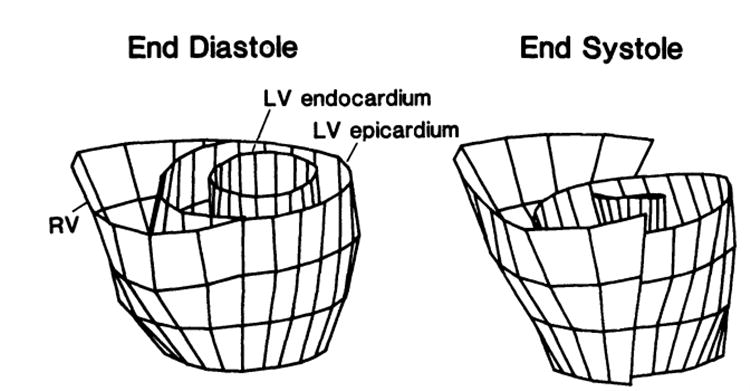
Reconstruction of three-dimensional end-diastolic and interpolated end-systolic profiles from tracings of the same patient with hypertrophic cardiomyopathy as shown in Fig 1. Note that the left ventricular (LV) end-systolic image slices were corrected and moved downward by the amount of the tag descent from the long-axis images (see bottom panel of Fig 1) compared with uncorrected right ventricular (RV) image slices.
Calculation of Geometric Parameters
Thickness was calculated by using the three-dimensional volume-element approach.15,18,19 Briefly, we first constructed three-dimensional volume elements by using two adjacent short-axis image planes and connecting the corresponding points that defined the segments in each plane (four points for each segment of each plane). Therefore, there were a total of 72 volume elements encompassing the entire LV: 24 segments in each of the three rings that were produced by the four short-axis image slices. We then calculated the endocardial (Aendo) and epicardial (Aepi) surface areas and the volume (V) of the element geometrically. Thickness (h) was calculated as h = 2V/(Aendo+Aepi), thickening (Th) as Th = hes–hed, and fractional thickening (fTh) as fTh = (hes–hed)/hed, where hed and hes are the end-diastolic and end-systolic thicknesses, respectively.
Regional circumferential endocardial and epicardial shortening (Sh) was calculated as Sh=(Led–Les)/Led, where Led is the end-diastolic length, and Les is the end-systolic length. The shortening of the volume element was then calculated as the average shortening of the two adjacent slices.
Statistical Analysis
Values are given as mean±SD. Student’s unpaired t tests were used to compare the differences between HCM and healthy subjects, and ANOVA was used to assess the significance of the differences in wall thickness and thickening between different regions. Values of P<.05 were considered to be significant.
Results
Global LV Systolic Function
LV ejection fraction, which was calculated from the LV end-diastolic and end-systolic cavity volumes between the basal and apical slices, was not significantly different for patients with HCM than for healthy subjects (0.66±0.07 versus 0.69±0.08, respectively).
Thickness and Thickening in Different Regions
Wall thickness and thickening varied greatly in patients with HCM. In a patient with asymmetrical septal hypertrophy, as shown as an example in Fig 4A, there was an apparent hypertrophy in septal and anterior regions at basal and mid levels of the LV, which corresponded to a small systolic fractional thickening. In comparison, in the healthy case shown in Fig 4B, there was no relation between thickness and thickening, which was subjected to variations. On average, the thickness and thickening were significantly different between regions in the HCM group: the anterior and septal regions were thicker and thickened less than the later a land posterior regions (Table 3). However, in the healthy group, neither thickness nor thickening was significantly different between the regions. In all regions, the average end-diastolic thickness in patients with HCM was significantly greater than that in healthy subjects, whereas the fractional thickening in patients with HCM was significantly less (Table3). The absolute thickening in patients with HCM was decreased only in the septal and anterior regions compared with those of healthy subjects (Table 2).
Fig 4.
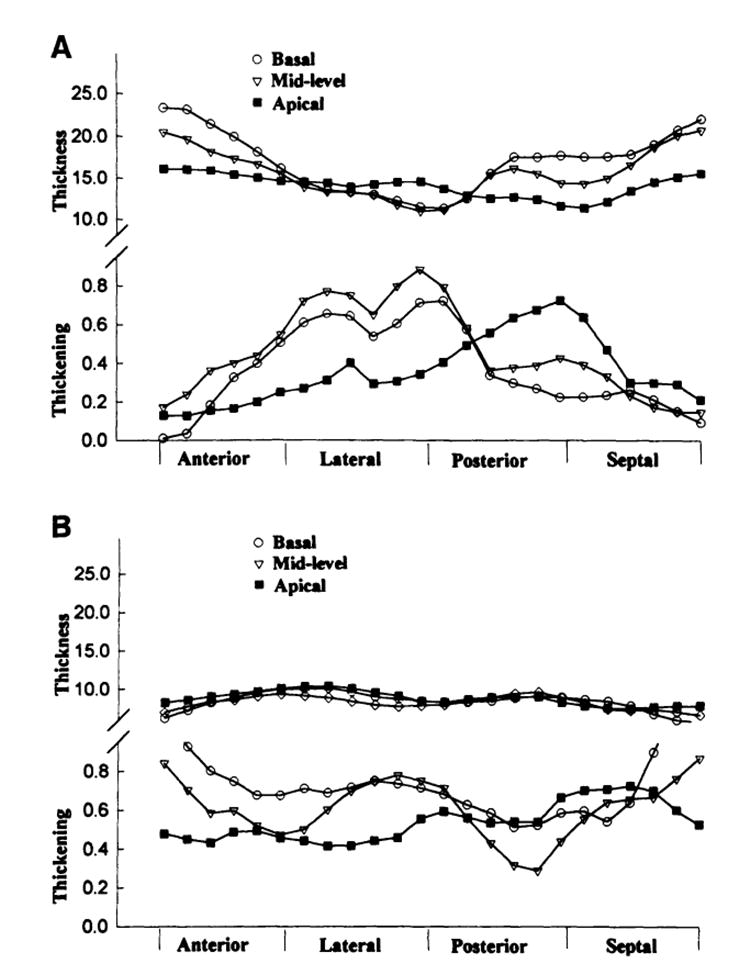
Plots of thickness and thickening of the three-dimensional volume elements at different regions and different slices from a patient with asymmetrical septal hypertrophy (A) in comparison to a healthy subject (B). Note that the volume elements at septal and anterior regions of basal and midlevel slices had severe hypertrophy that corresponded to a decreased systolic thickening, whereas at lateral and posterior regions, the thickness and thickening remained normal. The normal case shows some variations in thickening, but these variations do not correspond to the thickness, which looks relatively homogeneous.
Table 3.
Left Ventricular Regional Thickness and Thickening in Patients With HCM and Healthy Controls
| Thickness, mm | Fractional Thickening | Thickening, mm | ||||
|---|---|---|---|---|---|---|
| HCM | Controls | HCM | Controls | HCM | Controls | |
| Anterior | 16.7±3.5 | 8.4±1.2* | 0.23±0.18 | 0.53±0.25* | 3.6±2.7 | 4.2±1.5* |
| Lateral | 14.9±3.3† | 9.2±1.3* | 0.38±0.24† | 0.56±0.25* | 4.9±2.8† | 5.0±1.8 |
| Posterior | 1 5.0±4.5† | 8.3±1.2* | 0.35±0.24† | 0.58±0.24* | 4.5±2.6† | 4.7±1.6 |
| Septal | 16.7±5.1 | 8.4±0.9* | 0.28±0.20 | 0.54±0.19* | 3.9±2.8 | 4.5±1.3* |
| Mean±SD | 15.8±4.2 | 8.6±1.2* | 0.31±0.22 | 0.56±0.23 | 4.2±2.8 | 4.6±1.6 |
HCM indicates hypertrophic cardiomyopathy.
P<.01, compared with patients with HCM;
P<.05, compared with septal and anterior regions.
Thickness-Thickening Relations
When thickening was plotted against end-diastolic thickness, an inverse relation was clearly observed in patients with HCM: the thicker the wall, the less the thickening. Fig 5 shows an example of the relation between fractional thickening and end-diastolic thickness from a patient with HCM (closed circles indicate the patient from Fig 4) and a healthy subject (open circles). The relation is not as clear in the healthy subjects. For further analysis, we then segregated and averaged data with in incremental bins of 5-mm end-diastolic thickness. Fig 6 is a summary plot of the relations between fractional (A) and absolute (B) thickening and end-diastolic thickness from both groups. The inverse relation between thickening and thickness is clearly present, independent of how thickening is calculated (fractional versus absolute values).
Fig 5.
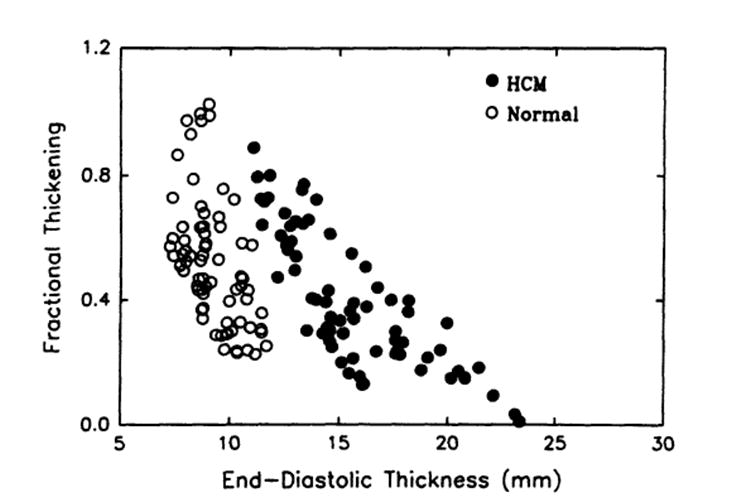
Scatterplot of relations between regional systolic fractional thickening and end-diastolic thickness. Data are from a patient with hypertrophic cardiomyopathy (HCM) (closed circles, the same patient as in Fig 4) and a healthy subject (open circles). There was a clear inverse relation in the patient with HCM.
Fig 6.
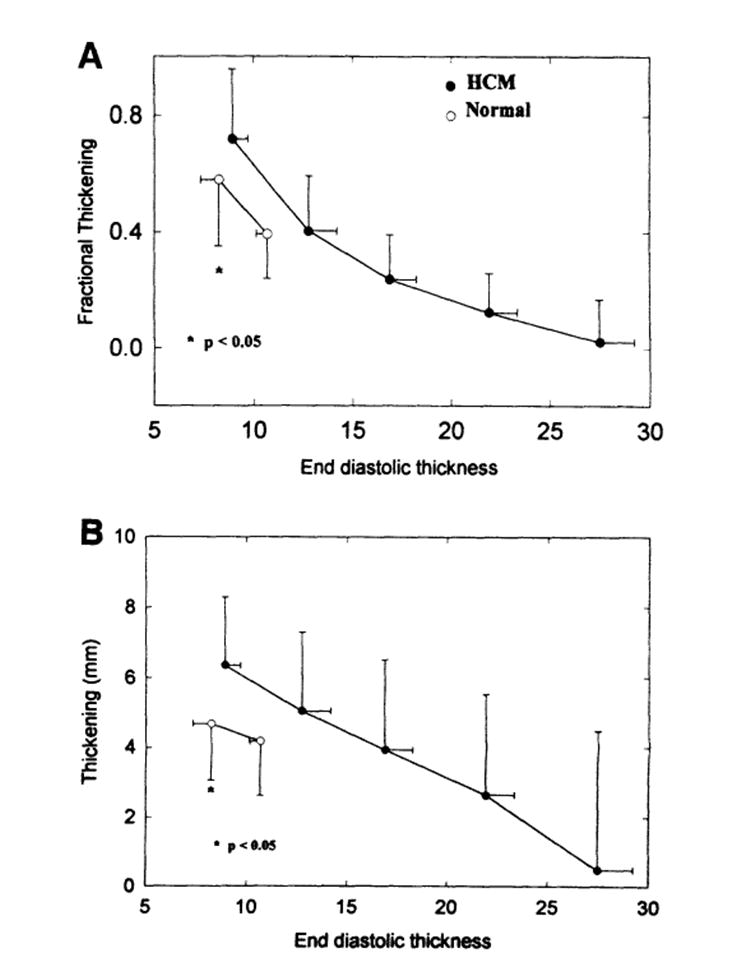
Summary plot of fractional (A) and absolute (B) thickening and end-diastolic thickness relations (pooled data that were segregated and averaged within bins of 5-mm increments of end-diastolic thickness). An inverse relation is seen between both fractional and absolute thickening and end-diastolic thickness in the hypertrophic cardiomyopathy (HCM) group. Note that the thickening of normal thickness segments inpatients with HCM was significantly greater than that of the healthy subjects (P<.05).
Because asymmetrical and symmetrical HCM are structurally and hemodynamically different, we analyzed separately these two subgroups of patients. Fig 7 shows no significant difference between the HCM groups in the fractional thickening-thickness relation, indicating that functional expressions of the hypertrophied myocardium in these two subgroups of patients with HCM are similar.
Fig 7.
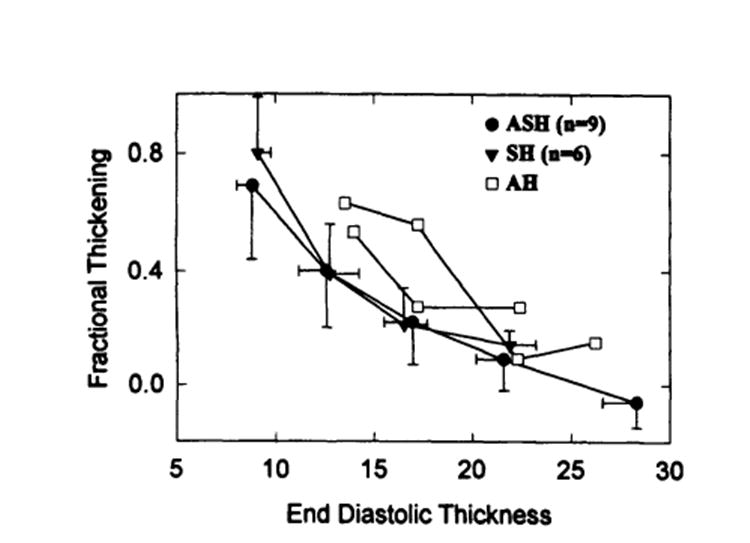
Plot of comparison of fractional thickening–end-diastolic thickness relation between asymmetrical septal (ASH, closed circles) and symmetrical (SH, closed triangles) hypertrophies. Note that no significant difference was observed between these two sub groups of patients. Open squares represent two individuals of patients with apical hypertrophy (AH).
To see the effect of age on the thickening-thickness relation, we divided the patients with HCM into three age groups: <40 years (n=6), 40 to 50 years (n=6), and >50 years (n=5). Fig 8 shows that there was no significant difference in fractional thickening-thickness relation among these three age groups.
Fig 8.
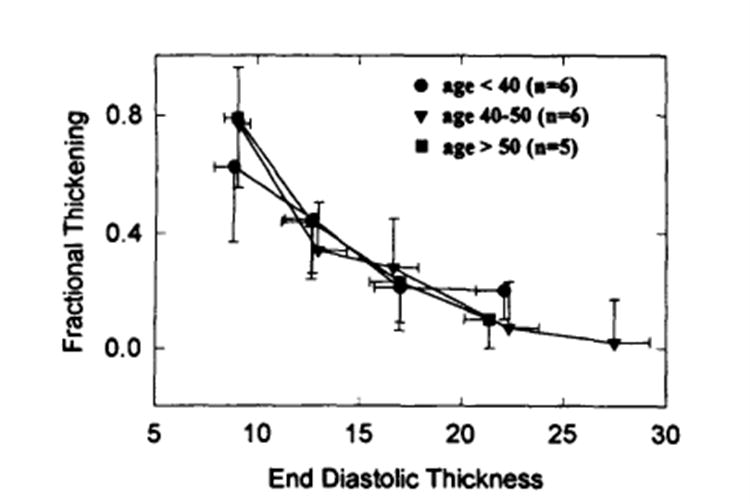
Plot of comparison of fractional thickening–end-diastolic thickness relation between three age groups (<40years, n=6; 40 to 50 years, n=6; >50 years, n=5). Note that there was no significant difference between these three age groups.
Thickness-Shortening Relations
Similar inverse relations were observed between the circumferential endocardial and epicardial shortening and end-diastolic wall thickness in patients with HCM, except for the segments with normal thickness (Fig 9). There was no significant difference between patients with HCM and healthy subjects with respect to either endocardial or epicardial circumferential shortening of the segments with the normal thickness.
Fig 9.
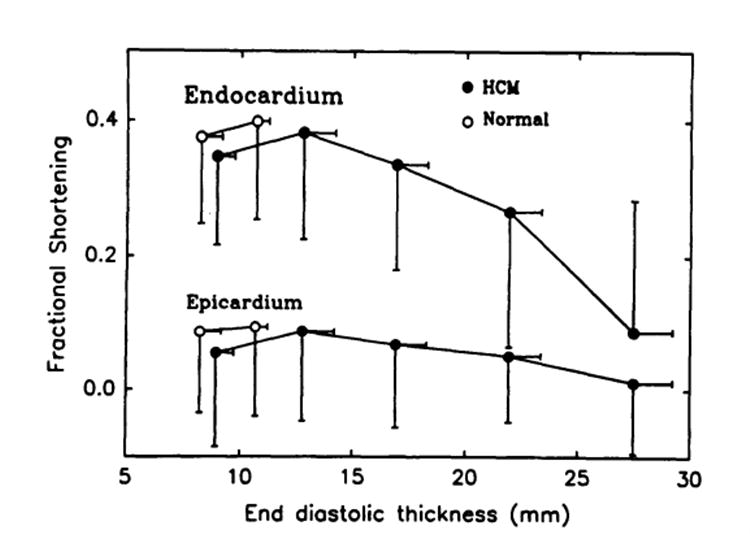
Plot of circumferential endocardial and epicardial shortening and end-diastolic wall thickness (Pooled data also segregated and averaged within bins of 5-mm increments of the end-diastolic thickness). Inverse relations were observed between circumferential endocardial and epicardial shortening and end-diastolic thickeness, which were similar to the thickness–thickening relations shown in Fig 6. HCM indicates hypertrophic cardiomyopathy.
Muscle Volume Conservation
Because the difference in muscle volume between end diastole and end systole might indicate an error in the calculations of the systolic thickening, we compared end-diastolic and end-systolic muscle volume of the three-dimensional volume elements. On average, the muscle volume of the volume elements was slightly but insignificantly smaller in end systole than in end diastole (by 8±4% in the group with HCM, P=NS, and by 6±2% in the healthy group, P=NS). This insignificant difference was similar for elements with small and large fractional thickening. This observation further supports our methodology for calculation of wall thickening.
Interobserver Variability
Comparison of the thickness of the three-dimensional volume elements obtained from the analysis of the first and second observers demonstrated a good reproducibility (r=.864 and .947 for end-diastolic and end-systolic thickness of the healthy group, respectively; .986 and .978 for the group with HCM, respectively; r=.995 for pooled end-diastolic and end-systolic data from both groups).
Discussion
By using MRI tagging and three-dimensional volume-element reconstruction, we have directly measured regional function of the entire LV in patients with HCM and have related it to regional end-diastolic wall thickness. In patients with HCM, (1) systolic function of hypertrophied myocardium was impaired, whereas function of the region with normal thickness remained normal; (2) there was an inverse relation between systolic thickening and end-diastolic wall thickness; and (3) the inverse relation was also demonstrated between systolic circumferential shortening and end-diastolic thickness.
Although studies have consistently shown impairment of diastolic function (ie, reduced early and middiastolic filling20,21 and leftward and upward shift of the end-diastolic pressure-volume relation22), systolic function of the hypertrophied myocardium has not yet been clearly characterized. Widely differing results suggest that the hypertrophic myocardium is akinetic, hypokinetic, or normokinetic.5-10 The disparity in results may be partially attributed to the methods used and partially to the different groups of patients studied in various series. One echocardiographic study9 in which the LV wall motion was analyzed using both fixed- and floating-reference systems produced different results with each of the methods (ie, according to the fixed-reference analysis, the hypertrophic myocardium was hypokinetic, and according to the floating-reference analysis, it was normokinetic). The techniques used so far to characterize myocardial function in patients with HCM have major limitations in that they do not adequately account for the three-dimensional geometry of the heart and specific myocardial points cannot be tracked, and therefore, measurement of regional myocardial function is inaccurate.
A recent study8 in which a gridlike MRI tagging pattern was applied showed that regional circumferential shortening and cardiac rotation were significantly reduced in patients with HCM compared with healthy control subjects. Another study23 in which 201T1 ECG-gated single-photon emission computed tomography was used to assess fractional wall thickening demonstrated that thickening in healthy hearts and in relatively normal-thickness regions of hearts from patients with HCM was 0.53±0.05 and 0.56±0.11, respectively, whereas thickening in hypertrophied areas was significantly less (0.23±0.07). These observations are consistent with our results that systolic thickening decreased in the hypertrophied myocardium and remained normal in segments with normal thickness.
The decreased systolic function of hypertrophied myocardium might be attributed to many factors. First, this may be due simply to mechanical interference between the myocardial cells or layers. Theoretically, the systolic performance of a single cardiac cell might be greater than that of a group of cells connected in parallel. A single cell contracts more uniformly24,25 and, as it shortens, might thicken more freely. When a group of cells are arranged to form normal myocardial tissue, the adjacent cells must thicken toward each other, compete for the limited space, and interfere with the thickening of the adjacent cells. Furthermore, spatial and temporal nonuniformity has been demonstrated in multicellular preparations (eg, papillary muscle).26,27
Increased connective tissue content that limits myocardial shortening and wall thickening might be another contributing factor. Within the myocardium, connective tissue is arranged around (ie, the “weave fibers”) and between (ie, the “struts”) cells and cell groups.28 These connective structures deform and store energy (ie, generate restoring force) as myocardial cells contract. This restoring force tends to keep the structures in their original shape and to limit deformation; therefore, excessive connective tissue might also limit myocardial contraction. In patients with HCM, there is a significant increase in the amount of connective tissue.29,30 A recent study31 demonstrated that there is a marked increase in both pericellular weave fibers and strut connection fibers. We suspect that the increased connective tissue also limits active systolic longitudinal shortening and lateral thickening of the cells rather than just limiting passive diastolic filling as has been well recognized.
Finally, decreased active force generation might be the most important factor contributing to the decrease in systolic function of hypertrophied myocardium. It is not clear how active force generation is depressed. However, possible mechanisms include myocardial fiber disarray, myocardial ischemia, and impaired diastolic function (ie, reduced preload). Myocardial disarray29,32 is characterized by an irregular disarrangement in every level of myocardial organization – myofilaments, myofibrils, fibers, and fascicles. The normal parallel arrangement of myocardial fibers no longer exists in the areas of disarray, which are found predominantly in the ventricular septum but also in the LV and right ventricular free walls. This disarray might result in multidirectional mechanical contraction with a net reduction in apparent myocardial function. In addition, myocardial ischemia might diminish force generation in addition to impairing myocardial relaxation, since studies of HCM have demonstrated abnormalities of small intramyocardial arteries (ie, thickened walls and narrowed lumens33,34) and inadequate capillary density in relation to the hypertrophied myocardial mass.35 Also, decreased coronary flow reserve and abnormal myocardial perfusion were observed in hearts of patients with HCM.36 Furthermore, Starling’s law states that the magnitude of the active force generation of the myocardium depends on its initial length, ie, its preload. In hearts of patients with HCM, myocardial relaxation is impaired21 (possibly due toCa2+ overload and ischemia) and myocardial stiffness is increased21,22 (due to hypertrophied myocardial fibers and proliferation of the connective tissue). These changes might effectively decrease the preload of the hypertrophied myocardium and, so, would decrease active force generation.
It is well known that the asymmetrical septal and symmetrical HCM differ structurally and hemodynamically. However, the present study demonstrated decreased regional systolic function of the hypertrophied myocardium and a similar inverse thickening-thickness relation in both of these subgroups of patients. These results suggest that the expression and possibly mechanisms of the intrinsic functional abnormalities of the hypertrophied myocardium in these two subgroups of patients might be similar.
Our data-acquisition and -analysis techniques have several advantages. First, MRI tagging allows noninvasive placement of markers in the myocardium. Therefore, a reference system is not needed and systolic myocardial deformation can be measured directly, while accounting and correcting for the complex motion of the heart during the cardiac cycle.
Second, our analysis of short-axis images includes correction of long-axis translation. During systole, the LV myocardium moves toward the apex, and the magnitude of this through-plane motion (with respect to short-axis images) is directly related to the distance from the apex, which itself moves little.37,38 This phenomenon was also observed in the present study. The basal tags in the long-axis images (Table 2 and Fig 2) moved toward the apex (11.3±3.7 mm versus the 12.8±3.8-mm descent of MRI-tagged LV base reported by Rogers et a137 and the 13.0±2.5-mm descent of mitral valve plane reported by Hoffman et a138), and this descent decreased near the apex. It must be understood that conventional short-axis images are acquired by a fixed-external-reference system, as in the present study.
Therefore, the technique itself involved an inherent inaccuracy, because the images throughout the cardiac cycle are acquired from different myocardial segments as the heart moved toward the apex through each short-axis plane. We compensated for this inaccuracy mathematically by using linear interpolation on the information derived from the long-axis images. Rogers et al37 recently developed an MRI tissue-isolation technique that allows end-diastolic and end-systolic images to be acquired from the same myocardial segment.
Another advantage of our technique involves the measurement of myocardial wall thickness. We measured thickness using the three-dimensional volume-element approach,15,18 correcting for systolic rotation and longitudinal translation of each myocardial element. This yields a thickness measurement that is independent of the angle between image plane and LV wall and, by avoiding obliquity (especially at the apical region), provides a more accurate measurement of thickness than a planar analysis method. Because the thickness was calculated from the muscle volume of the three-dimensional volume elements, the difference between the end-diastolic and end-systolic muscle volume might affect our thickening calculation. However, we found no significant difference between end-diastolic and end-systolic muscle volume. A trend for a difference in muscle volume of only 8% in the group with HCM and 6% in the healthy group would not critically affect our results.
Finally, we propose that our current approach relating regional systolic function (thickening and shortening) to the local wall thickness provides important information in addition to studies relating function to the anatomic regions8 (ie, septum versus lateral wall, and base versus apex). It has been shown that HCM is a disease with a great individual variability and that “no two hearts are alike.”29 Even in the subgroup of patients with asymmetrical septal hypertrophy, the involvement might be in the basal, midlevel, and/or apical septum.39 Therefore, we divided each short-axis image slice into 24 segments (12 segments from manually marked points and 12 from interpolated points). The smaller the size of the volume elements, the more accurate was the thickness measurement, since the thickness was calculated as the average thickness of the volume elements in the present study. We believe that because of this great heterogeneity, the analysis of the average regional systolic function based on the anatomic region8 may not provide as accurate measure of the relation between the local hypertrophy and function as our current approach.
Studies1,40 in which thickness was measured using sonomicrometric crystals have shown that there also is a difference in systolic thickening across the thickness of wall. In the healthy dog, the endocardial half of the myocardium thickens more than the epicardial half of the myocardium. In dogs in which LV hypertrophy had been produced by banding their aortas, exercise caused endocardial thickening to decrease by 45%, whereas epicardial thickening increased (by 18%). We were unable to separate the endocardial and epicardial components of thickening in the present study.
Regional differences in myocardial relaxation were also observed in patients with HCM.20 Using simultaneous ventricular pressure manometry and cine left ventriculography, Hayashida et a120 found that the relaxation of regional wall stress was more prolonged in the region with increased wall thickness than that in the region with normal thickness in patients with nonuniform LV hypertrophy. The results indicate that increased wall thickness is associated with greater impairment of myocardial relaxation, which is compatible with our present conclusion that the thicker the wall, the more impaired is the thickening.
Conclusions
From this study in patients with HCM in which we used MRI tagging, three-dimensional reconstruction, and correction for motion and displacements to obtain wall thickening and circumferential shortening, we conclude that the systolic function of hypertrophied myocardium is heterogeneously impaired and that the degree of the impairment is inversely related to the wall thickness of the myocardium.
Acknowledgments
Dr Beyar was Visiting Scientist of the Medical Research Council of Canada (Ottawa) and the Alberta Heritage Foundation for Medical Research (AHFMR, Edmonton) on sabbatical leave from Technion (Haifa, Israel) and was supported in part from donations by Alvin and Mona Libin and Ted and Lola Rozsa. Dr Tyberg is a Medical Scientist of the AHFMR. The study was also supported by a grant from the Foothills Hospital Research and Development Committee and by grants-in-aid from the Heart and Stroke Foundation of Alberta (Calgary). We thank Dr Elias Zerhouni of The Johns Hopkins University for his generosity in providing the MRI tagging program, Pierre La Forge of the Department of Radiology, University of Calgary for his assistance in image acquisition, and Dr David Roth for providing some of the patients. The three-dimensional LV reconstruction program (Fig 3) was developed at the Technion-Israel Institute of Technology, Haifa, Israel.
Appendix
To account for longitudinal translation, we developed a program that uses a linear interpolation algorithm to correct the x-y values of the tag-endocardial and tag-epicardial intersections of the end-systolic slice. The procedure is schematically described in Fig 10. In general, the x-y coordinates of the short-axis images are obtained at equal z (longitudinal) locations for both the end-diastolic and end-systolic (A) slices. From the two orthogonal end-systolic long-axis images (one of the two long-axis images was shown, as an example, in the bottom panel of Fig 1), the new z values of the corresponding four epicardial and four endocardial points are obtained. The z values of the rest of the points for each short-axis image were calculated by linear interpolation in the circumferential direction. To obtain the x-y values of the new z points, linear interpolation was performed between two corresponding points of two adjacent slices. For the points C1 and D1 on slices C and D shown in B, the following interpolation was performed to obtain the interpolated point D1′, given the end-systolic point location zD1′:
Fig 10.
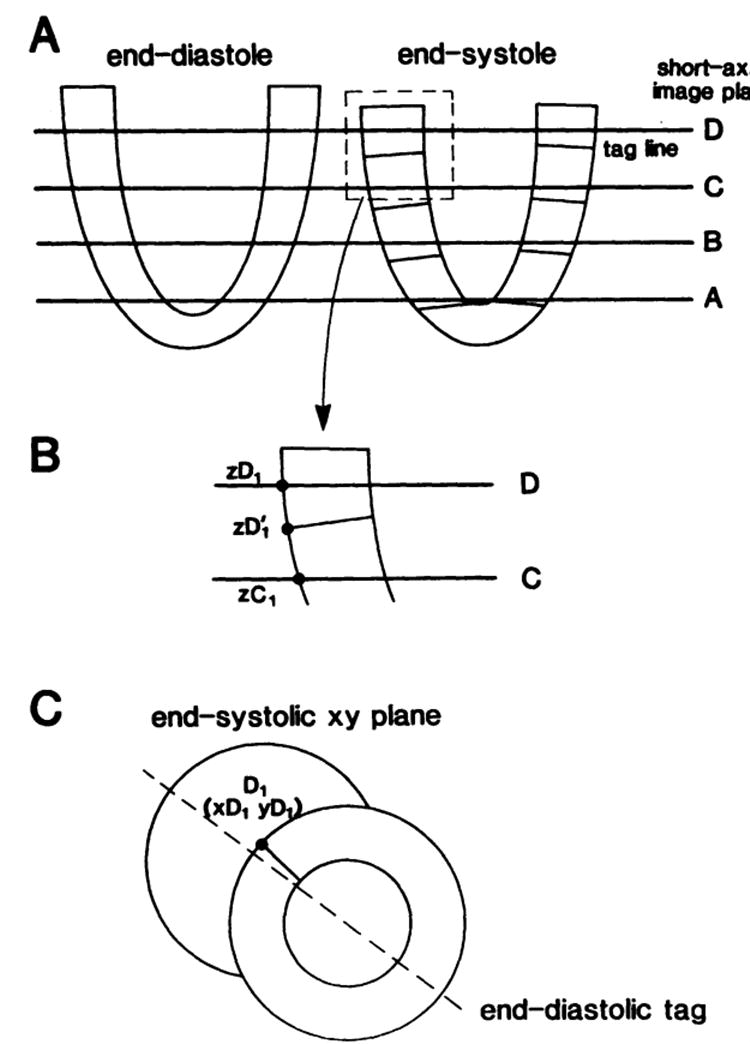
Schematics showing the method for determining the xyz coordinates of the tag-epicardial or tag-endocardial intersections at end systole. A, Short-axis image plane levels in the long-axis view; the end-diastolic and end-systolic short-axis images were obtained at the same location but from different muscle segment due to longitudinal translation (also see Fig 1). The coordinates of the point D1 (point 1 in image plane D, epicardium) are shown. B, Longitudinal translation that was measured as the systolic descent of the tags (from D1 to D′1) in the z direction. C, End-systolic xy values measured from short-axis image of slice D.
where values of xDl and yD1were obtained from end-systolic short-axis images of slice D (C). The new interpolated points represent the identical physical points that have translated with the muscle, both in the x-y plane and in the z direction, to their end-systolic locations. This procedure was performed for all the endocardial and epicardial points of slices A, B, C, and D. The result is the corrected end-systolic location of the set of end-systolic points defined by the junction between the endocardial and epicardial borders with the tag lines.
Contributor Information
Sheng-Jing Dong, Department of Medicine, The University of Calgary, Calgary, Alberta, Canada.
John H. MacGregor, Department of Radiology, The University of Calgary, Calgary, Alberta, Canada.
Adrian P. Crawley, Department of Radiology, The University of Calgary, Calgary, Alberta, Canada.
Elliot McVeigh, The Johns Hopkins University School of Medicine, Baltimore, Md.
Israel Belenkie, Department of Medicine, The University of Calgary, Calgary, Alberta, Canada.
Eldon R. Smith, Department of Medicine, The University of Calgary, Calgary, Alberta, Canada.
John V. Tyberg, Department of Medicine, The University of Calgary, Calgary, Alberta, Canada.
Rafael Beyar, Technion, Israel Institute of Technology, Haifa, Israel.
References
- 1.Beyar R, Weiss JL, Shapiro EP, Graves WL, Rogers WJ, Weisfeldt ML. Small apex-to-base heterogeneity in radius-to-thickness ratio by three-dimensional magnetic resonance imaging. Am J Physiol. 1993;264(Heart Circ Physiol 33):H133–H140. doi: 10.1152/ajpheart.1993.264.1.H133. [DOI] [PubMed] [Google Scholar]
- 2.Gallagher KP, Osakada G, Matsuzaki M, Miller M, Kemper WC, Ross J., Jr Nonuniformity of inner and outer systolic wall thickening in conscious dogs. Am J Physiol. 1985;249:H241–H248. doi: 10.1152/ajpheart.1985.249.2.H241. [DOI] [PubMed] [Google Scholar]
- 3.Clark NR, Reichek N, Bergey P, Hoffman EA, Brownson D, Palmon L, Axel L. Circumferential myocardial shortening in the normal human left ventricle: assessment by magnetic resonance imaging using spatial modulation of magnetization. Circulation. 1991;84:67–74. doi: 10.1161/01.cir.84.1.67. [DOI] [PubMed] [Google Scholar]
- 4.Haendchen RV, Wyatt HL, Maurer G, Zwehl W, Bear M, Meerbaum S, Corday E. Quantitation of regional cardiac function by two-dimensional echocardiography: I. patterns of contraction in the normal left ventricle. Circulation. 1983;67:1234–1246. doi: 10.1161/01.cir.67.6.1234. [DOI] [PubMed] [Google Scholar]
- 5.Cohen MV, Cooperman LB, Rosenblum R. Regional myocardial function in idiopathic hypertrophic subaortic stenosis: an echocardiographic study. Circulation. 1975;53:842–847. doi: 10.1161/01.cir.52.5.842. [DOI] [PubMed] [Google Scholar]
- 6.ten-Cate FJ, Hugenholtz PG, Van Dorp WNG, Roelandt J. Prevalence of diagnostic abnormalities in patients with genetically transmitted asymmetric septal hypertrophy. Am J Cardiol. 1979;43:731–737. doi: 10.1016/0002-9149(79)90071-7. [DOI] [PubMed] [Google Scholar]
- 7.Silverman KJ, Hutchins GM, Weiss JL, Moore GW. Catenoid shape of the interventricular septum in idiopathic subaortic stenosis: two-dimensional echocardiographic confirmation. Am J Cardiol. 1982;49:27–32. doi: 10.1016/0002-9149(82)90273-9. [DOI] [PubMed] [Google Scholar]
- 8.Maier SE, Fischer SE, McKinnon GC, Hess OM, Krayenbuehl H-P, Boesiger P. Evaluation of left ventricular segment wall motion in hypertrophic cardiomyopathy with myocardial tagging. Circulation. 1992;86:1919–1928. doi: 10.1161/01.cir.86.6.1919. [DOI] [PubMed] [Google Scholar]
- 9.Kaul S, Tei C, Shah PM. Interventricular septal and free wall dynamics in hypertrophic cardiomyopathy. J Am Coll Cardiol. 1983;4:1024–1030. doi: 10.1016/s0735-1097(83)80104-1. [DOI] [PubMed] [Google Scholar]
- 10.Betocchi S, Hess OM, Losi MA, Nonogi H, Krayenbuehl HP. Regional left ventricular mechanics in hypertrophic cardiomyopathy. Circulation. 1993;88(pt I):2206–2214. doi: 10.1161/01.cir.88.5.2206. [DOI] [PubMed] [Google Scholar]
- 11.Zerhouni EA, Parish DM, Rogers WJ, Yang A, Shapiro EP. Human heart tagging with MR imaging: a method for noninvasive assessment of myocardial motion. Radiology. 1988;169:59–63. doi: 10.1148/radiology.169.1.3420283. [DOI] [PubMed] [Google Scholar]
- 12.Axel L, Dougherty L. MR imaging of motion with spatial modulation of magnetization. Radiology. 1989;171:841–845. doi: 10.1148/radiology.171.3.2717762. [DOI] [PubMed] [Google Scholar]
- 13.Weiss JL, Shapiro EP, Buchalter MB, Beyar R. Magnetic resonance imaging as a noninvasive standard for the quantitative evaluation of left ventricular mass, ischemia, and infarction. Ann NY Acad Sci. 1990;601:95–106. doi: 10.1111/j.1749-6632.1990.tb37295.x. [DOI] [PubMed] [Google Scholar]
- 14.Buchalter MB, Weiss JL, Rogers WJ, Zerhouni EA, Weisfeldt ML, Beyar R, Shapiro EP. Noninvasive quantification of left ventricular rotational deformation in normal humans using magnetic resonance imaging myocardial tagging. Circulation. 1990;81:1236–1244. doi: 10.1161/01.cir.81.4.1236. [DOI] [PubMed] [Google Scholar]
- 15.Beyar R, Shapiro EP, Graves WL, Rogers WJ, Guyer W, Zerhouni EA, Soulen R, Weisfeldt ML, Weiss JL. Quantification and validation of left ventricular wall thickening by a three-dimensional volume element magnetic resonance imaging approach. Circulation. 1990;81:297–307. doi: 10.1161/01.cir.81.1.297. [DOI] [PubMed] [Google Scholar]
- 16.Akima HA. Method of bivariate interpolation and smooth surface fitting for irregular distributed data points. ACM Trans Math Software. 1978;4:148–159. [Google Scholar]
- 17.Azhari H, Weiss JL, Rogers WJ, Siu CO, Zerhouni EA, Shapiro EP. Noninvasive quantification of principal strains in normal canine hearts using tagged MRI images in 3-D. Am J Physiol. 1993;264(Heart Circ Physiol 33):H205–H216. doi: 10.1152/ajpheart.1993.264.1.H205. [DOI] [PubMed] [Google Scholar]
- 18.Lima JAC, Jeremy R, Guier W, Bouton S, Zerhouni E, McVeigh E, Buchalter MB, Weisfeldt ML, Shapiro EP, Weiss JL. Accurate systolic wall thickening by nuclear magnetic resonance imaging with tissue tagging: correlation with sonomicrometers in normal and ischemic myocardium. J Am Coll Cardiol. 1993;21:1741–1751. doi: 10.1016/0735-1097(93)90397-j. [DOI] [PubMed] [Google Scholar]
- 19.Azhari H, Sideman S, Weiss JL, Shapiro EP, Weisfeldt ML, Graves WL, Rogers WJ, Beyar R. Three-dimensional mapping of acute ischemic regions using MRI: wall thickening versus motion analysis. Am J Physiol. 1990;259:H1492–H1503. doi: 10.1152/ajpheart.1990.259.5.H1492. [DOI] [PubMed] [Google Scholar]
- 20.Hayashida W, Kumada T, Kohno F, Noda M, Ishikawa N, Kojima J, Himura Y, Kawai C. Left ventricular regional relaxation and its nonuniformity in hypertrophic nonobstructive cardiomyopathy. Circulation. 1991;84:1496–1504. doi: 10.1161/01.cir.84.4.1496. [DOI] [PubMed] [Google Scholar]
- 21.Gwathmey JK, Warren SE, Briggs GM, Copelas L, Feldman MD, Phillips PG, Callahan M, Jr, Schoen FJ, Grossman W, Morgan JP. Diastolic dysfunction in hypertrophic cardiomyopathy: effect on active force generation during systole. J Clin Invest. 1991;87:1023–1031. doi: 10.1172/JCI115061. [DOI] [PMC free article] [PubMed] [Google Scholar]
- 22.Gaasch W, Stauffer J-C. Diastolic dysfunction. Prog Cardiol. 1989;2(pt 2):87–95. [Google Scholar]
- 23.Mochizuki T, Murase K, Fijiwara Y, Tanada S, Hamamoto K, Tauxe WN. Assessment of systolic thickening with thallium-201 ECG-gated single-photon emission computed tomography: a parameter for local left ventricular function. J Nucl Med. 1991;32:1496–1500. [PubMed] [Google Scholar]
- 24.De Clerk NM, Claes VA, Brustaert DL. Uniform sarcomere behavior during twitch of intact single cardiac cells. J Mol Cell Cardiol. 1984;16:735–745. doi: 10.1016/s0022-2828(84)80657-4. [DOI] [PubMed] [Google Scholar]
- 25.Krueger JW, Forletti D, Witterberg BA. Uniform sarcomere shortening behavior in isolated cardiac muscle cells. J Gen Physiol. 1980;76:587–607. doi: 10.1085/jgp.76.5.587. [DOI] [PMC free article] [PubMed] [Google Scholar]
- 26.Pinto JG, Win R. Non-uniform strain distribution in papillary muscles. Am J Physiol. 1977;233:H410–H416. doi: 10.1152/ajpheart.1977.233.3.H410. [DOI] [PubMed] [Google Scholar]
- 27.Huntsman LL, Day SR, Steward DK. Non-uniform contraction in the isolated cat papillary muscle. Am J Physiol. 1977;233:H613–H616. doi: 10.1152/ajpheart.1977.233.5.H613. [DOI] [PubMed] [Google Scholar]
- 28.Caulfield JB, Borg TK. The collagen network of the heart. Lab Invest. 1979;40:364–372. [PubMed] [Google Scholar]
- 29.Roberts CS, Roberts WC. Morphologic feature. Prog Cardiol. 1989;2(pt 2):3–32. [Google Scholar]
- 30.Tanada M, Fijiwara H, Onodera T, Wu D-J, Hamashima Y, Kawai C. Quantitative analysis of myocardial fibrosis in normals, hypertensive hearts, and hypertrophic cardiomyopathy. Br Heart J. 1986;55:575–581. doi: 10.1136/hrt.55.6.575. [DOI] [PMC free article] [PubMed] [Google Scholar]
- 31.Factor SM, Butany J, Sole MJ, Wigle ED, Williams WC, Rojkind M. Pathologic fibrosis and matrix connective tissue in the subaortic myocardium of patients with hypertrophic cardiomyopathy. J Am Coll Cardiol. 1991;17:1343–1351. doi: 10.1016/s0735-1097(10)80145-7. [DOI] [PubMed] [Google Scholar]
- 32.Kuribayashi T, Roberts WC. Myocardial disarray at junction of ventricular septum and left and right ventricular free walls in hypertrophic cardiomyopathy. Am J Cardiol. 1992;70:1333–1340. doi: 10.1016/0002-9149(92)90771-p. [DOI] [PubMed] [Google Scholar]
- 33.Tanada M, Fijiwara H, Onodera T, Wu D-J, Matsuda M, Hamashima Y, Kawai C. Quantitative analysis of narrowing of intramyocardial small arteries in normal hearts, hypertensive hearts, and hearts with hypertrophic cardiomyopathy. Circulation. 1987;75:1130–1139. doi: 10.1161/01.cir.75.6.1130. [DOI] [PubMed] [Google Scholar]
- 34.Maron BJ, Wolfson JK, Epstein SE, Roberts WC. Intramural (‘smallvessel’) coronary arterydisease in hypertrophic cardiomyopathy. J Am Coll Cardiol. 1986;8:545–557. doi: 10.1016/s0735-1097(86)80181-4. [DOI] [PubMed] [Google Scholar]
- 35.Breisch EA, Houser SR, Carey RA, Spann JF, Bove AA. Myocardial blood flow and capillary density in chronic pressure overload of the feline left ventricle. Cardiovasc Res. 1980;14:469–475. doi: 10.1093/cvr/14.8.469. [DOI] [PubMed] [Google Scholar]
- 36.Cannon RO, Rosing DR, Maron BJ, Leon MB, Bonow RO, Watson RM, Epstein SE. Myocardial ischemia in patients with hypertrophic cardiomyopathy: contribution of inadequate vasodilator reserve and elevated left ventricular filling pressure. Circulation. 1985;71:234–243. doi: 10.1161/01.cir.71.2.234. [DOI] [PubMed] [Google Scholar]
- 37.Rogers WJ, Shapiro EP, Weiss JL, Buchaalter MB, Rademakers FE, Weisfeldt ML, Zerhouni EA. Quantification of and correction for left ventricular systolic long-axis shortening by magnetic resonance tissue tagging and slice isolation. Circulation. 1991;84:721–731. doi: 10.1161/01.cir.84.2.721. [DOI] [PubMed] [Google Scholar]
- 38.Hoffman EA, Gupta KB, Bogdan AA, Fellows KE. Through plane motion and the assessment of LV short axis mechanics. FASEB J. 1992;6:A1232. Abstract. [Google Scholar]
- 39.Wigle ED, Sasson Z, Henderson MA, Ruddy TD, Fulop J, Rakowski H, Williams WG. Hypertrophic cardiomyopathy: the importance of the site and the extent of hypertrophy. A review . Prog Cardiovasc Dis. 1985;28:1–83. doi: 10.1016/0033-0620(85)90024-6. [DOI] [PubMed] [Google Scholar]
- 40.Hittinger L, Shen Y-T, Patrick SA, Haseba N, Komamura K, Ihara T, Manders WT, Vatner SF. Mechanisms of subendocardial dysfunction in response to exercise in dogs with severe left ventricular hypertrophy. Circ Res. 1992;71:423–434. doi: 10.1161/01.res.71.2.423. [DOI] [PubMed] [Google Scholar]


