

Abstract
To test the hypothesis that alterations in electrical activation sequence contribute to depressed systolic function in the infarct border zone, we examined the anatomic correlation of abnormal electromechanics and infarct geometry in the canine post-myocardial infarction (MI) heart, using a high-resolution MR-based cardiac electromechanical mapping technique. Three to eight weeks after an MI was created in six dogs, a 247-electrode epicardial sock was placed over the ventricular epicardium under thoracotomy. MI location and geometry were evaluated with delayed hyperenhancement MRI. Three-dimensional systolic strains in epicardial and endocardial layers were measured in five short-axis slices with motion-tracking MRI (displacement encoding with stimulated echoes). Epicardial electrical activation was determined from sock recordings immediately before and after the MR scans. The electrodes and MR images were spatially registered to create a total of 160 nodes per heart that contained mechanical, transmural infarct extent, and electrical data. The average depth of the infarct was 55% (SD 11), and the infarct covered 28% (SD 6) of the left ventricular mass. Significantly delayed activation (>mean + 2SD) was observed within the infarct zone. The strain map showed abnormal mechanics, including abnormal stretch and loss of the transmural gradient of radial, circumferential, and longitudinal strains, in the region extending far beyond the infarct zone. We conclude that the border zone is characterized by abnormal mechanics directly coupled with normal electrical depolarization. This indicates that impaired function in the border zone is not contributed by electrical factors but results from mechanical interaction between ischemic and normal myocardium.
Keywords: electromechanical mapping, magnetic resonance imaging
Depressed systolic function in the ischemic border zone with normal perfusion has been recognized for several decades (23). The presence of hypocontractile border zone myocardium has consistently been substantiated by a variety of modalities, including echocardiography (19, 28), radiopaque bead arrays (30, 36), and, most recently, MRI (8, 15, 16, 26). The abnormal mechanics of the border zone is clinically important because it may negatively affect ventricular remodeling and hypertrophy (4, 20).
The mechanism underlying the depressed function in the border zone has been explained primarily by mechanical factors. Most investigators have concluded that it results from mechanical interactions, or tethering, between normal and ischemic myocardium (10, 11, 28, 30, 34, 36). However, the abnormal mechanics in the border zone may also involve a contribution of abnormal electrical activation. For example, the timing of electrical activation in the border zone may be delayed by abnormal electrical sequence in the infarct zone and depressed shortening, or relative stretch, in the border zone. A relative delay in electrical activation may augment the depressed function in the border zone, because the myofiber in the border zone has to contract against a higher afterload generated by earlier shortening of remote nonischemic zones.
We hypothesized that alterations in electrical activation sequence contribute to depressed systolic function in the infarct border zone. To test this hypothesis, we qualitatively and quantitatively examined the anatomic correlation of abnormal electromechanics with reference to infarct geometry in a canine model of chronic myocardial infarction (MI). A high-resolution cardiac electromechanical mapping technique developed in our laboratory (9) allowed acquisition of anatomic, electrical, and mechanical data with high precision in a near-simultaneous fashion.
MATERIALS AND METHODS
All animal protocols were reviewed and approved by the Animal Care and Use Committee of the National Heart, Lung, and Blood Institute.
Surgical procedures
Six adult mongrel dogs (18–28 kg) were anesthetized with intravenous thiopental sodium (10–20 mg/kg), intubated, and mechanically ventilated with a mixture of oxygen, medical air, and isoflurane (1–3%). An 8-Fr arterial introducer was placed in the left carotid artery through a skin cutdown (1–2 in.) under sterile conditions. The surface ECG and the arterial pressure were recorded throughout the procedure. A bolus intravenous injection of 1,000 IU of heparin and 40 mg of lidocaine was administered, followed by a continuous intravenous infusion of lidocaine (110 mg/h) for the entire procedure. A 6-Fr guiding catheter was advanced though the introducer to the left coronary ostium under fluoroscopic guidance, and a balloon angioplasty catheter was advanced to the left anterior descending coronary artery (LAD) through the guiding catheter over a guide wire (0.014 in.). The LAD was then occluded at its origin by inflating the balloon. Myocardial ischemia was confirmed with ST-T changes on ECG and transient decrease in arterial blood pressure upon balloon inflation. The balloon occlusion was maintained for a total of 120 min. Another bolus intravenous injection of 40 mg of lidocaine was given 15 min before reperfusion to avoid serious ventricular arrhythmia. All animals showed frequent ventricular ectopic beats after reperfusion. The catheters and the introducer were removed, and the surgical wound was closed. The surface ECG was recorded three or four times per day for the first 48–72 h to monitor the baseline rhythm.
Three to eight weeks after MI, the animal underwent a median sternotomy under general anesthesia. The heart was placed in a pericardial cradle, and a multielectrode epicardial sock consisting of a nylon mesh fitted with 247 silver electrodes attached in an ordered fashion was placed over the ventricular epicardium, as described previously (9). The sock was placed in a consistent and predetermined orientation for all experiments and secured with several sutures. Ten to fifteen 4-mm-diameter glass beads (18 μl) filled with an aqueous solution of gadopentetate dimeglumine (Gd-DTPA, 5 mM) were attached to the sock as markers for registering mechanical and electrical data. An MR-compatible pressure micromanometer catheter (SPC-350, 5 Fr, Millar) was advanced under fluoroscopic guidance to the left ventricular (LV) cavity through a 6-Fr arterial introducer placed in the right carotid artery. A ground reference electrode was sewn onto the fat pad at the aortic root. All sock wires were run directly out of the chest, and the animal was transported to the MR scanner.
Data acquisition
MR scanning was performed in a 1.5-T scanner (Siemens Sonata). LV geometry (LV end-diastolic and end-systolic volumes) and function (LV stroke volume and ejection fraction) were evaluated with a cine true fast imaging with steady state precession sequence [bandwidth (BW) ± 1,395 Hz/pixel, echo time (TE) and repetition time (TR) 1.9 and 3.7 ms, readout flip angle 50°, field of view (FOV) 225 × 300 mm, image matrix 192 × 256, spatial resolution 1.2 × 1.2 × 6.0 mm, 8–10 slices without a gap]. MI geometry was evaluated with a phase-sensitive delayed hyperenhancement (DHE) inversion recovery sequence (22) 10–30 min after an intravenous injection of a contrast agent (Gd-DTPA, Berlex Magnevist) at 0.25 mmol/kg (BW ±140 Hz/pixel, TE and TR 3.9 and 8 ms, turbo flash with readout flip angle 30°, FOV 119 × 200 mm, image matrix 122 × 256, spatial resolution 1.0 × 0.8 × 3.0 mm, readout at late diastole, 13 views per segment, 20–25 slices without a gap). For these two sequences, LV short-axis image slices from LV apex to base were acquired in a consistent manner based on predetermined anatomic landmarks without gaps between slices. Each image acquisition was ECG gated, and the image was acquired during a single breath hold (30–40 s) by manually holding mechanical ventilation at end expiration. Three-dimensional (3D) displacement fields were calculated, measured in five short-axis slices with a motion tracking sequence [displacement encoding with stimulated echoes (DENSE); BW ±1,000 Hz/pixel, TE and TR 1.55 and 3.1 ms, 15° readout flip angle, FOV 175 × 350 mm, image matrix 128 × 256, spatial resolution 1.36 × 1.36 × 8.0 mm] (2). To spatially register the displacement fields with the MI geometry, encoding and readout of the DENSE sequence were set at end systole and end diastole, respectively. The timing of end systole and end diastole was determined from the cine images.
The epicardial sock electrical recording system in the MR scanner room was described previously (9). Briefly, all 247 electrodes were radio frequency filtered at the MR scanner interface, and the data from the epicardial electrodes and physiological monitoring, including LV pressure and ECG, were simultaneously acquired at a minimum sampling rate of 1,000 Hz for a duration of 10 s immediately before and after the MR scans (3). Animals were euthanized, and their hearts were scanned with a 3D spin-echo sequence to locate the glass bead markers (BW ±130 Hz/pixel, TE and TR 12 and 148 ms, FOV 256 × 256 × 88 mm, image matrix 256 × 256 × 88, spatial resolution 1.0 × 1.0 × 1.0 mm). After excision, the heart was filled with vinyl polysiloxane, maintaining end-diastolic shape, and the locations of electrodes and beads were digitized (Microscribe 3DLX, Immersion, San Jose, CA) (9, 27).
Data analysis
The LV myocardium was manually segmented in the DENSE images. The 3D end-diastolic configuration and the 3D displacement of the tissue in each pixel were measured (1). The end-systolic configuration was calculated from the displacement vector field and the end-diastolic configuration. The Lagrangian Green's strain tensor E was calculated in every tetrahedron of adjacent four pixels in the LV myocardium as 0.5(FTF − I), where F is the deformation gradient tensor, FT is the transpose of F, and I is the identity matrix. The reference and deformed states were defined as end-diastolic and end-systolic configurations, respectively. Three independent finite strains (Err, Ecc, and Ell) were computed in the local cardiac coordinate system with reference to the center of mass of each short-axis LV myocardium image (32). Err, Ecc, and Ell reflect myocardial stretch or shortening along the radial (Err), circumferential (Ecc), and longitudinal (Ell) cardiac axes, respectively. The LV circumference was divided into 32 sectors and 2 layers (endocardium and epicardium), and average strain values were calculated in each sector.
In the DHE images, MI geometry and endocardial and epicardial borders were manually segmented (31). As in the strain map, the LV circumference was divided into 32 sectors, and the average transmural depth of MI was calculated in each sector. The values were linearly interpolated to determine the MI depth at the DENSE image slice positions.
Electrical signals from the 247-lead sock electrodes were averaged over ∼20 consecutive heartbeats. The local depolarization time at each electrode was defined as the peak negative rate of voltage change over time within the QRS complex (25). The time reference for the local depolarization times was the earliest ventricular depolarization time in each heart. Delayed electrical activation was defined as electrical activation time exceeding the mean + 2SD of activation times of all the nodes. Electrical maps were spatially referenced to the strain and MI geometry maps with the least-squares fit of glass marker beads (9, 27). The electrical activation time in each of the 32 sectors was calculated as the weighted average of the electrical activation time at three adjacent electrodes (Fig. 1). In essence, the electrical activation at 160 (=32 sectors × 5 slices) nodes was calculated from those at the 247 original sock electrodes. A total of 160 nodes that contained mechanical, infarct extent, and electrical data was measured. At the mid-LV level, each sector corresponded to approximate 3D dimensions of 6 mm (circumferential), 6 mm (longitudinal), and 10 mm (radial). The infarct zone was defined as the sectors including MI. The border zone was defined as the sectors immediately adjacent to the infarct zone, and the remote zone was defined as the sectors opposite to the infarct zone in the short-axis images. Division of the LV circumference into 32 sectors was chosen to create nodes with sufficiently high spatial resolution that would robustly detect the depressed function at the border zone, the width of which is reported to be <10 mm (10, 11, 28, 33, 34, 36).
Fig. 1.
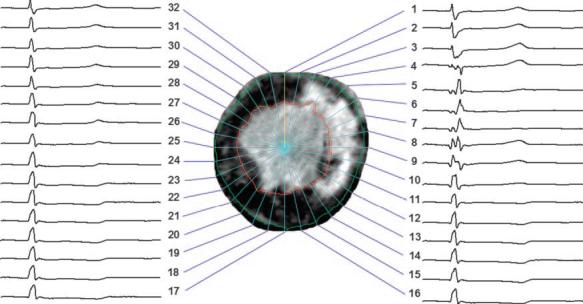
Epicardial electrical signals during a cardiac cycle (cycle length = 544 ms, heart rate = 110 beats/min) registered to a short-axis delayed hyperenhancement (DHE) MR image of the left ventricle (LV) split into 32 sectors. Regions of bright intensity correspond to myocardial infarction (MI). In this image, abnormal or delayed activation is seen in sectors 4 through 9, whereas the infarct ranges from sector 3 through sector 14.
Statistical analysis
Values are means (SD) unless otherwise specified (5). A paired t-test was used to compare electrical and mechanical parameters. Statistics were performed with SigmaStat 3.0 (SPSS, Chicago, IL).
RESULTS
All animals went into intermittent ventricular tachycardia 24 h after reperfusion, which lasted for 24– 48 h, and normal sinus rhythm resumed thereafter. The animals underwent the electromechanical data acquisition 38 days (SD 12) after MI. Hemodynamic parameters at the time of the electromechanical data acquisition are summarized in Table 1.
Table 1.
Hemodynamic data
| Heart rate, beats/min | 121 (SD 19) |
| LVPmax, mmHg | 85 (SD 16) |
| dP/dtmax, mmHg/s | 1,713 (SD 661) |
| dP/dtmin, mmHg/s | −1,515 (SD 643) |
| LVEDP, mmHg | 7 (SD 3) |
| LVEDV, ml | 40 (SD 6) |
| LVESV, ml | 23 (SD 5) |
| LVSV, ml | 17 (SD 2) |
| LVEF, % | 43 (SD 3) |
| CO, ml/min | 2,058 (SD 517) |
Values are means (SD). LVPmax, peak left ventricular (LV) pressure; dP/dtmax, peak positive change in pressure over time (dP/dt); dP/dtmin, peak negative dP/dt; LVEDP, LV end-diastolic pressure; LVESV, LV end-systolic pressure; LVSV, LV stroke volume; LVEF, LV ejection fraction; CO, cardiac output.
Infarct map
The infarct was located in the anteroseptal region and usually involved the anterolateral papillary muscle on the endocardial border (Fig. 2). The epicardial border exhibited spatially intricate structures with multiple interdigitations of viable myocardium within the infarct zone. The average depth of the infarct was 55% (SD 11), and the infarct covered 28% (SD 6) of the LV mass (Fig. 3A).
Fig. 2.
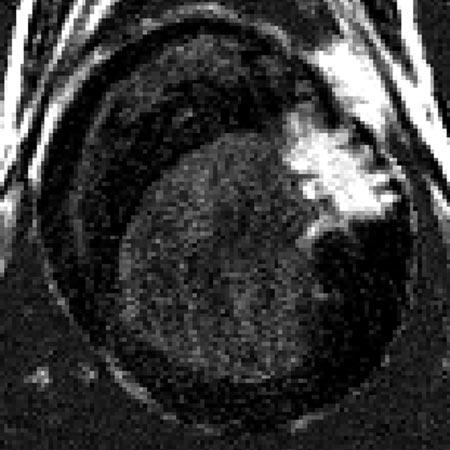
Short-axis DHE image of MI from a single animal. Regions of bright intensity correspond to MI. Note multiple interdigitations of viable myocardium within the infarct region.
Fig. 3.
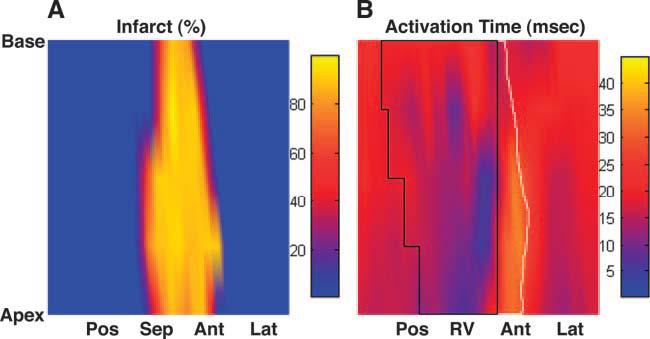
Infarct depth and electrical activation from a single animal. A: infarct map (in %depth). B: isochrone map of electrical activation time (in ms). The area circumscribed by a solid black line represents the right ventricle (RV). The area circumscribed by a solid white line represents the infarct zone in the anterior wall (the infarct zone in the septum is covered by the RV). Pos, posterior wall; Sep, septal wall; Ant, anterior wall; Lat, lateral wall.
Electrical activation map
Electrical breakthrough, or the point of the earliest activation, was located in the anterior right ventricular region. Activation time exceeding the mean + 2SD was observed in a total of 19 nodes, and these nodes were within the infarct zone (Fig. 3B). The electrical activation time was significantly increased in the infarct zone compared with that of the border zone [31 (SD 9) vs. 19 (SD 2) ms, P < 0.05; Fig. 4], whereas the electrical activation time was not significantly different between the border zone and the remote zone [19 (SD 2) vs. 21 (SD 3) ms, P = not significant (NS)].
Fig. 4.
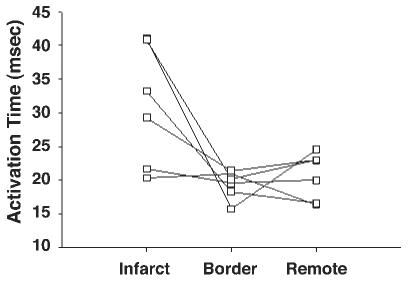
Quantitative analysis of electrical activation time in each zone (n = 6). Electrical activation time (in ms) was significantly increased in the infarct zone compared with that in the border zone [31 (SD 9) vs. 19 (SD 2) ms, P < 0.05], whereas it was not significantly different between the border zone and the remote zone [19 (SD 2) vs. 21 (SD 3) ms, P = not significant (NS)].
Strain map
A 3D displacement map from a single animal is shown in Fig. 5. Each arrow represents a displacement vector that points from the end-diastolic to the end-systolic configuration. The magnitude of displacement is color coded. It is clear that the displacement magnitude in the infarct zone in the anteroseptal wall (Fig. 5, left) is small (purple to blue) compared with that of the remote zone in the posterolateral wall (Fig. 5, right, red to yellow).
Fig. 5.
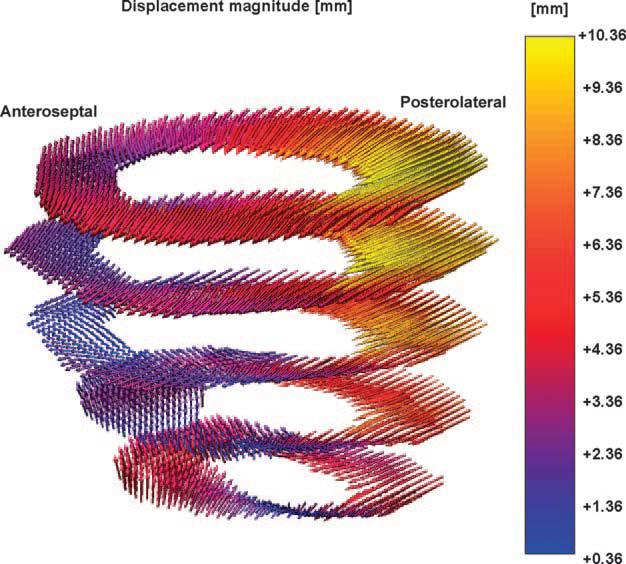
Three-dimensional (3D) displacement map from a single animal. Each arrow represents a displacement vector that points from the end-diastolic to the end-systolic configuration. The magnitude of displacement is color coded. It is clear that the displacement magnitude in the infarct zone in the anteroseptal wall (left) is small (purple to blue) compared with that of the remote zone in the posterolateral wall (right, red to yellow).
The number of strain calculation points was 3,625 per heart (SD 766), and each sector contained 11 strain points (SD 3) from which average strains were calculated. Err, Ecc, and Ell over the infarct zones were smaller in magnitude than those in the remote zones (Fig. 6). The regions of abnormal strains, particularly Ell, extended far beyond the infarct zone, and the strains were larger in the epicardium than in the endocardium. Err, Ecc, and Ell in both the infarct zone and the border zone were significantly smaller than those in the remote zone (P < 0.05), and there was no significant difference between the infarct zone and the border zone (P = NS; Fig. 7). However, Err, Ecc and Ell in the border zone were more heterogeneous than those in the infarct and remote zones. For example, two animals showed positive Ecc in the border zone, which indicates that the myocardium in the border zone underwent a paradoxical systolic stretch in the circumferential direction. Similarly, three animals showed large positive Ell in the border zone, which suggests that the border myocardium was also stretched in the longitudinal direction during active contraction (Fig. 7). There was a significant transmural gradient between the epicardium and endocardium in Err, Ecc, and Ell in the remote zone (P < 0.05), and the transmural gradient was lost in both the infarct zone and the border zone.
Fig. 6.
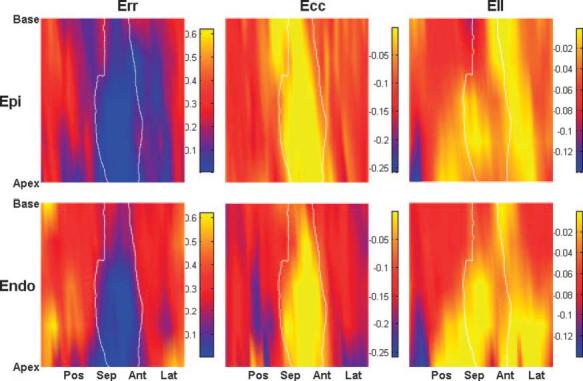
3D strain map from a single animal. The area circumscribed by a solid white line represents the infarct zone. Radial (Err), circumferential (Ecc), and longitudinal (Ell) strains are shown. The regions of abnormal strains, particularly Ell, extended far beyond the infarct zone, and the strains were larger in the epicardium than in the endocardium. Epi, epicardial layer; Endo, endocardial layer.
Fig. 7.
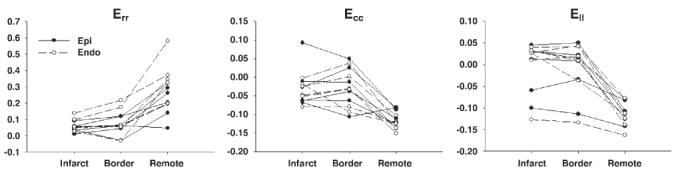
Quantitative analysis of finite strain in each zone (n = 6). Err, Ecc, and Ell in both the infarct zone and the border zone were significantly smaller than those in the remote zone (P < 0.05), and there was no significant difference between the infarct zone and the border zone (P = NS). There was a significant transmural gradient between the epicardium and endocardium in Err, Ecc, and Ell in the remote zone (P < 0.05), and the transmural gradient was lost in both the infarct zone and the border zone.
In summary, the infarct zone was characterized by delayed electrical activation and abnormal mechanics, including loss of transmural gradient and reduction of strain magnitude or abnormal stretch. In the border zone, abnormal mechanics similar to that of the infarct zone was observed; however, the electrical activation time was not different from that of the remote zone.
DISCUSSION
To examine the electrical activation in the infarct border zone with depressed systolic function in chronic MI, the present study combined epicardial electrical recording and high-resolution MR-based imaging techniques to examine the anatomic correlation of local depolarization, myocardial scar, and systolic deformation of the heart.
Impact of infarct geometry on electromechanical properties in infarct zone
Recent studies have demonstrated that the DHE MRI technique allows accurate assessment of infarct extent and geometry. The spatial extent of DHE was the same as that of myocyte necrosis shown by triphenyltetrazolium chloride-stained pathology, independent of wall motion and infarct age (24), and the clinical reproducibility of DHE for determination of infarct size and distribution is highly comparable to that of routine clinical single-photon-emission computed tomography (SPECT) (29). In addition, DHE is superior to SPECT in detection of subendocardial infarcts (37).
Our high-resolution DHE MRI results show that the infarct geometry on the border is highly complex (Fig. 2). The infarct was mostly nontransmural, and the infarct size was ∼30% of the LV; both observations are consistent with previous studies using a similar occlusion-reperfusion infarct canine model (7, 12, 13, 21, 38). Traditionally, the infarct zone has been associated with delayed electrical activation and slow conduction velocity (6, 7, 14, 35). As a result of the relatively small size and nontransmural geometry of the infarct, we observed delayed electrical activation in a limited region of the infarct zone (Fig. 3). The nontransmural geometry of the infarct in this model is due not only to reperfusion but also to rich collateral circulation intrinsic to the canine heart, compared with humans and other species such as swine. Permanent coronary ligation in swine tends to result in a well-demarcated, transmural scar, whereas the canine MI model in the present study is characterized by a relatively large volume of viable myocardium over the infarct zone. Holmes et al. (18) studied systolic deformation of the infarct zone in a small region in the LV free wall by permanent occlusion of obtuse marginal branches of the left circumflex artery in swine. Despite impaired systolic shortening, they found significant systolic wall thickening (Err) still present at 3 wk, which is suggestive of passive deformation in the regions composed almost entirely of collagen (17). In contrast, our results indicate significant impairment of systolic deformation and loss of transmural gradient in Err, Ecc, and Ell, including systolic wall thickening in the infarct zone (Figs. 6 and 7). Therefore, the difference in the infarct geometry appears to account for distinct characteristics in mechanics as well as electrical activation.
Mechanism of impaired systolic function in infarct border zone
We hypothesized that impaired systolic function in the infarct border zone may be partially accounted for by delayed electrical activation. However, the electrical activation in the infarct border zone was not delayed compared with that of the remote zone (Figs. 3 and 4), whereas the systolic function of the border zone was depressed relative to that of the remote zone (Figs. 6 and 7). These findings indicate that electrical factors do not contribute to the impaired systolic function in the border zone, but the border zone dysfunction most likely results from mechanical interaction between ischemic and normal myocardium. Although the details of this interaction are not fully understood, mechanical “tethering” due to high wall stress appears to be a predominant mechanism (10, 11, 28, 30, 34, 36). In addition, recent studies have demonstrated that the LV myocardial shortening is regionally heterogeneous (39), and the timing and the peak of shortening may be controlled by nonuniform prestretch from atrial contraction via a regional Frank-Starling effect (40). Although we did not quantify prestretch during atrial contraction in the border zone because we did not examine the time course of finite strain, we speculate that a higher wall stress in the border zone may lead to a smaller diastolic prestretch, which may contribute to generating delayed and little shortening.
Of note, our high-resolution motion-tracking MRI revealed a paradoxical systolic stretch (eccentric contraction) in the border zone of some animals (Fig. 7). This systolic stretch is clinically important because it may generate a stretch-activated ectopy to trigger reentry ventricular arrhythmia in patients with ischemic heart. Whether the border zone undergoes little shortening (isometric contraction) or stretch is most likely determined by the loading conditions, the local material property during ventricular tension development, and the ventricular geometry that dynamically changes as structural remodeling progresses. Anatomy-based description of mechanics in the myofiber direction may identify the geometric and hemodynamic factors that contribute to systolic stretch in the border zone.
Limitations
In the present study, the 3D finite deformation of the LV wall was examined in open-chest, anesthetized dogs. Therefore, our results may not precisely reflect the cardiac mechanics in closed-chest, awake animals. The spatial registration error in this electromechanical mapping technique has been reported previously to be 2.1 mm on average, with a precision of marker localization in the images and on the excised heart of 1.0 and 0.7 mm, respectively (9). The temporal resolution of electrical activation was 1 ms, and this means that the temporal error was within approximately one sample point (≈1 ms). Although this mapping technique assumes that the heart is undeformed between the in situ and excised states without controlled perfusion fixation in situ, previous studies in our laboratory (9) reported high precision in registering electrode locations over the epicardial surface. Because of MR compatibility issues, the electrical mapping in this study was limited to the epicardium. At present, commercially available basket catheters contain ferromagnetic material and would severely degrade image quality. Clinical applicability of this technique to the study of cardiac electromechanics may be limited by surgical intervention and mechanical restriction from the sock. Because of a highly elastic property of the sock material, we anticipate that its mechanical restriction on the heart was minimal, although we have not yet quantified this effect.
In conclusion, using a high-resolution electromechanical mapping system, we have demonstrated that abnormal electrical activation is observed in a limited region in the infarct zone, whereas the region of abnormal mechanics extends far beyond the infarct zone in chronic MI. The infarct border zone is characterized by abnormal mechanics directly coupled with normal electrical depolarization. These findings indicate that electrical factors do not contribute to the impaired systolic function in the border zone, but the border zone dysfunction most likely results from mechanical interaction between ischemic and normal myocardium.
ACKNOWLEDGMENTS
We thank Michael Nauman, Reza Nezafat, Luis Gutierrez, Owen Faris, Frank Evans, Eric Bennett, Izlem Izbudak, and Dara Kraitchman for superb technical assistance. We also thank Jayne Davis and Rob MacLeod at Nora Eccles Harrison Cardiovascular Research and Training Institute for help with sock electrodes and electrical mapping. We also thank Matthew McAuliffe and Benjamin Link for technical assistance with image analysis. We acknowledge the surgery staff of the Laboratory of Animal Medicine and Surgery for excellent assistance throughout the animal studies: Dr. Robert F. Hoyt, Jr., Randy Clevenger, Dave Caden, Arthur Zetts, Kenneth Jeffries, Gayle Zywicke, Karen Keeran, and Shawn Kozlov. Finally, we acknowledge the excellent surgical assistance of our staff, Joni Taylor, Katie Hope, and Kathy Lucas.
GRANTS
This research was supported by the National Institutes of Health intramural research project Z01HL-004609 (to E. R. McVeigh).
REFERENCES
- 1.Aletras AH, Ding S, Balaban RS, Wen H. DENSE: displacement encoding with stimulated echoes in cardiac functional MRI. J Magn Reson. 1999;137:247–252. doi: 10.1006/jmre.1998.1676. [DOI] [PMC free article] [PubMed] [Google Scholar]
- 2.Aletras AH, Wen H. Mixed echo train acquisition displacement encoding with stimulated echoes: an optimized DENSE method for in vivo functional imaging of the human heart. Magn Reson Med. 2001;46:523–534. doi: 10.1002/mrm.1223. [DOI] [PMC free article] [PubMed] [Google Scholar]
- 3.Barr RC, Spach MS. Sampling rates required for digital recording of intracellular and extracellular cardiac potentials. Circulation. 1977;55:40–48. doi: 10.1161/01.cir.55.1.40. [DOI] [PubMed] [Google Scholar]
- 4.Cohn JN. Post-MI remodeling. Clin Cardiol. 1993;16:II21–II24. doi: 10.1002/clc.4960161406. [DOI] [PubMed] [Google Scholar]
- 5.Curran-Everett D, Benos D. Guidelines for reporting statistics in journals published by the American Physiological Society. Am J Physiol Heart Circ Physiol. 2004;287:H447–H449. doi: 10.1152/physiolgenomics.00155.2004. [DOI] [PubMed] [Google Scholar]
- 6.Daniel TM, Boineau JP, Sabiston DC., Jr Comparison of human ventricular activation with a canine model in chronic myocardial infarction. Circulation. 1971;44:74–89. doi: 10.1161/01.cir.44.1.74. [DOI] [PubMed] [Google Scholar]
- 7.Duff HJ, Martin JM, Rahmberg M. Time-dependent change in electrophysiologic milieu after myocardial infarction in conscious dogs. Circulation. 1988;77:209–220. doi: 10.1161/01.cir.77.1.209. [DOI] [PubMed] [Google Scholar]
- 8.Epstein FH, Yang Z, Gilson WD, Berr SS, Kramer CM, French BA. MR tagging early after myocardial infarction in mice demonstrates contractile dysfunction in adjacent and remote regions. Magn Reson Med. 2002;48:399–403. doi: 10.1002/mrm.10210. [DOI] [PubMed] [Google Scholar]
- 9.Faris OP, Evans FJ, Ennis DB, Helm PA, Taylor JL, Chesnick AS, Guttman MA, Ozturk C, McVeigh ER. Novel technique for cardiac electromechanical mapping with magnetic resonance imaging tagging and an epicardial electrode sock. Ann Biomed Eng. 2003;31:430–440. doi: 10.1114/1.1560618. [DOI] [PMC free article] [PubMed] [Google Scholar]
- 10.Gallagher KP, Gerren RA, Choy M, Stirling MC, Dysko RC. Subendocardial segment length shortening at lateral margins of ischemic myocardium in dogs. Am J Physiol Heart Circ Physiol. 1987;253:H826–H837. doi: 10.1152/ajpheart.1987.253.4.H826. [DOI] [PubMed] [Google Scholar]
- 11.Gallagher KP, Gerren RA, Stirling MC, Choy M, Dysko RC, McManimon SP, Dunham WR. The distribution of functional impairment across the lateral border of acutely ischemic myocardium. Circ Res. 1986;58:570–583. doi: 10.1161/01.res.58.4.570. [DOI] [PubMed] [Google Scholar]
- 12.Gang ES, Bigger JT, Jr, Livelli FD., Jr A model of chronic ischemic arrhythmias: the relation between electrically inducible ventricular tachycardia, ventricular fibrillation threshold and myocardial infarct size. Am J Cardiol. 1982;50:469–477. doi: 10.1016/0002-9149(82)90311-3. [DOI] [PubMed] [Google Scholar]
- 13.Gang ES, Bigger JT, Jr, Uhl EW. Effects of timolol and propranolol on inducible sustained ventricular tachyarrhythmias in dogs with subacute myocardial infarction. Am J Cardiol. 1984;53:275–281. doi: 10.1016/0002-9149(84)90439-9. [DOI] [PubMed] [Google Scholar]
- 14.Gardner PI, Ursell PC, Fenoglio JJ, Jr, Wit AL. Electrophysiologic and anatomic basis for fractionated electrograms recorded from healed myocardial infarcts. Circulation. 1985;72:596–611. doi: 10.1161/01.cir.72.3.596. [DOI] [PubMed] [Google Scholar]
- 15.Garot J, Lima JA, Gerber BL, Sampath S, Wu KC, Bluemke DA, Prince JL, Osman NF. Spatially resolved imaging of myocardial function with strain-encoded MR: comparison with delayed contrast-enhanced MR imaging after myocardial infarction. Radiology. 2004;233:596–602. doi: 10.1148/radiol.2332031676. [DOI] [PubMed] [Google Scholar]
- 16.Gilson WD, Yang Z, French BA, Epstein FH. Measurement of myocardial mechanics in mice before and after infarction using multislice displacement-encoded MRI with 3D motion encoding. Am J Physiol Heart Circ Physiol. 2005;288:H1491–H1497. doi: 10.1152/ajpheart.00632.2004. [DOI] [PubMed] [Google Scholar]
- 17.Holmes JW, Nunez JA, Covell JW. Functional implications of myocardial scar structure. Am J Physiol Heart Circ Physiol. 1997;272:H2123–H2130. doi: 10.1152/ajpheart.1997.272.5.H2123. [DOI] [PubMed] [Google Scholar]
- 18.Holmes JW, Yamashita H, Waldman LK, Covell JW. Scar remodeling and transmural deformation after infarction in the pig. Circulation. 1994;90:411–420. doi: 10.1161/01.cir.90.1.411. [DOI] [PubMed] [Google Scholar]
- 19.Jackson BM, Gorman JH, 3rd, Salgo IS, Moainie SL, Plappert T, John-Sutton M, Edmunds LH, Jr, Gorman RC. Border zone geometry increases wall stress after myocardial infarction: contrast echo-cardiographic assessment. Am J Physiol Heart Circ Physiol. 2003;284:H475–H479. doi: 10.1152/ajpheart.00360.2002. [DOI] [PubMed] [Google Scholar]
- 20.Jackson BM, Gorman JH, Moainie SL, Guy TS, Narula N, Narula J, John-Sutton MG, Edmunds LH, Jr, Gorman RC. Extension of borderzone myocardium in postinfarction dilated cardiomyopathy. J Am Coll Cardiol. 2002;40:1160–1171. doi: 10.1016/s0735-1097(02)02121-6. [DOI] [PubMed] [Google Scholar]
- 21.Karagueuzian HS, Fenoglio JJ, Jr, Weiss MB, Wit AL. Protracted ventricular tachycardia induced by premature stimulation of the canine heart after coronary artery occlusion and reperfusion. Circ Res. 1979;44:833–846. doi: 10.1161/01.res.44.6.833. [DOI] [PubMed] [Google Scholar]
- 22.Kellman P, Arai AE, McVeigh ER, Aletras AH. Phase-sensitive inversion recovery for detecting myocardial infarction using gadolinium-delayed hyperenhancement. Magn Reson Med. 2002;47:372–383. doi: 10.1002/mrm.10051. [DOI] [PMC free article] [PubMed] [Google Scholar]
- 23.Kerber RE, Marcus ML, Ehrhardt J, Wilson R, Abboud FM. Correlation between echocardiographically demonstrated segmental dyskinesis and regional myocardial perfusion. Circulation. 1975;52:1097–1104. doi: 10.1161/01.cir.52.6.1097. [DOI] [PubMed] [Google Scholar]
- 24.Kim RJ, Fieno DS, Parrish TB, Harris K, Chen EL, Simonetti O, Bundy J, Finn JP, Klocke FJ, Judd RM. Relationship of MRI delayed contrast enhancement to irreversible injury, infarct age, and contractile function. Circulation. 1001999:1992–2002. doi: 10.1161/01.cir.100.19.1992. [DOI] [PubMed] [Google Scholar]
- 25.Klein GJ, Ideker RE, Smith WM, Harrison LA, Kasell J, Wallace AG, Gallagher JJ. Epicardial mapping of the onset of ventricular tachycardia initiated by programmed stimulation in the canine heart with chronic infarction. Circulation. 1979;60:1375–1384. doi: 10.1161/01.cir.60.6.1375. [DOI] [PubMed] [Google Scholar]
- 26.Kramer CM, Lima JA, Reichek N, Ferrari VA, Llaneras MR, Palmon LC, Yeh IT, Tallant B, Axel L. Regional differences in function within noninfarcted myocardium during left ventricular remodeling. Circulation. 1993;88:1279–1288. doi: 10.1161/01.cir.88.3.1279. [DOI] [PubMed] [Google Scholar]
- 27.Leclercq C, Faris O, Tunin R, Johnson J, Kato R, Evans F, Spinelli J, Halperin H, McVeigh E, Kass DA. Systolic improvement and mechanical resynchronization does not require electrical synchrony in the dilated failing heart with left bundle-branch block. Circulation. 2002;106:1760–1763. doi: 10.1161/01.cir.0000035037.11968.5c. [DOI] [PubMed] [Google Scholar]
- 28.Lima JA, Becker LC, Melin JA, Lima S, Kallman CA, Weisfeldt ML, Weiss JL. Impaired thickening of nonischemic myocardium during acute regional ischemia in the dog. Circulation. 1985;71:1048–1059. doi: 10.1161/01.cir.71.5.1048. [DOI] [PubMed] [Google Scholar]
- 29.Mahrholdt H, Wagner A, Holly TA, Elliott MD, Bonow RO, Kim RJ, Judd RM. Reproducibility of chronic infarct size measurement by contrast-enhanced magnetic resonance imaging. Circulation. 2002;106:2322–2327. doi: 10.1161/01.cir.0000036368.63317.1c. [DOI] [PubMed] [Google Scholar]
- 30.Mazhari R, Omens JH, Covell JW, McCulloch AD. Structural basis of regional dysfunction in acutely ischemic myocardium. Cardiovasc Res. 2000;47:284–293. doi: 10.1016/s0008-6363(00)00089-4. [DOI] [PubMed] [Google Scholar]
- 31.McAuliffe MJ, Lalonde FM, McGarry D, Gandler W, Csaky K, Trus BL. 14th IEEE Symposium on Computer-Based Medical Systems (CBMS '01) IEEE; Washington, DC: 2001. Medical image processing, analysis & visualization in clinical research; pp. 381–386. [Google Scholar]
- 32.Meier GD, Ziskin MC, Santamore WP, Bove AA. Kinematics of the beating heart. IEEE Trans Biomed Eng. 1980;27:319–329. doi: 10.1109/TBME.1980.326740. [DOI] [PubMed] [Google Scholar]
- 33.Prinzen FW, Arts T, Hoeks AP, Reneman RS. Discrepancies between myocardial blood flow and fiber shortening in the ischemic border zone as assessed with video mapping of epicardial deformation. Pflügers Arch. 1989;415:220–229. doi: 10.1007/BF00370596. [DOI] [PubMed] [Google Scholar]
- 34.Sakai K, Watanabe K, Millard RW. Defining the mechanical border zone: a study in the pig heart. Am J Physiol Heart Circ Physiol. 1985;249:H88–H94. doi: 10.1152/ajpheart.1985.249.1.H88. [DOI] [PubMed] [Google Scholar]
- 35.Ursell PC, Gardner PI, Albala A, Fenoglio JJ, Jr, Wit AL. Structural and electrophysiological changes in the epicardial border zone of canine myocardial infarcts during infarct healing. Circ Res. 1985;56:436–451. doi: 10.1161/01.res.56.3.436. [DOI] [PubMed] [Google Scholar]
- 36.Van Leuven SL, Waldman LK, McCulloch AD, Covell JW. Gradients of epicardial strain across the perfusion boundary during acute myocardial ischemia. Am J Physiol Heart Circ Physiol. 1994;267:H2348–H2362. doi: 10.1152/ajpheart.1994.267.6.H2348. [DOI] [PubMed] [Google Scholar]
- 37.Wagner A, Mahrholdt H, Holly TA, Elliott MD, Regenfus M, Parker M, Klocke FJ, Bonow RO, Kim RJ, Judd RM. Contrast-enhanced MRI and routine single photon emission computed tomography (SPECT) perfusion imaging for detection of subendocardial myocardial infarcts: an imaging study. Lancet. 2003;361:374–379. doi: 10.1016/S0140-6736(03)12389-6. [DOI] [PubMed] [Google Scholar]
- 38.Wetstein L, Mark R, Kaplinsky E, Mitamura H, Kaplan A, Sauermelch C, Michelson EL. Histopathologic factors conducive to experimental ventricular tachycardia. Surgery. 1985;98:532–539. [PubMed] [Google Scholar]
- 39.Zwanenburg JJ, Gotte MJ, Kuijer JP, Heethaar RM, van Rossum AC, Marcus JT. Timing of cardiac contraction in humans mapped by high-temporal-resolution MRI tagging: early onset and late peak of shortening in lateral wall. Am J Physiol Heart Circ Physiol. 2004;286:H1872–H1880. doi: 10.1152/ajpheart.01047.2003. [DOI] [PubMed] [Google Scholar]
- 40.Zwanenburg JJ, Gotte MJ, Kuijer JP, Hofman MB, Knaapen P, Heethaar RM, van Rossum AC, Marcus JT. Regional timing of myocardial shortening is related to prestretch from atrial contraction: assessment by high temporal resolution MRI tagging in humans. Am J Physiol Heart Circ Physiol. 2005;288:H787–H794. doi: 10.1152/ajpheart.00610.2004. [DOI] [PubMed] [Google Scholar]