

Abstract
The position of a poly(A) site of eukaryotic mRNA is determined by sequence signals in pre-mRNA and a group of polyadenylation factors. To reveal rice poly(A) signals at a genome level, we constructed a dataset of 55 742 authenticated poly(A) sites and characterized the poly(A) signals. This resulted in identifying the typical tripartite cis-elements, including FUE, NUE and CE, as previously observed in Arabidopsis. The average size of the 3′-UTR was 289 nucleotides. When mapped to the genome, however, 15% of these poly(A) sites were found to be located in the currently annotated intergenic regions. Moreover, an extensive alternative polyadenylation profile was evident where 50% of the genes analyzed had more than one unique poly(A) site (excluding microheterogeneity sites), and 13% had four or more poly(A) sites. About 4% of the analyzed genes possessed alternative poly(A) sites at their introns, 5′-UTRs, or protein coding regions. The authenticity of these alternative poly(A) sites was partially confirmed using MPSS data. Analysis of nucleotide profile and signal patterns indicated that there may be a different set of poly(A) signals for those poly(A) sites found in the coding regions. Based on the features of rice poly(A) signals, an updated algorithm termed PASS-Rice was designed to predict poly(A) sites.
INTRODUCTION
During gene expression in eukaryotes, one of the mRNA processing steps is 3′-end formation, which includes cleavage and addition of a polyadenine tract [poly(A)] to the newly formed end. This polyadenylation process is tightly associated with transcription termination (1,2), and the poly(A) tail is crucial for the mRNA's functions because it serves multiple facets of common cellular functions. These functions include transport of mRNA from nucleus into cytoplasm, enhancement of mRNA stability and regulation of mRNA translation (1,2). Previous studies show that sequence signals on pre-mRNA determine the specific position of the poly(A) site as well as the processing efficiency. In vertebrate cells, there are three elements defined as the core polyadenylation signal in the 3′ untranslated region (UTR) of pre-mRNA: the highly conserved AAUAAA, about 10–30 nt upstream of the cleavage site, and a downstream U- or GU-rich element (2–5). A less conserved third element of the form UGUA at variable distances upstream of the cleavage sites has also been shown to potentially play a role, particularly in those genes that do not have AAUAAA (6). In yeast, however, poly(A) signals are different from those observed in mammals in both signal sequence patterns and organization. Specifically, the signals are less conserved, with a lack of downstream elements (2,7,8). Further studies showed that there are also two U-rich elements flanking cleavage sites in yeast (7,8).
Polyadenylation signals in plant mRNA are also less conserved than those found in mammals and therefore share some features in common with yeast (8–10). Conventional genetic mutagenesis experiments have revealed three major groups of poly(A) signals in plants: the far upstream elements (FUE), the near upstream elements (NUE, an AAUAAA-like element) and the cleavage site (CS) itself (10–12). Recent bioinformatics studies in Arabidopsis confirmed the presence of NUE and FUE. The canonical hexamer AAUAAA signal in mammals is only found in 10% of Arabidopsis transcripts (13). In addition, that study identified a new element termed the cleavage element (CE), which is an expansion of the original CS (as noted earlier) and resides on both sides of the cleavage site (13). The CE includes two U-rich regions, before and after the CS, both spanning about 10 nt. The FUE, on the other hand, spans across an approximate 125-nt region upstream of the NUE and has dominant UG-rich motifs. Genetic analyses suggest that the efficiency of polyadenylation is the result of the cooperative efforts of all elements because no single signal sequence element is sufficient for the processing (10,11). These complex patterns indicate that understanding the plant 3′-end processing mechanism requires a full elucidation of plant poly(A) signal elements, which is one of the foci of this report.
It has been documented that alternative polyadenylation (APA) plays an important role in gene expression regulation. Similar to alternative initiation and alternative splicing, APA is an important mechanism that generates the diversity of mature transcripts by producing mRNAs with different 3′-UTRs or coding regions. More than half of human genes (14) and over 25% of Arabidopsis genes (15) are estimated to have multiple poly(A) sites. Moreover, gene expression regulation through APA can result in altered 3′-UTRs, which may affect mRNA stability, translatability or ability to produce proteins (16,17). The best-known example of APA in plants occurs when the pre-mRNA, encoded by the FCA gene, undergoes APA in an intron and yields a truncated mRNA that encodes a smaller and presumably nonfunctional protein (18). The partition of this truncated mRNA and the full-length mRNA is crucial for the regulation of Arabidopsis flowering time (19). Importantly, such an APA scheme has been implicated in a number of different plant species, both dicots and monocots (18,20,21), which suggests an evolutionarily conserved mechanism for gene expression regulation. Recently, we have also demonstrated the involvement of other polyadenylation factors in the APA of FCA transcript (22). In another seemingly conserved case of APA, Tang et al. (23) described how the use of two intronic alternative poly(A) sites of a gene locus produced a shorter transcript encoding lysine-ketoglutarate reductase leading to the fine-tuning of amino acid metabolism in plants. Interestingly, if these poly(A) sites are bypassed, the same gene produces a transcript encoding a bifunctional protein in the lysine biosynthesis pathway. An Arabidopsis transcript encoding a polyadenylation factor can be alternatively processed to generate two different proteins, one being AtCPSF30, the other a potential splicing factor (24). Recently, extensive APA has also been noted in the disease resistant gene transcripts in plants (25). However, the full extent of plant APA remains unclear.
Although rice is a dominant staple food crop, its mRNA polyadenylation machinery and cis-elements are largely unknown. We are therefore interested in analyzing the polyadenylation signals as the first step in understanding this important gene expression process in rice. With the rice genome sequences being made available, it is now feasible to perform large-scale analysis on rice poly(A) signals. Recently, two groups performed analyses on rice poly(A) signals based on 12 969 and 9911 rice poly(A) sites (26,27), respectively. However, these analyses failed to address some important issues. First, the number of genes tested only accounted for less than one-third of all rice genes in both cases. Second, Lu et al. (27) only tested 40 nt up- and down-stream of the poly(A) sites, which was too narrow to include all poly(A) signals according to previous mutagenesis based and bioinformatics studies in plants (10,11,13). Most importantly, none of the studies analyzed APA, which, as suggested earlier, may play a crucial role in the regulation of plant expression.
Here, we present an extensive analysis of the cis-elements around rice polyadenylation sites based on a new dataset containing 55 742 unique poly(A) sites. Using the features of the rice poly(A) signals, we also build a model with which to effectively predict poly(A) sites. In the course of our work, we find that a significant number of rice genes have alternative poly(A) sites and that some of them are located in regions of the genes that could lead to production of altered transcripts and/or protein products.
MATERIALS AND METHODS
The rice 55K poly(A) site dataset and signal analysis
The sequences around rice poly(A) sites from ESTs were retrieved using the same criteria as previously described (13). Briefly, ESTs with oligo(A) stretches (8–15 nucleotides with at least 80% adenine content) were extracted and compared to the genomic DNA sequences to ensure that these oligo(A) stretches were not from the genome, which would indicate that they had been added posttranscriptionally. Internal priming contaminations were also eliminated this way. Thus, if the 10 genomic nucleotides past the cleavage site were at least 80% A, the poly(A) site candidate was excluded as a potential source of mispriming. When collecting poly(A) sites, the first adenine of the oligo(A) was generally saved as a poly(A) site nucleotide because previous biochemical and genetic evidence indicated that the first adenine is normally transcribed from DNA, and much less likely to be added posttranscriptionally (28–30). A spike of adenine at the poly(A) sites of this dataset is also seen in yeast and mammal datasets (7).
After alignment to the genome, a 300-nt sequence upstream plus a 100-nt sequence downstream were extracted for each authenticated poly(A) site. A total of 55 742 such sequences were found from about 1 156 000 rice ESTs (31), and make up the dataset called 55 K (available through our web site, www.polyA.org).
SignalSleuth, used in the studies on Arabidopsis poly(A) signals (13), was also used to perform an exhaustive search of varying size patterns within sub-regions. The output of SignalSleuth included a matrix file with the occurrence of each designated length of poly(A) signals in the entire dataset of 55 K 3′-UTR sequences. The signal patterns were sorted and ranked based on their frequency compared to the background and then used for further analysis.
Predictive modeling of poly(A) sites
A previously described algorithm, Poly(A) Site Sleuth, or PASS (32,33), was modified for use in our rice poly(A) site prediction (hereinafter termed PASS-Rice). Modification include the incorporation of the signal pattern features (NUE, FUE and CE) and the single nucleotide profile from rice 3′-UTR. The topological structure of the algorithm was based on the Generalized Hidden Markov Model (GHMM) as previously described (32). GHMM recognizes the signals from left to right and only allows the recognition of signals from the current state to the next state in one direction. A background state was added between every two signal states to represent the background sequences around the signals. In addition, a first order inhomogeneous Markov sub-model was built to characterize NUE and CS signals, which possessed relatively better conservation. Since this sub-model could then represent the interactions of NUE and CS signals, feature information could be described more clearly.
The performance of PASS-Rice was evaluated by employing two common standards, sensitivity (Sn) and specificity (Sp), as defined previously (32). The parameters of the forward–backward algorithm for the rice poly(A) site recognition system are listed in Supplementary Table S1. In the model, the size, or nucleotide length, of each signal (FUE, NUE and CE, respectively) was fixed, as shown in Supplementary Table S2. Because there is little conservation in FUE, CE-L and CE-R, we calculated the nucleotide output probability B of these signals directly in their respective regions. The NUE and CS signals are slightly more conserved; therefore, we used a subset of the first order inhomogeneous Markov model to describe the feature information of these two signals. A matrix of transition probabilities was first generated by the best signals (for NUE, the top 50 patterns were used; for CS, CA and UA, dinucleotide frequencies were used). Then, using the matrix, the nucleotide output probability of NUE and CS signals was calculated by the program automatically.
Signal logos and the calculation of percentage hits
We used the method described by Hu et al. (4) to generate sequence logos and calculate the percentage of hits. Using dynamic programming, we grouped the selected hexamers based on their distance, computed when gaps were not allowed. Then, Agnes, an agglomeration package in the R language (www.r-project.org), was used to cluster hexamers based on their dissimilarity distance. The suggested cutoff value of 2.6 was used to group them. Hexamers in the same group were further aligned by ClustalW. The length of each sequence logo was determined from the result of ClustalW, and spaces at both ends of the sequence (after alignment) were filled by nucleotides randomly selected from background sequence in the studied region. Finally, the weight of each hexamer in the group was also computed based on its frequency in each studied region, and the Web Logo Tool (34) was used to generate the final images of sequence logos.
To detect if a sequence logo was represented in the studied region, we generated a position-specific scoring matrix for each logo (4). For each position, the score S was calculated as follows: 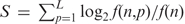 , where L is the length of the sequence logo, f(n, p) is the frequency of nucleotide n at the position p of the sequence logo and f(n) is the background frequency of occurrence of nucleotide n in a specific poly(A) region, e.g. NUE.
Finding alternative polyadenylation sites
The Build 3 rice genome sequences and corresponding annotation file were downloaded from the Annotation Dataset of The First Rice Annotation Project Meeting (RAP1) (http://rapdownload.lab.nig.ac.jp/). The rice genes were defined using the full-cDNA sequences. BLAT (35) was used to align all of the 55 K sequences to the rice genomic sequences. Each sequence was required to have at least 100 nt surrounding its poly(A) site matched to the genome, and the ones that had multiple perfect matches to the genome were eliminated from the final analysis to avoid ambiguity. Finally, a Perl script was written to read the result of BLAT and mark the positions of poly(A) sites on the annotated genome map.
RESULTS
Profile of rice 3′-UTR
The mRNA poly(A) site positions are determined by the interaction of cis-elements on the pre-mRNA and a set of polyadenylation factors. It follows that characterization of the cis-elements would lead to understanding poly(A) site selection, as well as finding the potential alternative poly(A) sites that could be used for differential gene expression. In order to study these cis-elements, we analyzed any given sequence 300 nt upstream plus 100 nt downstream for each authenticated poly(A) site in our 55 K dataset using SignalSleuth for an exhaustive pattern search (13). First, we examined the single nucleotide profile around the poly(A) sites and the 3′-UTR of all sequences in the dataset. As shown in Figure 1A, the 3′-UTR is notably rich in A and U nucleotides and has distinct A and U profiles in which the −225 to −30 region has a high U content, while the −40 to −10 region has a high A content, with a clear transition between the two regions. Previously known YA dinucleotide (Y = C or U) at the cleavage site is indicated by a sharp spike of C (position −4, 18%; −3, 21%; −2, 33%, −1, 7%), which occurs right before the poly(A) site (10). Based on previous knowledge of poly(A) signals in plants, we further profiled hexamers and octamers near rice poly(A) sites in three distinct regions. Based on nucleotide composition and signal profiling, the locations (relative to the cleavage site, the -1 position) of rice signal elements are as follows: −150 to −35 for FUE; −35 ∼ −10 for NUE and −10 ∼ +15 for CE, respectively.
Figure 1.

Single nucleotide profile comparison and the length of the 3′-UTRs of rice. (A) One nucleotide profile of the rice 3′-UTR and 100nt downstream of poly(A) sites. The regions of the poly(A) signals are shown. FUE, far upstream element; NUE, near upstream element; CE, cleavage element; CS, cleavage site or poly(A) site. The poly(A) site is at position -1. The upstream sequence (300 nt) of the poly(A) site is the minus designation, and downstream (100 nt) sequence is the plus designation. (B) One nucleotide profile of Arabidopsis 3′-UTR for comparison purposes. The arrangement is the same as in (A), and the dataset is as described (13). (C) Distribution of the 3′-UTR lengths in rice. Single sites, transcripts with only one poly(A) site found. APA, sites found in the 3′-UTR with more than one poly(A) site. Last sites, the furthest sites of the APA sites from stop codon. Total, based on all the 3′-UTR lengths. The average length of 289 nt is calculated from the total.
In comparing rice with Arabidopsis as shown in Figure 1A and B (13), we find that the general distribution pattern of nucleotides is similar, although the FUE region in rice is slightly expanded towards the coding region. The U-richness is also slightly reduced in rice as the gap between the U- and A-curves is smaller. This trend, however, is changed after the cleavage site, where the gap between U- and A-curves is wider in rice than in Arabidopsis. The U-rich sequences in the CE intersect with a region of high A and C at the cleavage site (termed CE-R and CE-L; 13). This is similar on both rice and Arabidopsis, while a slightly higher U-rich peak is seen in the latter.
To examine the length of the 3′-UTR, we calculated the distance between the annotated stop codon and the poly(A) site for each gene. As reflected in longer U- and A-curves in the FUE, the size of the 3′-UTRs in rice is also larger than that in Arabidopsis. The average length of all 3′-UTRs in rice is 289 nt and the majority of them are distributed in the range of 150 and 400 nt, and the 3′-UTR length distributions among different subsets of poly(A) sites are not significant (Figure 1C). In contrast, the average size of the Arabidopsis 3′-UTR is 223 nt, as calculated based on the 3′-UTR dataset downloaded from The Arabidopsis Information Resources (www.Arabidopsis.org).
Polyadenylation signals in rice
Based on the scanning results of SignalSleuth, the three signal elements, including FUE, NUE and CE, that are found in Arabidopsis are also identified in rice, as determined from top-ranked hexamer profiles in each section of the 3′-UTR (Figure 2). This indicates conservation between two groups of plants, dicot and monocot.
Figure 2.

Top-ranked hexamers in the rice poly(A) signal elements. (A) Hexamers from −35 to −10 in the NUE. (B) Hexamers from −10 to +15 in the CE. (C) Hexamers from −200 to −35 in the FUE. See Figure 1 legend for position annotation.
To statistically analyze the significance of the signal patterns in these polyadenylation signal elements, we applied an oligo analyzer called regulatory sequence analysis tools, or RSAT (36). The full results are listed in the Supplementary files (Table S3). Here, we present only the signals in the FUE with length 8 nt, and length 6 nt in the NUE and CE. These choices are based on our observation of the prevailing signal size in plants (32). A standard score (the Z-score) was used to measure the standard deviation of each pattern from its expected occurrence based on Markov Chain models (36). Many experimentally characterized poly(A) signals, such as AAUAAA and AUAAAA in NUE, were found on the short list according to the order of Z-scores, indicating the efficacy of such a ranking. The top signal pattern is still AAUAAA, similar to that seen in Arabidopsis (13), and it accounts for about 7% of the total poly(A) signals in NUE.
To further study the individual signals of the three signal elements, we first used a word search program developed to compare the frequency of individual signal patterns in the 3′-UTR and coding sequence. Interestingly, a motif of four nucleotides, UGUA, the most over-represented tetramer, was found at least once in 76.9% of the FUEs, which range from −125 to −30. By comparison, randomized sequences preserving the nucleotide composition (AU-richness) of the same region only yield 46.9 ± 3.1% (average calculated from testing randomized sequences 1000 times). Hence, UGUA appears 63.8% [100 × (76.9–46.9)/46.9] more frequently in the FUE than in the randomized sequences. Moreover, when compared to the region of sequences with a similar nucleotide composition (downstream of the cleavage site, +1 to +96), UGUA was only found in 41.2% of the sequences, demonstrating a significant over-representation in the FUE, where it was 86.7% [100 × (76.9–41.2)/41.2] more frequently found. This agrees with findings reported in yeast (37), where the UGUA motif was found to have high frequency in similar poly(A) signal regions. The same motif was also found in mammal genes, particularly those that lack AAUAAA in their NUEs (6).
To compile and present these results in a concise format, we use a sequence logo program (4). The primary advantage of such sequence logos is that each logo represents multiple poly(A) signals corresponding to their occurrences. This reduces the number of signal patterns and, at the same time, ensures that potentially overlapping signals, such as AAUAAA and AAAUAA, are concisely presented. The top signals were those that have a Z-score higher than 8.53, a suggested cutoff for standard hit determination [P < 0.0001; as described in (38)]. These sequence patterns were clustered to generate sequence logos according to their similarity. Figure 3 shows an example of how the sequence logos were generated in the NUE, where groups were identified according to similarities among the signal patterns. Using this method, we identified 12 major signal clusters for all three polyadenylation signal elements. Their sequence logos, the number of clustered hexamers, the top hexamers with the highest Z-scores and the frequency of occurrence in specific regions are listed in Table 1.
Figure 3.

An example (NUE) of how sequence logos were constructed. Dissimilarity distances between signals are calculated by using dynamic programming and then agglomerated by an R program. The suggested cutoff value of 2.6 was used. Hexamers in the same group were further aligned by ClustalW. The logos were generated using Web Logo tool based on ClustalW and their relative frequency in the derived region. The dotted lines indicate grouping regions.
Table 1.
Cis-elements for mRNA polyadenylation in rice
 |
aThe number of hexamers that were used to produce the logo.
bIndicate the percentage of signal patterns the logo can represent in the defined region (FUE, NUE or CE).
To compare polyadenylation signals of Arabidopsis and rice, we generated a similar set of logos (Supplementary Table S4) from the 8K dataset of Arabidopsis (13) using the same criteria as we did in rice. While comparison at such an abstract level of signal logos may be difficult, there are some obvious differences. One such difference is that a GC-rich cis-element was found in the rice FUE region (FUE.7), but not in Arabidopsis. There is only one NUE logo of Arabidopsis instead of four in rice. This may suggest that the similar NUE signals are more frequently utilized in Arabidopsis than in rice. In contrast, the CE is much less conserved in Arabidopsis, where a total of 9% of genes carry two cis-elements (compared to 67% in rice), indicating potentially less stringent CE to determine the position of poly(A) sites in Arabidopsis. The validity of these observations remains to be confirmed by other methods.
Analysis of alternative polyadenylation of rice genes
Alternative polyadenylation is an important mechanism in generating a diversity of mature transcripts. In order to study the extent of APA in rice, we first studied the overall distribution of authenticated poly(A) sites in 55K dataset. We aligned all the poly(A) sites to the full-length cDNA sequences and found that only about 50% of poly(A) sites in the 55 K dataset are located within 30 nt of annotated poly(A) sites of the rice genome Build 3 (Supplementary Table S5). We then examined the relative distance between neighboring poly(A) sites. In about 70% of these neighboring sites, at least one site was located within 30 nt of another in the same gene. The distribution of the distances among the poly(A) sites is shown in Supplementary Figure S1. This phenomenon, which we term ‘microheterogeneity’, could result from the generally slack nature of the polyadenylation machinery, causing, in turn, the likelihood of overestimating the number of APA sites in the genome. Therefore, to minimize the impact of microheterogeneity in our analysis, we aggregated poly(A) sites that were within 30 nt of each other and considered this grouping to be one unique poly(A) site. Table 2 lists the number of unique poly(A) sites on each gene. Over 50% of the genes have more than one unique poly(A) sites with a maximum number of 19 unique poly(A) sites in a single gene. These poly(A) sites represent the extent of the APA in rice genome.
Table 2.
Number of genes with alternative poly(A) sites
| Number of unique poly(A) site/gene | Number of genes | Percentage |
|---|---|---|
| 1 | 8315 | 49.17 |
| 2 | 4062 | 24.02 |
| 3 | 2240 | 13.25 |
| 4 or more | 2294 | 13.57 |
| Total | 16 911 | 100 |
To further study the position of these alternative poly(A) sites on the genes, we aligned all the 3′-UTR sequences to the annotated rice genome. The results (Table 3) showed that 53.41% of authenticated poly(A) sites are located in the annotated genic regions and that the majority of them (51.45%) are in the 3′-UTR, as expected. Surprisingly, about half of the poly(A) sites were found in the annotated intergenic regions. To gain an understanding of this group of poly(A) sites, we next examined whether they were located close to the ends of the genes. Indeed, 31.26% (17 127) of the poly(A) sites were mapped to the region between the annotated poly(A) site and 100 nt downstream of it. By comparison, only 34 poly(A) sites (0.06%) were found within 100 nt upstream of the annotated 5′ end of the gene. If the region after poly(A) site is extended to include the region between 1 and 500 nt (for those genes that do not have an annotated 3′-end, 1–1000 nt range is used), there is only slight increase (from 31.26% to 35.40%; Table 3). These results suggest that the identification of many poly(A) sites located downstream of an annotated poly(A) site may simply be the result of inaccurate or incomplete annotation from an insufficient number of EST or full-length cDNA sequences. To our surprise, 11.12% (6092; Table 3) of poly(A) sites are located in the intergenic region, which we define in this article as being at least 500 nt (or 1000 nt for genes without an annotated 3′-UTR) away from 3′-ends and 100 nt away from 5′-ends of currently annotated full-length cDNA. These poly(A) sites might have originated from unannotated genes or from small, noncoding or antisense RNAs. A similar observation has been made in human and mouse genomes where some poly(A) sites located in intergenic regions are thought to arise from novel transcripts (39).
Table 3.
The locations of poly(A) sites in the rice genome
| Category | Sub-category | Number of transcripts | Percentage |
|---|---|---|---|
| Aligned to genome | – | 54 786a | 100 |
| Located in | Coding sequences | 244 | 0.45 |
| the full- | Introns | 511 | 0.93 |
| length cDNA | 5′-UTR | 299 | 0.54 |
| 3′-UTR | 28 209 | 51.45 | |
| Subtotal | 29 263 | 53.41 | |
| Located nearby annotated transcript ends | Within 500 ntb downstream of 3′-end | 19 397 | 35.40 |
| Within 100 nt upstream of 5′-end | 34 | 0.06 | |
| Subtotal | 19 431 | 35.46 | |
| Located in the intergenic region | At least 500 ntb beyond currently annotated genes | 6092 | 11.12 |
aOnly those that were mapped to unique genomic sequences are shown.
bFor those genes that do not have an annotated 3′-UTR, 1000 nt (instead of 500 nt) downstream from their stop codons was used.
Interestingly, close to 2% of the poly(A) sites (1054 out of 55K) are located in the coding sequences (CDS), introns or 5′-UTRs. Further analysis shows that about 4% of total genes (662 out of 17169 genes that were mapped by the 55K poly(A) sites) use these nonconventional poly(A) sites. To verify these results, we manually mapped some poly(A) sites to the rice MPSS plus database (http://mpss.udel.edu/rice/) (40). Massively parallel signature sequencing (MPSS) is a high-throughput transcriptional profiling technology used for studying the comprehensive expression atlas (41). Although the exact locations of poly(A) sites cannot be deduced from this database, MPSS has been used to predict the extent of APA in Arabidopsis since the MPSS signatures are located on the closest DpnII restriction enzyme sites upstream of poly(A) sites (15). In the rice MPSS plus database, we manually searched over 100 of these nonconventional poly(A) sites and found over 50% to be supported by MPSS signatures, confirming that at least half of the cases use nonconventional poly(A) sites. Differences in annotations or incompleteness of MPSS data, among other possibilities, could account for the remaining unverified poly(A) sites. To demonstrate how multiple poly(A) sites are located in the genes and the features of MPSS signatures, we use the poly(A) sites of a WRKY DNA-binding domain containing protein LOC_Os01g47560 as an example (Figure 4). It has three unique poly(A) sites found in the 55K dataset, which are located in the CDS, 3′-UTR, and downstream of annotated poly(A) sites. The poly(A) site in the CDS truncated 42% of the total coding sequence, making it unlikely to produce a functional protein product. The two poly(A) sites that are located downstream of the stop codon have a 255 nt gap between them, thus increasing the likelihood that they carry different regulatory elements in their 3′-UTR. These results imply that APA could produce different proteins or nonfunctional proteins, or mRNA with different 3′-UTR properties, and could also serve as a regulatory mode in the gene expression regulation.
Figure 4.

An example of APA of WRKY DNA binding domain-containing protein (LOC_Os01g47560) that is supported by rice MPSS data. The red and pink boxes represent exons and the 3′-UTR, respectively. Vertical arrows show the positions of poly(A) sites. Triangles in orange indicate MPSS signatures inside annotated gene/feature, and the triangle in purple indicates MPSS signatures between genes. The grey triangles are potential MPSS signatures, but not confirmed. The top panel (except for the arrows) was an output from the MPSS-rice web site. The numbers indicate 3 different transcripts resulting from the use of different poly(A) sites. A(n) indicates a poly(A) tail. The vertical lines indicate splicing of the introns.
To further study if these APA sites use different cis-elements, we examined the polyadenylation signals around these APA sites. While the single nucleotide profiles of the 5′-UTR and intronic sites (Supplementary Figure S2) are similar to the general profile (as seen in Figure 1), that profile is very different around the APA sites that are located in the coding region. There, the transitions of A and U in the upstream of the poly(A) are no longer seen and the G and C contents are apparently higher (Figure 5A). Such a difference is not due to smaller sample size because when a similar number (about 250) of sequences from intronic and 5′-UTR APA sites were used, the profiles were similar to the general one (compare Figure 1 with Figure S2). Next, we investigated if the signal patterns for the coding region APA are different from the regular ones. As shown in Figure 5B, the NUE signal pattern logos of the coding region APA sites are highly G-rich elements when compared with the overall NUE logos in Table 1. This result, while reflecting the higher GC content in the coding region, implies that the poly(A) signals that direct the formation of APA in the coding sequences may be distinctly different from those signals of other poly(A) sites. It seems possible that these signals might be recognized by different polyadenylation factors, or assisted by other yet unknown proteins.
Figure 5.

Single nucleotide profiles and patterns around the APA site on the coding region. (A) One-nucleotide profiles of poly(A) sites in coding region. The location designation is the same as Figure 1. (B) Sequence logos in NUE region of poly(A) sites in coding region. Both TG- and AG-rich elements are unique.
Predictive modeling of rice polyadenylation sites
The unique features of the polyadenylation signals and nucleotide profiles (Figure 1) prompted us to devise an algorithm to predict rice poly(A) sites in an attempt to assist genome annotation and to scan transgenes to eliminate cryptic poly(A) sites that may hamper their expression in rice. We previously designed a program called Poly(A) Site Sleuth (or PASS) to predict poly(A) sites in Arabidopsis based on the GHMM (32,33). For the new model, we modified PASS using the features of rice polyadenylation signals (see Methods section) and named it PASS-Rice.
To evaluate the performance of our model, we employed two common measures: sensitivity (Sn) and specificity (Sp) (32). Sensitivity is defined as the fraction of true poly(A) sites correctly identified as positive, and specificity is the fraction of nonpoly(A) sites correctly predicted as negative by PASS-Rice. Thus, high Sp and Sn values positively correlate to the increased validity of prediction model results. In the model, the rice sequences containing a single poly(A) site were used to calculate Sn. Because not all poly(A) sites have been identified in each sequence of the dataset, we cannot calculate the real Sp value. Therefore, we use several negative control datasets, and a dataset with randomly generated sequences that preserves the trinucleotide distributions in the 3′-UTR, to evaluate Sp. As shown in Figure 6A, the descending line shows the variation of Sn, while the ascending lines show the variation of Sp in different datasets. Sp_Intron, Sp_5UTR, Sp_CDS and Sp_MC represent different Sp values calculated using rice introns, 5′-UTRs, coding sequences, and a randomly generated sequence dataset, respectively. Sn-3UTR represents the Sn calculated using the rice 3′-UTR sequences containing a single poly(A) site, and the prediction site is exactly the validated site. The PASS algorithm reached its best combination of specificity and sensitivity (∼90% each) when the threshold (score) was set at 4 (Figure 6A).
Figure 6.

Representative outputs and evaluation parameters of PASS-Rice. (A) The Sn and Sp based on PASS-Rice. The Sp values were calculated based on rice intron, 5′-UTR, coding sequences (CDS) and a random sequence set generated by Markov chain (MC) based on the 2nd order trinucleotide distribution of rice 3′-UTR. (B) An example output of PASS-Rice using Los_03g61890 with multiple poly(A) sites. Triangles indicate the poly(A) sites confirmed by EST data.
To test the validity of PASS-Rice, we examined many rice genes that have multiple poly(A) sites. The example given in Figure 6B shows a gene Los_Os03g61890 tested by PASS-Rice and indicates that most of the experimentally validated sites are within the highly scored (around 4) area of the 3′-UTR. However, PASS-Rice predicted peaks at around locations 350 nt and 370 nt, which were not validated by EST. This very likely results from the relatively small number of authenticated poly(A) sites corresponding to each gene (average ∼2 ESTs for each gene) or some other components, such as protein factors or RNA secondary structures, which were not considered when modeling.
We also used PASS-Rice to scan a 50 kb genomic sequence to see how it works in large-scale analysis. The results shown in Supplementary Figure S3 indicate that PASS-Rice can clearly detect ends of genes, thus making it potentially useful in genome annotation by predicting the ends of transcripts. This predictive model can also be used to screen for potentially undesirable poly(A) sites and eventually eliminate them through targeted mutations in the transgenes. The PASS-Rice program is available through our web site (www.polyA.org).
DISCUSSION
Using SignalSleuth and RSAT, we performed a detailed analysis of rice poly(A) signals covering 55 742 authenticated poly(A) sites, and the results were used to build a predictive model for rice poly(A) sites. We also found that APA is extensive in rice, with about 50% of the genes having at least two poly(A) sites that are 30 nt apart. In addition, many poly(A) sites, including some confirmed by MPSS, were found in the exon or intron regions of the genes. This could be an alternative mechanism for regulating gene activities. More interestingly, we suggested that the APA sites in the coding sequences may use a different set of polyadenylation signals. A significant amount of polyadenylated transcripts (∼11%) was found at least 500 nt outside 3′-end or 100 nt outside 5′-end of the currently annotated genic regions, indicating the presence of some unannotated transcripts.
The distribution of the poly(A) signal regions in rice is generally similar to the previous working model of Arabidopsis (13). However, by comparing the Arabidopsis and rice models, differences are noticeable, both in pattern compositions and length of elements. First, the AAUAAA signal (known as a canonical signal in mammals), still ranked the first on the NUE signal list, was only found in ∼7% of all tested rice 3′-UTRs in contrast to about 10% in Arabidopsis. This is also reflected in the signal logos (Table S4). Second, the FUE and CE occupy wider regions in rice than in Arabidopsis. Since the average length of the rice 3′-UTR is larger than that of Arabidopsis, this wider distribution of poly(A) signals possibly results from the less compact nature of the rice genome (Figure 1). Using the datasets of authentic poly(A) sites from Arabidopsis and rice, we are able to compare the usage of poly(A) signals in two model plants of monocot and dicot, respectively. RSAT results showed that signals from rice are more over-representative (shorter list of good signals with higher Z-scores) than those in Arabidopsis, suggesting that monocot plants tend to require stronger signals to guide the cleavage reaction. Moreover, GC-rich signal elements are found in the rice FUE region (Table 1, Tables S3 and S4). This might indicate that monocot plants can use more diverse FUE signals than dicot plants.
By making sequence logos, we identified 12 logos that concisely represent the three cis-elements. In the NUE, the logo with the largest percentage of hits is the one associated with AAUAAA. When using the logo to search the dataset, we found that this logo covers about 80% of sequences, whereas use of the single pattern count resulted in finding only 7% of sequences containing AAUAAA. These results suggest that many sequences contain signals similar to AAUAAA. Indeed, the AAUAAA signal can tolerate mutations so well that one- or two-nucleotide alterations may not even affect polyadenylation efficiency significantly (42,43). This clearly contrasts to the polyadenylation signals in mammals where AAUAAA signals can be found in over 50% of the genes (4) and much less tolerance to mutations (44), while only about 7–10% of plant mRNA poly(A) signals possess AAUAAA signals [Figure 2; (13)]. In the FUE region, FUE.2, one of elements with the highest percentage of hits, contains a UGUA motif, which was also found to be highly distinctly present in FUE over coding by using another approach. Interestingly, the same UGUA motif has also been implicated in human and yeast poly(A) site recognition by both computational studies and biochemical experiments (6,8). In plants, a longer signal, UUUGUA, was previous known to be important for the FUE function (43). In addition, a GC-rich element in the FUE region of rice (Table 1, FUE.7) can be found in human 3′-UTRs too (4). Taken together, our data support the notion that there is a commonality of some cis-elements among yeast, animal and plant poly(A) signals.
Microheterogeneity, as defined earlier, is used here to describe a number of poly(A) sites located in a short region of mRNA. Essentially resulting from the disorderly nature of the polyadenylation machinery, microheterogeneity can cause misinterpretation and/or overestimation of the prevalence of APA and, hence, the number of poly(A) sites. Poly(A) sites with a distance of around 30 nt are most likely to be determined by the same set of poly(A) signals since the NUE signals can function in this range. In this report, we therefore set the length of microheterogeneity to be 30 nt and aggregated poly(A) sites within 30 nt of each other as one unique poly(A) site. This step avoids repeat counts of similar poly(A) sites with the likelihood of no significant biological consequence. Excluding the effects of microheterogeneity, then, we found that 50% of rice genes have two or more poly(A) sites. This is very interesting because about 50% of human genes were also found to have alternative poly(A) sites (45). Previous studies in Arabidopsis using MPSS technology reported that APA was observed in 25% of genes and occurred in the exons, introns or 3′-UTRs (15). However, the MPSS approach was unable to detect the exact position of poly(A) sites in the genes, indicating the potential for underestimating the true extent of APA. On the other hand, our EST-based analysis is able to distinguish the poly(A) sites with highest resolution at the level of individual nucleotide, thus providing a more accurate survey of APA in plants. Overall, the significance of extensive APA in plants is still to be elucidated.
Through poly(A) site mapping of the rice genome, we also found that about 2% of the 55K poly(A) sites are located in the region beyond 3′-UTRs. These account for 3.86% (662 out of 17 169 analyzed here) of rice genes using this type of APA to produce transcripts encoding truncated or altered proteins. Moreover, about 50% of these nonconventional poly(A) sites are supported by MPSS evidence. The scope of such extensive APA suggests a widespread role of APA as an important mechanism for plant gene expression regulation. Further study of this mechanism should give rise meaningful insight into this phenomenon in plants.
In animal cells, the difference in 3′-UTR lengths is related, in a degree, to regulation of miRNAs (46). In plant cells, since most miRNAs target sites located in the coding regions (47), variation of 3′-UTR length could be implicated in the regulation of transportation, stability and translation, a hypothesis that remains to be tested. In contrast to the variants within 3′-UTR, the presence of alternative poly(A) sites in the other regions of a gene (e.g. those matching annotated introns or exons) may truncate the open reading frame, producing different types of transcripts and/or protein products. In addition, the question of if such altered transcripts can be targets of miRNA remains to be answered.
Based on our previous work involving poly(A) site prediction in Arabidopsis, we designed a new algorithm for the prediction of poly(A) in rice. This modified version is termed PASS-Rice. Using PASS-Rice, we can find regular and alternative poly(A) sites, or the ends of genes, and predict unwanted poly(A) sites in transgenes, thus making PASS-Rice a potential useful tool in genome annotation and crop genetic engineering applications. Given the fact that there are some levels of species specificity of the poly(A) signals, as discussed earlier, each predictive model may need to be modified by using species-unique poly(A) signal features, as is the case when using the Arabidopsis model in rice. The quality of the prediction is similar to the original PASS (32). As the field of bioinformatics advances, one would expect that other modeling techniques become available (48). At the same time, adaptation of advanced feature generation, selection and classification methods to the prediction of poly(A) sites in plants remains a future task. Still, prediction accuracy is not likely to be dramatically improved without significant improvement of characterized poly(A) signals. Such improvement may possibly arise from the availability of data gained from analysis of polyadenylation signals pertinent to subsets of genes involved in different developmental stages, tissue and/or pathway specificities. Although such information has been made available for human genes (14), it is still largely missing in plants due to a lack of large-scale collection of poly(A) sites that are associated with these tissue and developmental stage specific samples. Further improvement of the prediction algorithm will doubtlessly enhance our ability to annotation poly(A) sites and currently unknown transcripts.
SUPPLEMENTARY DATA
Supplementary Data are available at NAR Online.
ACKNOWLEDGEMENTS
We thank other Li Lab members and Art Hunt's group for helpful discussions, David Martin for editorial assistance and two anonymous reviewers for their constructive suggestions. This study was supported by U.S. National Science Foundation's Arabidopsis 2010 Program (MCB 0313472), Ohio Plant Biotech Consortium, Miami University Center for Academic Computational Research (all to Q.Q.L.) and Botany Department Academic Challenge Grants (to Y.S.). The computational facility was supported in part by an U.S. NSF Major Research Instrumentation Grant (DBI-0420479 to Q.Q.L. and others). Research in the Ji Lab was supported by funds from the National Natural Science Foundation of China (Project # 60774033), the Fujian Natural Science Foundation (B0710031) and the Specialized Research Fund for the Doctoral Program of Higher Education of China (20070384003).
Conflict of interest statement. None declared.
REFERENCES
- 1.Proudfoot NJ, Furger A, Dye MJ. Integrating rnRNA processing with transcription. Cell. 2002;108:501–512. doi: 10.1016/s0092-8674(02)00617-7. [DOI] [PubMed] [Google Scholar]
- 2.Zhao J, Hyman L, Moore C. Formation of mRNA 3′ ends in eukaryotes: mechanism, regulation, and interrelationships with other steps in mRNA synthesis. Microbiol. Mol. Biol. Rev. 1999;63:405–445. doi: 10.1128/mmbr.63.2.405-445.1999. [DOI] [PMC free article] [PubMed] [Google Scholar]
- 3.Gilmartin GM. Eukaryotic mRNA 3′ processing: a common means to different ends. Genes Dev. 2005;19:2517–2521. doi: 10.1101/gad.1378105. [DOI] [PubMed] [Google Scholar]
- 4.Hu J, Lutz CS, Wilusz J, Tian B. Bioinformatic identification of candidate cis-regulatory elements involved in human mRNA polyadenylation. RNA. 2005;11:1485–1493. doi: 10.1261/rna.2107305. [DOI] [PMC free article] [PubMed] [Google Scholar]
- 5.Salisbury J, Hutchison KW, Graber JH. A multispecies comparison of the metazoan 3'-processing downstream elements and the CstF-64 RNA recognition motif. BMC Genom. 2006;7:55. doi: 10.1186/1471-2164-7-55. [DOI] [PMC free article] [PubMed] [Google Scholar]
- 6.Venkataraman K, Brown KM, Gilmartin GM. Analysis of a noncanonical poly(A) site reveals a trinartite mechanism for vertebrate poly(A) site recognition. Genes Dev. 2005;19:1315–1327. doi: 10.1101/gad.1298605. [DOI] [PMC free article] [PubMed] [Google Scholar]
- 7.Graber JH, Cantor CR, Mohr SC, Smith TF. In silico detection of control signals: mRNA 3′-end-processing sequences in diverse species. Proc. Natl Acad. Sci. USA. 1999;96:14055–14060. doi: 10.1073/pnas.96.24.14055. [DOI] [PMC free article] [PubMed] [Google Scholar]
- 8.Graber JH, Cantor CR, Mohr SC, Smith TF. Genomic detection of new yeast pre-mRNA 3′-end-processing signals. Nucleic Acids Res. 1999;27:888–894. doi: 10.1093/nar/27.3.888. [DOI] [PMC free article] [PubMed] [Google Scholar]
- 9.Hunt AG. Regulation of Gene Expression in Plants: The Role of Transcript Structure and Processing. In: Bassett CL, editor. New York: Springer; 2007. pp. 101–122. [Google Scholar]
- 10.Li QS, Hunt AG. The polyadenylation of RNA in plants. Plant Physiol. 1997;115:321–325. doi: 10.1104/pp.115.2.321. [DOI] [PMC free article] [PubMed] [Google Scholar]
- 11.Rothnie HM. Plant mRNA 3′-end formation. Plant Mol. Biol. 1996;32:43–61. doi: 10.1007/BF00039376. [DOI] [PubMed] [Google Scholar]
- 12.Rothnie HM, Chen G, Futterer J, Hohn T. Polyadenylation in rice tungro bacilliform virus: cis-acting signals and regulation. J. Virol. 2001;75:4184–4194. doi: 10.1128/JVI.75.9.4184-4194.2001. [DOI] [PMC free article] [PubMed] [Google Scholar]
- 13.Loke JC, Stahlberg EA, Strenski DG, Haas BJ, Wood PC, Li QQ. Compilation of mRNA polyadenylation signals in Arabidopsis revealed a new signal element and potential secondary structures. Plant Physiol. 2005;138:1457–1468. doi: 10.1104/pp.105.060541. [DOI] [PMC free article] [PubMed] [Google Scholar]
- 14.Zhang H, Lee JY, Tian B. Biased alternative polyadenylation in human tissues. Genome Biol. 2005;6:R100. doi: 10.1186/gb-2005-6-12-r100. [DOI] [PMC free article] [PubMed] [Google Scholar]
- 15.Meyers BC, Vu TH, Tej SS, Ghazal H, Matvienko M, Agrawal V, Ning JC, Haudenschild CD. Analysis of the transcriptional complexity of Arabidopsis thaliana by massively parallel signature sequencing. Nat. Biotech. 2004;22:1006–1011. doi: 10.1038/nbt992. [DOI] [PubMed] [Google Scholar]
- 16.Chuvpilo S, Zimmer M, Kerstan A, Glockner J, Avots A, Escher C, Fischer C, Inashkina I, Jankevics E, Berberich-Siebelt F, et al. Alternative polyadenylation events contribute to the induction of NF-ATc in effector T cells. Immunity. 1999;10:261–269. doi: 10.1016/s1074-7613(00)80026-6. [DOI] [PubMed] [Google Scholar]
- 17.Peterson ML. Mechanisms controlling production of membrane and secreted immunoglobulin during B cell development. Immunol. Res. 2007;37:33–46. doi: 10.1007/BF02686094. [DOI] [PubMed] [Google Scholar]
- 18.Simpson GG, Dijkwel PP, Quesada V, Henderson I, Dean C. FY is an RNA 3′ end-processing factor that interacts with FCA to control the Arabidopsis floral transition. Cell. 2003;113:777–787. doi: 10.1016/s0092-8674(03)00425-2. [DOI] [PubMed] [Google Scholar]
- 19.Quesada V, Dean C, Simpson GG. Regulated RNA processing in the control of Arabidopsis flowering. Int. J. Dev. Biol. 2005;49:773–780. doi: 10.1387/ijdb.051995vq. [DOI] [PubMed] [Google Scholar]
- 20.Lee JH, Cho YS, Yoon HS, Suh MC, Moon J, Lee I, Weigel D, Yun CH, Kim JK. Conservation and divergence of FCA function between Arabidopsis and rice. Plant Mol. Biol. 2005;58:823–838. doi: 10.1007/s11103-005-8105-8. [DOI] [PubMed] [Google Scholar]
- 21.Winichayakul S, Beswick NL, Dean C, Macknight RC. Components of the Arabidopsis autonomous floral promotion pathway, FCA and FY, are conserved in monocots. Funct. Plant Biol. 2005;32:345–355. doi: 10.1071/FP04245. [DOI] [PubMed] [Google Scholar]
- 22.Xing D, Zhao H, Xu R, Li QQ. Arabidopsis PCFS4, a homologue of yeast polyadenylation factor Pcf11p, regulates FCA alternative processing and promotes flowering time. Plant J., [Epub ahead of print] doi:10.1111/j.1365-313CX.2008. 2008 doi: 10.1111/j.1365-313X.2008.03455.x. [DOI] [PubMed] [Google Scholar]
- 23.Tang GL, Zhu XH, Gakiere B, Levanony H, Kahana A, Galili G. The bifunctional LKR/SDH locus of plants also encodes a highly active monofunctional lysine-ketoglutarate reductase using a polyadenylation signal located within an intron. Plant Physiol. 2002;130:147–154. doi: 10.1104/pp.005660. [DOI] [PMC free article] [PubMed] [Google Scholar]
- 24.Delaney KJ, Xu RQ, Zhang JX, Li QQ, Yun KY, Falcone DL, Hunt AG. Calmodulin interacts with and regulates the RNA-binding activity of an Arabidopsis polyadenylation factor subunit. Plant Physiol. 2006;140:1507–1521. doi: 10.1104/pp.105.070672. [DOI] [PMC free article] [PubMed] [Google Scholar]
- 25.Tan X, Meyers BC, Kozik A, West MA, Morgante M, St Clair DA, Bent AF, Michelmore RW. Global expression analysis of nucleotide binding site-leucine rich repeat-encoding and related genes in Arabidopsis. BMC Plant Biol. 2007;7:56. doi: 10.1186/1471-2229-7-56. [DOI] [PMC free article] [PubMed] [Google Scholar]
- 26.Dong HT, Deng Y, Chen J, Wang S, Peng SH, Dai C, Fang YQ, Shao J, Lou YC, Li DB. An exploration of 3′-end processing signals and their tissue distribution in Oryza sativa. Gene. 2007;389:107–113. doi: 10.1016/j.gene.2006.10.015. [DOI] [PubMed] [Google Scholar]
- 27.Lu Y, Gao C-X, Han B. Sequence analysis of mRNA polyadenylation signals of rice genes. Chin. Sci. Bull. 2006;51:1069–1077. [Google Scholar]
- 28.Chen F, Macdonald CC, Wilusz J. Cleavage site determinants in the mammalian polyadenylation signal. Nucleic Acids Res. 1995;23:2614–2620. doi: 10.1093/nar/23.14.2614. [DOI] [PMC free article] [PubMed] [Google Scholar]
- 29.Moore CL, Skolnikdavid H, Sharp PA. Analysis of RNA cleavage at the Adenovirus-2 L3 polyadenylation site. EMBO J. 1986;5:1929–1938. doi: 10.1002/j.1460-2075.1986.tb04446.x. [DOI] [PMC free article] [PubMed] [Google Scholar]
- 30.Sheets MD, Ogg SC, Wickens MP. Point mutations in AAUAAA and the poly(a) addition site – effects on the accuracy and efficiency of cleavage and polyadenylation invitro. Nucleic Acids Res. 1990;18:5799–5805. doi: 10.1093/nar/18.19.5799. [DOI] [PMC free article] [PubMed] [Google Scholar]
- 31.Campbell MA, Haas BJ, Hamilton JP, Mount SM, Buell CR. Comprehensive analysis of alternative splicing in rice and comparative analyses with Arabidopsis. BMC Genome. 2006;7 doi: 10.1186/1471-2164-7-327. [DOI] [PMC free article] [PubMed] [Google Scholar]
- 32.Ji G, Zheng J, Shen Y, Wu X, Jiang R, Lin Y, Loke JC, Davis KM, Reese GJ, Li QQ. Predictive modeling of plant messenger RNA polyadenylation sites. BMC Bioinformatics. 2007;8:43. doi: 10.1186/1471-2105-8-43. [DOI] [PMC free article] [PubMed] [Google Scholar]
- 33.Ji G, Wu X, Zheng J, Shen Y, Li QQ. Modeling plant mRNA poly(A) sites: software design and implementation. J. Comput. Theoret. Nanosci. 2007;4:1365–1368. [Google Scholar]
- 34.Crooks GE, Hon G, Chandonia JM, Brenner SE. WebLogo: a sequence logo generator. Genome Res. 2004;14:1188–1190. doi: 10.1101/gr.849004. [DOI] [PMC free article] [PubMed] [Google Scholar]
- 35.Kent WJ. BLAT—the BLAST-like alignment tool. Genome Res. 2002;12:656–664. doi: 10.1101/gr.229202. [DOI] [PMC free article] [PubMed] [Google Scholar]
- 36.Van Helden J, Del Olmo M, Perez-Ortin JE. Statistical analysis of yeast genomic downstream sequences reveals putative polyadenylation signals. Nucleic Acids Res. 2000;28:1000–1010. doi: 10.1093/nar/28.4.1000. [DOI] [PMC free article] [PubMed] [Google Scholar]
- 37.Graber JH, McAllister GD, Smith TF. Probabilistic prediction of Saccharomyces cerevisiae mRNA 3′-processing sites. Nucleic Acids Res. 2002;30:1851–1858. doi: 10.1093/nar/30.8.1851. [DOI] [PMC free article] [PubMed] [Google Scholar]
- 38.Seiler KP, George GA, Happ MP, Bodycombe NE, Carrinski HA, Norton S, Brudz S, Sullivan JP, Muhlich J, Serrano M, et al. ChemBank: a small-molecule screening and cheminformatics resource database. Nucleic Acids Res. 2008;36:D351–359. doi: 10.1093/nar/gkm843. [DOI] [PMC free article] [PubMed] [Google Scholar]
- 39.Lopez F, Granjeaud S, Ara T, Ghattas B, Gautheret D. The disparate nature of ‘intergenic’ polyadenylation sites. RNA. 2006;12:1794–1801. doi: 10.1261/rna.136206. [DOI] [PMC free article] [PubMed] [Google Scholar]
- 40.Nobuta K, Venu RC, Lu C, Beló A, Vemaraju K, Kulkarni K, Wang W, Pillay M, Green PJ, Wang GL, et al. An expression atlas of rice mRNAs and small RNAs. Nat. Biotechnol. 2007;25:473–477. doi: 10.1038/nbt1291. [DOI] [PubMed] [Google Scholar]
- 41.Brenner S, Johnson M, Bridgham J, Golda G, Lloyd DH, Johnson D, Luo S, McCurdy S, Foy M, Ewan M, et al. Gene expression analysis by massively parallel signature sequencing (MPSS) on microbead arrays. Nat. Biotechnol. 2000;18:630–634. doi: 10.1038/76469. [DOI] [PubMed] [Google Scholar]
- 42.Li QQ, Hunt AG. A near upstream element in a plant polyadenylation signal consists of more than six bases. Plant Mol. Biol. 1995;28:927–934. doi: 10.1007/BF00042076. [DOI] [PubMed] [Google Scholar]
- 43.Rothnie HM, Reid J, Hohn T. The contribution of AAUAAA and the upstream element UUUGUA to the efficiency of mRNA 3′-end formation in plants. EMBO J. 1994;13:2200–2210. doi: 10.1002/j.1460-2075.1994.tb06497.x. [DOI] [PMC free article] [PubMed] [Google Scholar]
- 44.Wilusz J, Pettine SM, Shenk T. Functional analysis of point mutations in the AAUAAA motif of the SV40 late polyadenylation signal. Nucleic Acids Res. 1989;17:3899–3908. doi: 10.1093/nar/17.10.3899. [DOI] [PMC free article] [PubMed] [Google Scholar]
- 45.Ara T, Lopez F, Ritchie W, Benech P, Gautheret D. Conservation of alternative polyadenylation patterns in mammalian genes. BMC Genome. 2006;7:189. doi: 10.1186/1471-2164-7-189. [DOI] [PMC free article] [PubMed] [Google Scholar]
- 46.Bartel DP. MicroRNAs: genomics, biogenesis, mechanism, and function. Cell. 2004;116:281–297. doi: 10.1016/s0092-8674(04)00045-5. [DOI] [PubMed] [Google Scholar]
- 47.Jones-Rhoades MW, Bartel DP. Computational identification of plant microRNAs and their targets, including a stress-induced miRNA. Mol. Cell. 2004;14:787–789. doi: 10.1016/j.molcel.2004.05.027. [DOI] [PubMed] [Google Scholar]
- 48.Cheng Y, Miura RM, Tian B. Prediction of mRNA polyadenylation sites by support vector machine. Bioinformatics. 2006;22:2320–2325. doi: 10.1093/bioinformatics/btl394. [DOI] [PubMed] [Google Scholar]
Associated Data
This section collects any data citations, data availability statements, or supplementary materials included in this article.